Current dynamics
The USD/CAD pair rose at the beginning of today's trading. The pair is in a strong downtrend since reaching its highest at 1.30763 in mid-May.
The expectations of the Canadian Central Bank to raise the interest rate by another half a percentage point on the first of June, with the rise in oil prices as a result of the Russian-Ukrainian war, which led to the disruption of supply routes and raising energy costs, as it is considered the most important export to Canada, all this is a logical explanation for this superior performance of the Canadian dollar.
On the other side, the Central Bank of Canada sees the utmost importance of raising interest rates, after the annual inflation rate reached its highest level in 31 years at 6.8% in April, which is more than three times the bank's target of 2%.
Meanwhile, Bank of Canada Deputy Governor Tony Gravel said in a previous speech, “We are facing an economy that is showing clear signs of overheating, and very tight labor markets.” He stressed the need to raise interest rates in a neutral range of 2 to 3% in order to control the economy. Existing inflation and rebalancing the Canadian economy.
Also Stephen Tapp, chief economist at the Canadian Chamber of Commerce, said in a statement Monday: "These cost pressures will continue to fuel inflation, which will add further pressure on the Bank of Canada to continue raising interest rates at a super-sized pace in its attempt to control inflation.
However, the resilience of the Canadian dollar will be tested amid mounting concerns about an upcoming recession in recent weeks. Economists have lowered their 2023 global GDP forecast.
Looking at the most important economic events expected today, the Canadian GDP data will be one of the most important data in the Canadian economic calendar, and on the first of June, the interest decision issued by the central bank will be the most important, which may cause fluctuations in performance if the output is unexpected.
Support and resistance levels
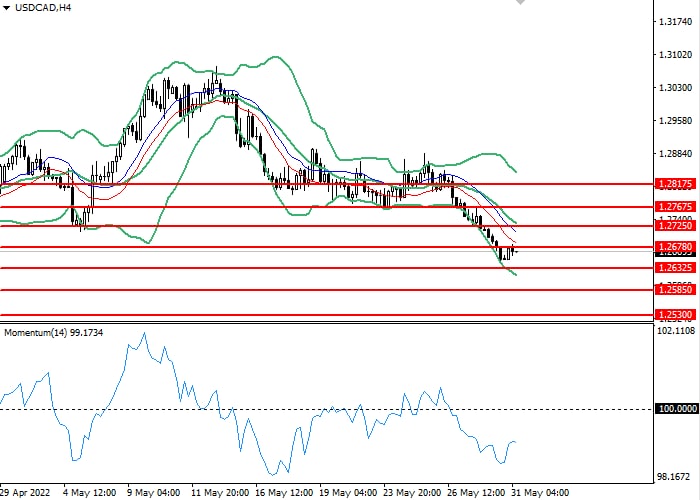
On the 4 hour chart, the tool is correcting at the lower band of the Bollinger Bands. The indicator is heading up and the price range has shrunk, which indicates the presence of corrective dynamics. The Momentum histogram is above the 100 level, which gives sell signals. Envelopes indicator gives clear signals for sale. - Support levels: 1.2630, 1.2585, 1.2530.
- Resistance levels: 1.2680, 1.2725, 1.2770, 1.2820.
Trading scenarios
- Sell stop position may be opened from the level 1.26325 with target 1.25850 and stop-loss 1.26780. Implementation period: 1-2days.
- Buy stop position may be opened from the level of 1.26780 with target 1.27250 and stop-loss 1.26325. Implementation period: 1-2 days.