Brent H1: Ишимоку прогноз на европейскую сессию на 27.3.2025
27.03.2025 09:16
Технический
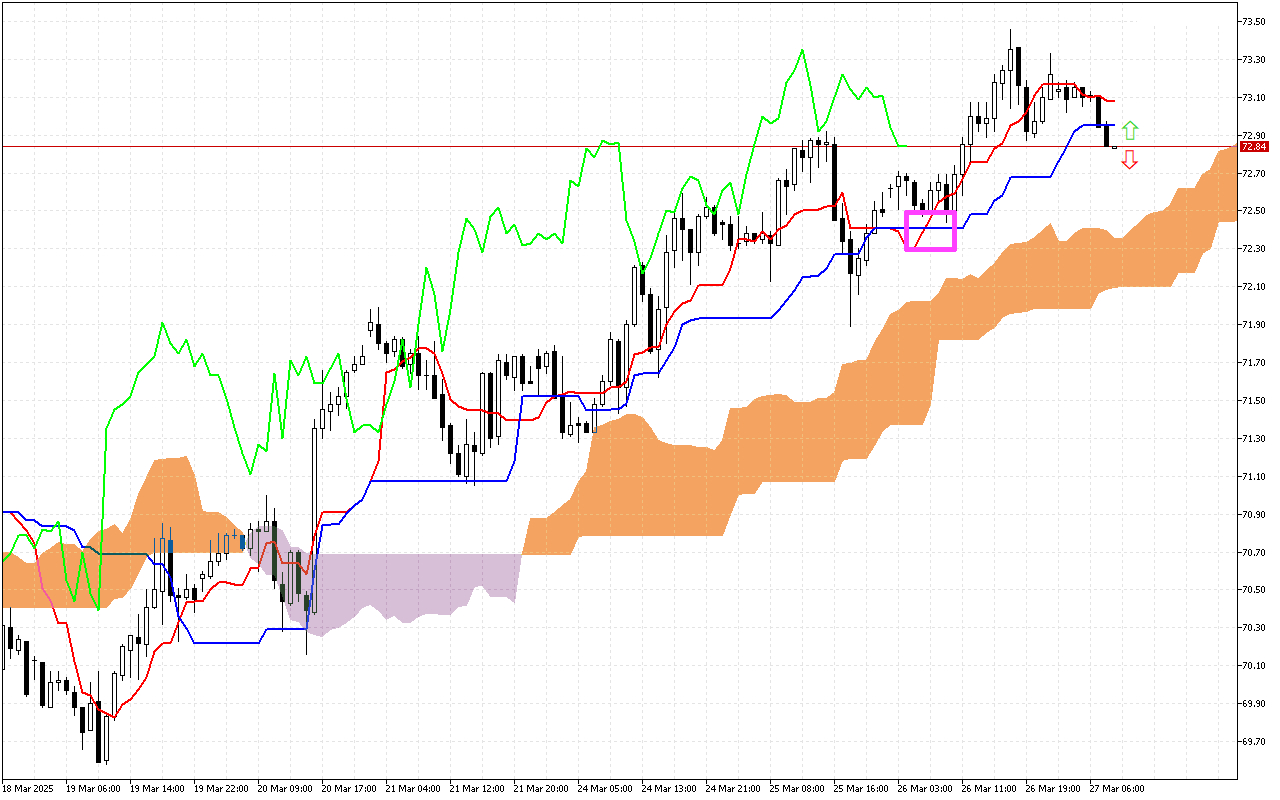
Одним из наиболее важных сигналов в индикаторе Ишимоку является пересечение линий Tenkan и Kijun. На текущем графике Brent данный сигнал отмечен розовым квадратом. Последующее развитие событий привело к снижению цены под линию Tenkan. Восходящий импульс, который первоначально предполагался пересечением, не материализовался. Вместо этого, цена продемонстрировала слабость и не смогла удержаться на достигнутых уровнях.
Текущая ситуация
Давайте внимательно рассмотрим текущие значения основных составляющих индикатора Ишимоку, чтобы оценить состояние рынка на данный момент:
Цена находится ниже линий Tenkan и Kijun, которые не успели отреагировать на изменение рыночной ситуации.
Динамика движения цены на более длинной дистанции определяется облаком Kumo, которое сейчас окрашено в оранжевый цвет. Поэтому данный сигнал отдает приоритет восходящему вектору движения цены в будущем.
Сейчас линии облака Kumo представляют собой динамическую область поддержки для цены.
Используемая инвесторами для определения смены тенденции, зеленая линия Chikou на графике удерживается под ценой.
Торговые рекомендации:
Динамические уровни поддержки находятся на линиях Kijun, около отметки 72.95, SenkouA, на уровне 72.40 и SenkouB, около 72.09.
Динамический уровень сопротивления находится на линии Tenkan, в районе отметки 73.09.
По итогу анализа большинство компонентов индикатора Ишимоку указывают на предстоящий рост цены. Поэтому внутри дня стоит отдавать предпочтение длинным позициям, которые можно рассматривать от обозначенных уровней поддержки.