
Technical analysis AUDUSD for 20.07.2023
Внутридневный
Технический
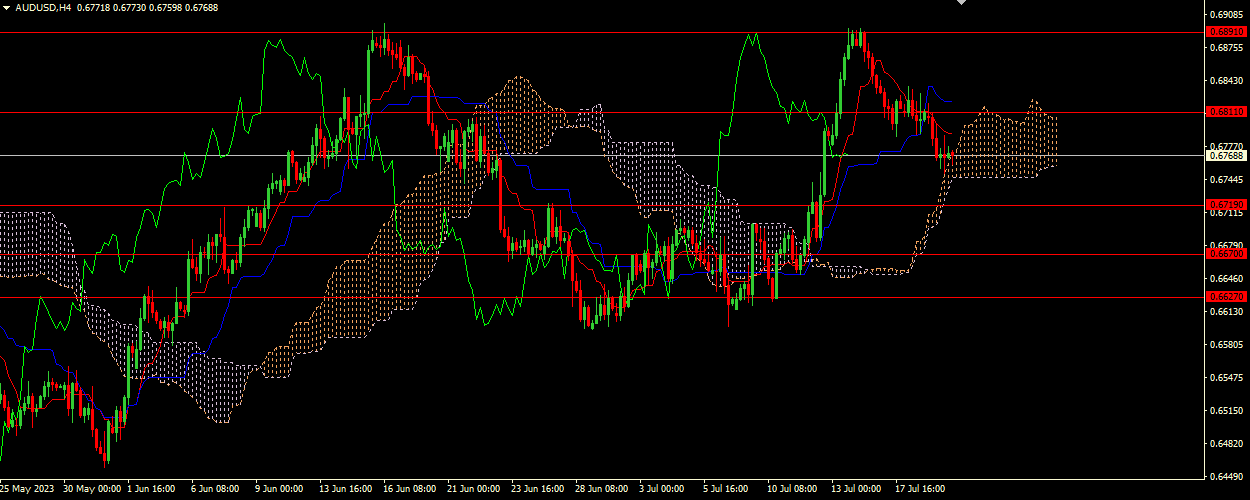
The Tenkan-sen line is located below the Kijun-sen line. Both lines are horizontal. Confirmatory line Chikou Span is below the price chart
The Tenkan-sen line is located below the Kijun-sen line. Both lines are horizontal. Confirmatory line Chikou Span is below the price chart. In this case, the cloud is ascending. Instrument is trading below the Tenkan-se and Kijun-sen lines. The closest resistance is the level 0.68110. The closest support is the level 0.67190
Key levels
- 0.70500, 0.69910, 0.68110, 0.67190, 0.66700, 0.66270
Trading scenario
- Recommended opening long positions (Buy Stop) from the level of 0.68110, with Take Profit of 0.69910 and Stop Loss of 0.67550
Alternative scenario
- Recommended opening short positions (Sell Stop) from the level of 0.67190, with Take Profit of 0.66700 and Stop Loss of 0.67550
Сценарии
Рекомендации
BUY STOP
Точка входа
0.68110
Take Profit
0.69910
Stop Loss
0.67550
Ключевые уровни
0.70500, 0.69910, 0.68110, 0.67190, 0.66700, 0.66270
Альтернативный сценарий
Рекомендации
SELL STOP
Точка входа
0.67190
Take Profit
0.66700
Stop Loss
0.67550

Автор
Nikolai Krishtopov
Рыночный аналитик и менеджер по маркетингу, Investizo
Николай Криштопов — рыночный аналитик Investizo с более чем 15-летним опытом работы в индустрии финансовых рынков и более чем десятилетним опытом трейдинга. В сферу его интересов входят валютный и криптовалютный рынки, технический анализ, внутридневная торговля и поведение рынка.