
USDCAD H1: The Ichimoku Forecast for the Asian Session on 16.2.2025

작성자:
Nikolai Krishtopov
기술적
The key moment of previous trading sessions was the intersection of the Tenkan and Kijun lines. This signal is marked on the chart with a pink square and indicates a...
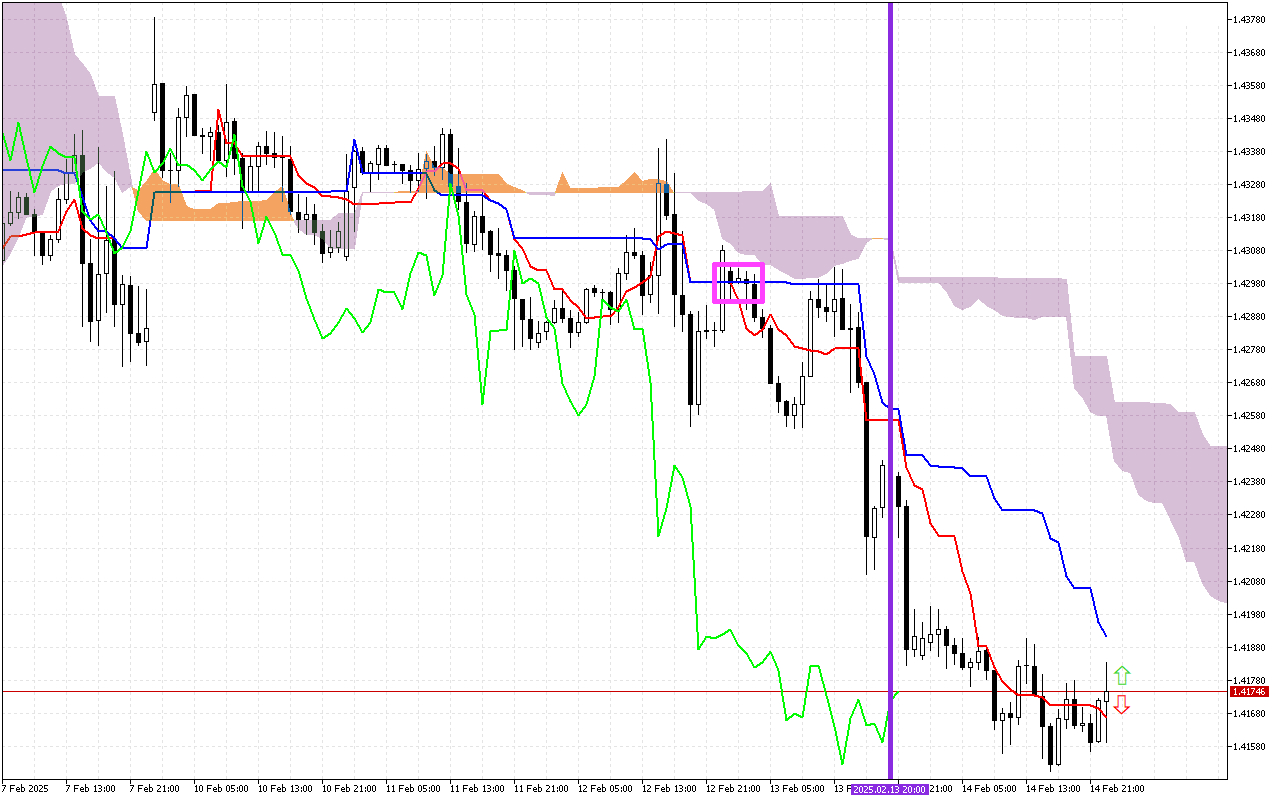
The key moment of previous trading sessions was the intersection of the Tenkan and Kijun lines. This signal is marked on the chart with a pink square and indicates a change in the trend to a downward one. However, subsequently the price was noted to have risen above the Tenkan line, indicating weakness in the downward momentum.
The second most important signal is the change in direction of the Kumo cloud, marked with a vertical purple line. A change in the color of the cloud to lilac indicates a transition of the priority direction of movement to downward.
The current situation
Let's look at the main components of the indicator and their current values:
The price is now positioned between the Tenkan and the Kijun lines, indicating a temporary consolidation before a potential resumption of the trend.
The Kumo cloud is colored lilac. It indicates the priority of the downward vector of price movement.
The price is below the Kumo cloud, which is now acting as a resistance area for the price.
The Chikou line is now below the current price.
Trading recommendations:
The dynamic support level is on the Tenkan line, around the 1.41696 mark.
Dynamic resistance levels are located on the Kijun line, near the 1.41955, the SenkouA line, at the 1.42581 mark, and the SenkouB line, near the 1.42758 mark.
The indicator signals support a downward vector of price movement, so the search for the short positions entry points should be prioritized.
The second most important signal is the change in direction of the Kumo cloud, marked with a vertical purple line. A change in the color of the cloud to lilac indicates a transition of the priority direction of movement to downward.
The current situation
Let's look at the main components of the indicator and their current values:
The price is now positioned between the Tenkan and the Kijun lines, indicating a temporary consolidation before a potential resumption of the trend.
The Kumo cloud is colored lilac. It indicates the priority of the downward vector of price movement.
The price is below the Kumo cloud, which is now acting as a resistance area for the price.
The Chikou line is now below the current price.
Trading recommendations:
The dynamic support level is on the Tenkan line, around the 1.41696 mark.
Dynamic resistance levels are located on the Kijun line, near the 1.41955, the SenkouA line, at the 1.42581 mark, and the SenkouB line, near the 1.42758 mark.
The indicator signals support a downward vector of price movement, so the search for the short positions entry points should be prioritized.
작성자
Nikolai Krishtopov
마켓 애널리스트 겸 마케팅 매니저, Investizo
니콜라이 크리시토포프는 Investizo의 마켓 애널리스트로, 금융시장 업계에서 15년 이상의 경력과 10년이 넘는 트레이딩 경험을 보유하고 있습니다. 그의 주요 관심 분야는 외환 및 암호화폐 시장, 기술적 분석, 데이 트레이딩, 시장 행태입니다.