
Fundamental analysis of WTI
Prices for U.S. WTI crude oil declined for the second day in a row amid weak economic data from China and the resumption of oil production in Libya. Concerns about oil demand intensified after China, the world's second-largest oil consumer, recorded a slowdown in growth in the second quarter. The slowdown was exacerbated by Libya's decision to restart oil production and a strengthening U.S. dollar, leading to lower demand for dollar-denominated goods.
China's GDP grew just 0.8% quarter-on-quarter in the second quarter, falling short of expectations and raising concerns about the health of the country's economy. However, Chinese refineries increased daily crude throughput by 1.6% in June compared to May, coinciding with a rise in imports last month. Although the market is mainly focused on overall GDP figures, oil demand has risen significantly year-on-year. The Chinese government should be wary of stimulating the economy further given the risk of rising commodity prices.
On a stimulus note, Russia is reporting lower oil exports from its western ports next month. Exports are expected to fall by 100,000-200,000 bpd from July, reflecting Russia's willingness to work with world leaders to further reduce supply.
The slowdown in US inflation over the past week also helped oil prices. Market participants expect the Fed to be more cautious in tightening policy after an expected rate hike at its July 26 meeting. The International Energy Agency forecasts oil demand to reach record levels this year despite unfavorable economic factors. Later this week, key US data, including the manufacturing index and June retail sales, will be released, which will be important in determining the future direction of WTI crude oil prices.
WTI is currently trading around 74.20 USD. The recent correction in WTI appears to be a result of oil traders capitalizing on a third consecutive week of gains. Slowing growth in China, recovering oil production in Libya and Nigeria, OPEC production cuts, possible Fed policy direction and possible supply cuts in Russia will weigh on oil prices.
Technical analysis and scenarios:
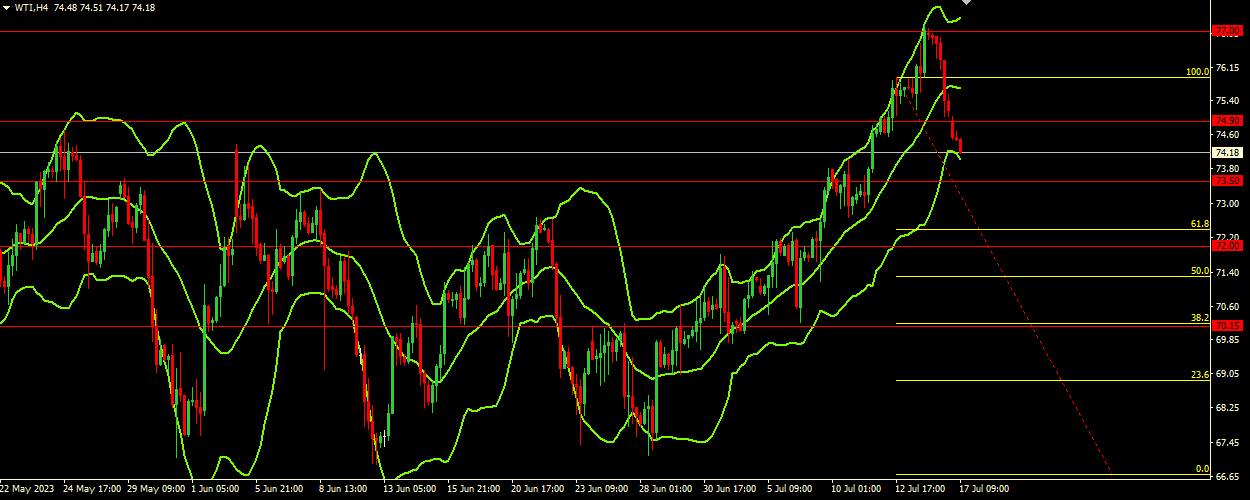
The Bollinger Bands indicator shows a price range between the upper band at $77.25 and the lower band at $74.00, with the middle band at $75.65. The indicator is currently pointing horizontally, indicating that there is no strong trend. The price range is widening, indicating a possible increase in volatility. The current price, $74.30, is in the lower range of the Bollinger Bands, indicating upside potential.
Main scenario (BUY)
Recommended entry level: 74.90.
Take Profit: 77.00.
Stop loss: 74.20.
Alternative scenario (SELL)
Recommended entry level: 73.50.
Take Profit: 72.00.
Stop loss: 74.20.