
USDJPY H1: The Ichimoku Forecast for the European Session at 31.10.2024
31.10.2024 14:46
기술적
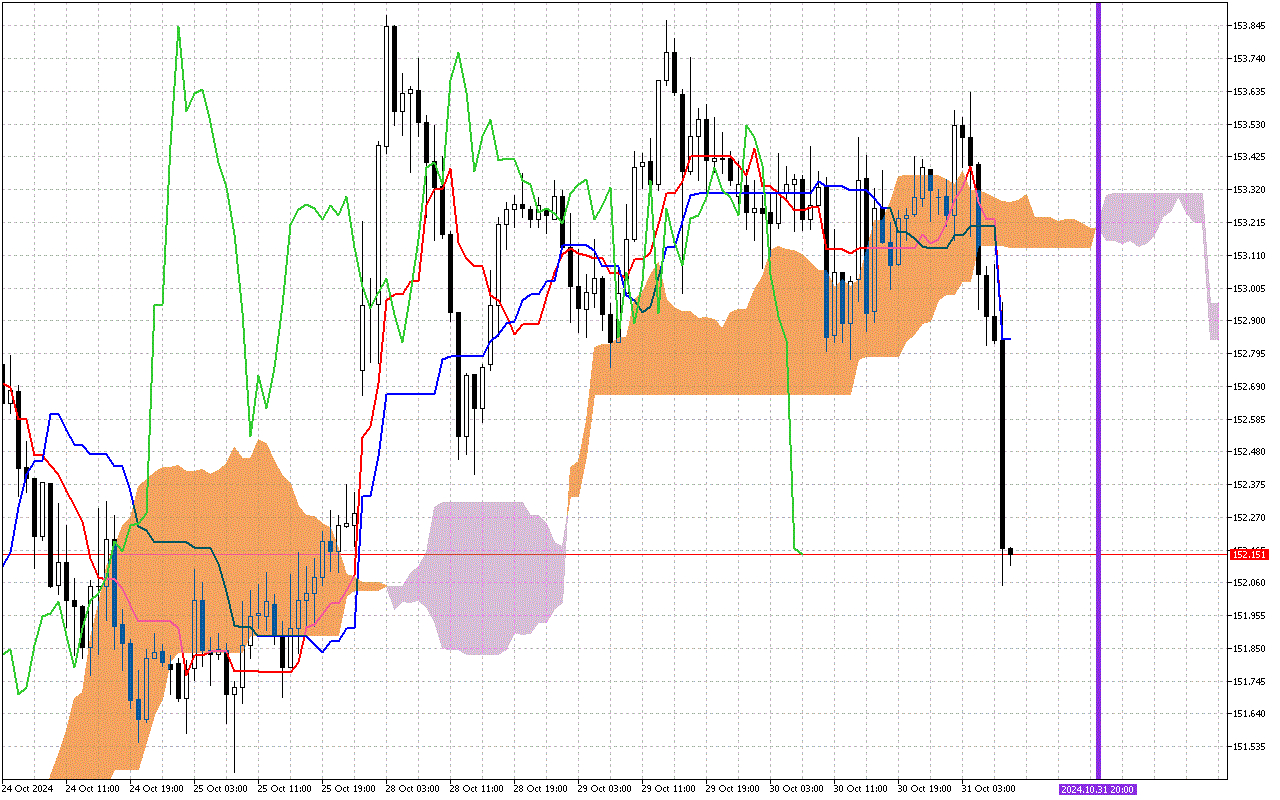
Traditionally, the review begins with analysis of the signals from the Tenkan and Kijun lines. Price consolidation on the USDJPY chart made both lines intertwine and lay at the same level. This reflects the uncertainty that will be resolved after the appearance of the line crossing signal.
The second important signal is a change in the color of the Kumo cloud, which is marked with a vertical purple line on the graph . The appearance of a lilac color in the cloud indicates a change in the priority direction of movement to downward.
The current situation:
Let's carefully look at the current values of the main components of the Ichimoku indicator to assess the current state of the market:
Now the Kumo cloud is tinted lilac, which indicates a possible change in price dynamics in a negative direction.
In the current market profile, the price has fixed below the Kumo cloud. The boundaries of the cloud form a dynamic resistance zone for the price.
Used by investors to identify a change in trend, the green Chinkou line is held below the price on the chart.
Trading recommendations:
The second important signal is a change in the color of the Kumo cloud, which is marked with a vertical purple line on the graph . The appearance of a lilac color in the cloud indicates a change in the priority direction of movement to downward.
The current situation:
Let's carefully look at the current values of the main components of the Ichimoku indicator to assess the current state of the market:
Now the Kumo cloud is tinted lilac, which indicates a possible change in price dynamics in a negative direction.
In the current market profile, the price has fixed below the Kumo cloud. The boundaries of the cloud form a dynamic resistance zone for the price.
Used by investors to identify a change in trend, the green Chinkou line is held below the price on the chart.
Trading recommendations: