
USDCAD H1: The Chaos Theory Forecast for the Asian Session on 6.11.2024
기술적
The price has fallen below the lower fractal on the USDCAD chart. This means the phase space is defined as southern. Against this background, the downward movement development is considered...
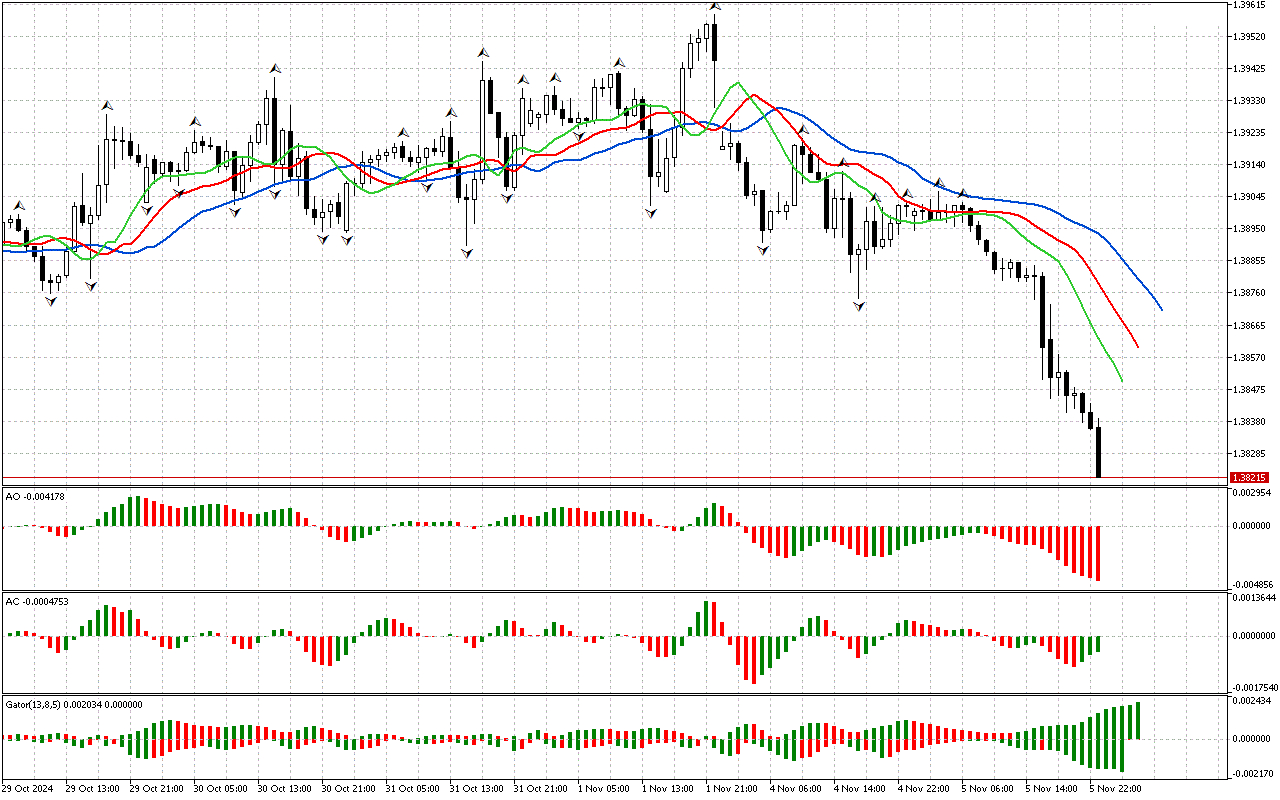
The price has fallen below the lower fractal on the USDCAD chart. This means the phase space is defined as southern. Against this background, the downward movement development is considered as prevalent. To assess the prospects for the development of this movement, let's examine other market dimensions.
The alligator is active and ready to hunt: its lines laid in a typical for the development of a downward movement order.
At the same time, the AO indicator remains in the negative zone.
The green bars located above the zero mark on the Accelerator Oscillator indicator show a decrease in the energy of the downward impulse. However, as long as the price remains below the Alligator’s red line, the price decrease is expected.
The color of the histograms of the Gator indicator changes, so this indicator has not formed a clear signal yet.
As an epilogue to the analysis, the southern direction of price movement is noted to be considered as a priority. At the same time, the indicators contain signals about the possible development of a correction, which should be used to search for entry points at more beneficial prices.
📊 Sell Stop 1.38214
❌ Stop Loss 1.39101
After entering the market, Stop Loss is moved along the red line after closing each candle. The profit is fixed by moving Stop Loss, or when opposite signals appear on the AO, AC, Gator indicators.
The alligator is active and ready to hunt: its lines laid in a typical for the development of a downward movement order.
At the same time, the AO indicator remains in the negative zone.
The green bars located above the zero mark on the Accelerator Oscillator indicator show a decrease in the energy of the downward impulse. However, as long as the price remains below the Alligator’s red line, the price decrease is expected.
The color of the histograms of the Gator indicator changes, so this indicator has not formed a clear signal yet.
As an epilogue to the analysis, the southern direction of price movement is noted to be considered as a priority. At the same time, the indicators contain signals about the possible development of a correction, which should be used to search for entry points at more beneficial prices.
📊 Sell Stop 1.38214
❌ Stop Loss 1.39101
After entering the market, Stop Loss is moved along the red line after closing each candle. The profit is fixed by moving Stop Loss, or when opposite signals appear on the AO, AC, Gator indicators.

작성자
Nikolai Krishtopov
마켓 애널리스트 겸 마케팅 매니저, Investizo
니콜라이 크리시토포프는 Investizo의 마켓 애널리스트로, 금융시장 업계에서 15년 이상의 경력과 10년이 넘는 트레이딩 경험을 보유하고 있습니다. 그의 주요 관심 분야는 외환 및 암호화폐 시장, 기술적 분석, 데이 트레이딩, 시장 행태입니다.