
Bitcoin H1: The Ichimoku Forecast for the Asian Session on 7.12.2024
07.12.2024 00:01
기술적
The most significant signal of the previous trading sessions was the intersection of the Tenkan and Kijun lines, which is considered as a signal of a change in trend in the market.
The second important signal is a change in the direction of movement of the Kumo cloud. This change is marked with a vertical purple line on the chart. The appearance of orange color in the cloud indicates a change in the main direction of movement to upward.
The current situation:
Let's carefully look at the current values of the main components of the Ichimoku indicator to assess the current state of the market:
The market price remains above the Tenkan and the Kijun lines, indicating a prevailing positive market sentiment.
The dynamics of price movement over a longer distance is determined by the Kumo cloud, which is now colored orange. Thus, this signal prioritizes the upward vector of price movement in the future.
The price is between the SenkouA and SenkouB lines, which act as support and resistance levels. To clarify the market situation, it is worth waiting until the price goes beyond the Kumo cloud.
The Chinkou line, which displays the closing price with a lag of 26 periods, is above the current price.
Trading recommendations:
Dynamic support levels are located on the Tenkan line, around the 99769.70, the Kijun line, around the 96946.35, and the SenkouB line, around the 99628.85.
The dynamic resistance level is on the SenkouA line, around the 100619.25 mark.
Based on the results of the analysis, most technical indicators of the Ichimoku system indicate an upcoming price increase. Therefore, intraday it is worth prioritize the long positions that can be considered from the defined support levels.
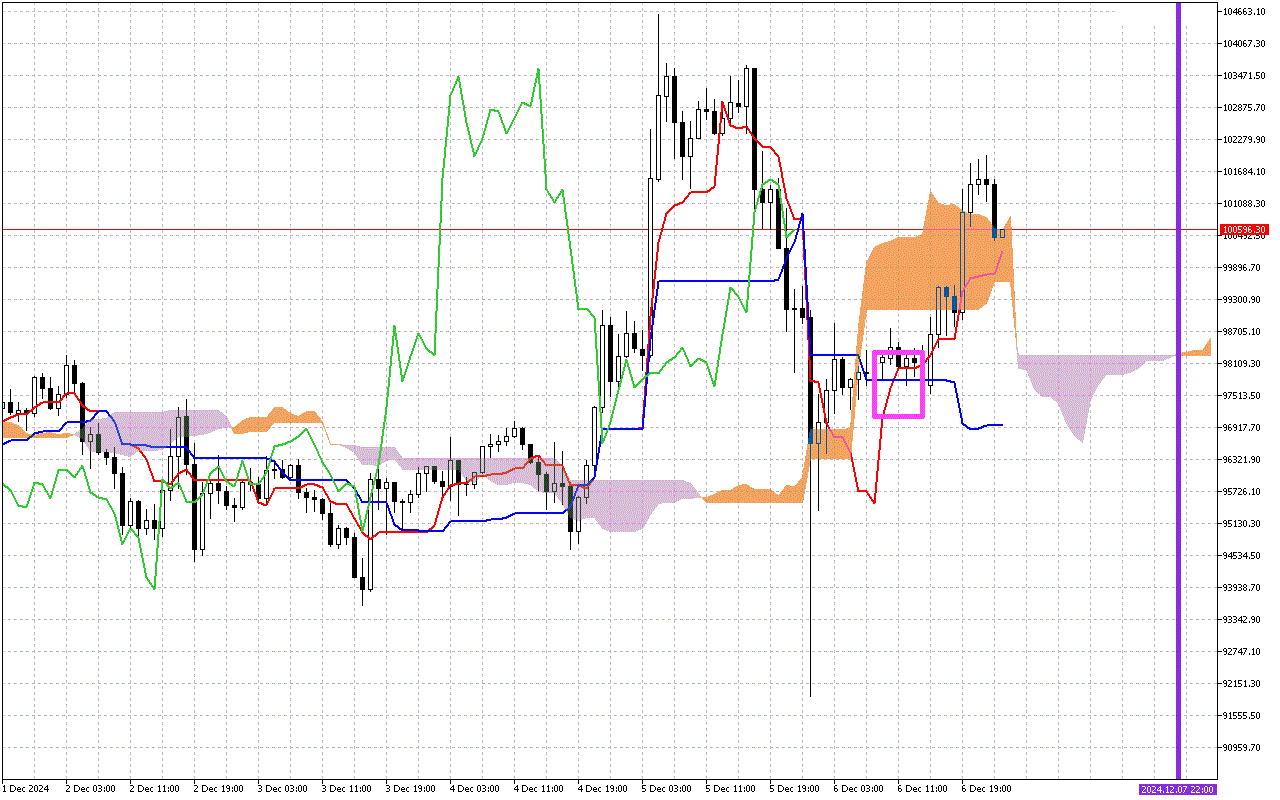
The second important signal is a change in the direction of movement of the Kumo cloud. This change is marked with a vertical purple line on the chart. The appearance of orange color in the cloud indicates a change in the main direction of movement to upward.
The current situation:
Let's carefully look at the current values of the main components of the Ichimoku indicator to assess the current state of the market:
The market price remains above the Tenkan and the Kijun lines, indicating a prevailing positive market sentiment.
The dynamics of price movement over a longer distance is determined by the Kumo cloud, which is now colored orange. Thus, this signal prioritizes the upward vector of price movement in the future.
The price is between the SenkouA and SenkouB lines, which act as support and resistance levels. To clarify the market situation, it is worth waiting until the price goes beyond the Kumo cloud.
The Chinkou line, which displays the closing price with a lag of 26 periods, is above the current price.
Trading recommendations:
Dynamic support levels are located on the Tenkan line, around the 99769.70, the Kijun line, around the 96946.35, and the SenkouB line, around the 99628.85.
The dynamic resistance level is on the SenkouA line, around the 100619.25 mark.
Based on the results of the analysis, most technical indicators of the Ichimoku system indicate an upcoming price increase. Therefore, intraday it is worth prioritize the long positions that can be considered from the defined support levels.