
EURUSD H1: The Ichimoku Forecast for the Asian Session on 11.3.2025
11.03.2025 00:31
기술적
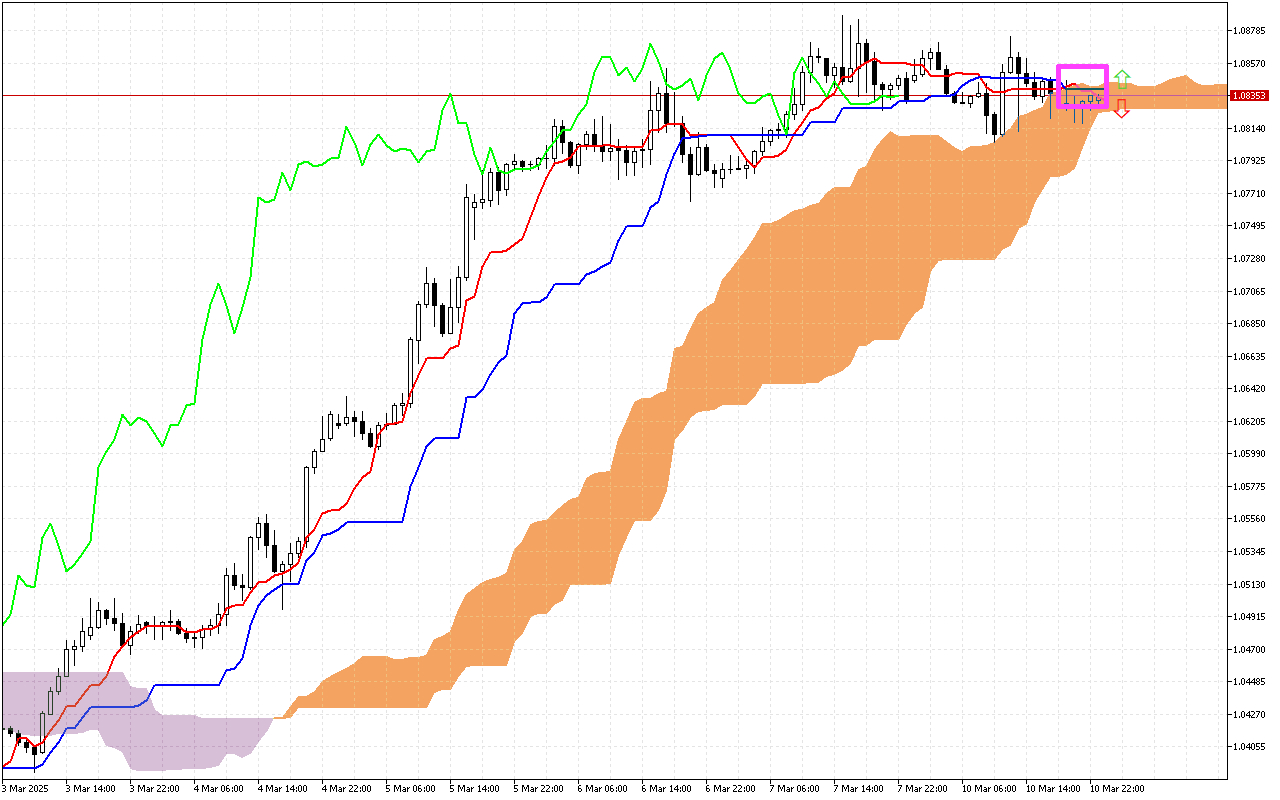
The key moment of previous trading sessions was the intersection of the Tenkan and Kijun lines. This signal is marked on the chart with a pink square and indicates a change in the trend to a downward one. However, subsequently the price was noted to have risen above the Tenkan line, indicating weakness in the downward momentum.
The current situation
Let's look at the main components of the indicator and their current values:
The price is now positioned between the Tenkan and the Kijun lines, indicating a temporary consolidation before a potential resumption of the trend.
The Kumo cloud is colored orange, indicating the market tendency to a continuing upward movement.
The price is inside the Kumo cloud, which indicates a market uncertainty phase. The SenkouA and SenkouB lines act as support and resistance.
The Chikou line is now below the current price.
Trading recommendations:
Dynamic support levels are on the Tenkan and SenkouB lines, around the 1.08246.
Dynamic resistance levels are located on the Kijun line, near the 1.08396 mark and the SenkouA line, at the 1.08418 level.
The current situation
Let's look at the main components of the indicator and their current values:
The price is now positioned between the Tenkan and the Kijun lines, indicating a temporary consolidation before a potential resumption of the trend.
The Kumo cloud is colored orange, indicating the market tendency to a continuing upward movement.
The price is inside the Kumo cloud, which indicates a market uncertainty phase. The SenkouA and SenkouB lines act as support and resistance.
The Chikou line is now below the current price.
Trading recommendations:
Dynamic support levels are on the Tenkan and SenkouB lines, around the 1.08246.
Dynamic resistance levels are located on the Kijun line, near the 1.08396 mark and the SenkouA line, at the 1.08418 level.