
Technical analysis USDCAD for 28.07.2023
The Tenkan-sen line is located above the Kijun-sen line. Both lines are horizontal. Confirmatory line Chikou Span crossed and fixed above the price chart
The Tenkan-sen line is located above the Kijun-sen line. Both lines are horizontal. Confirmatory line Chikou Span crossed and fixed above the price chart. In this case, the cloud is ascending. Instrument is trading above the Tenkan-se and Kijun-sen lines. The closest support is the level 1.32175. The closest resistance is the level 1.32475
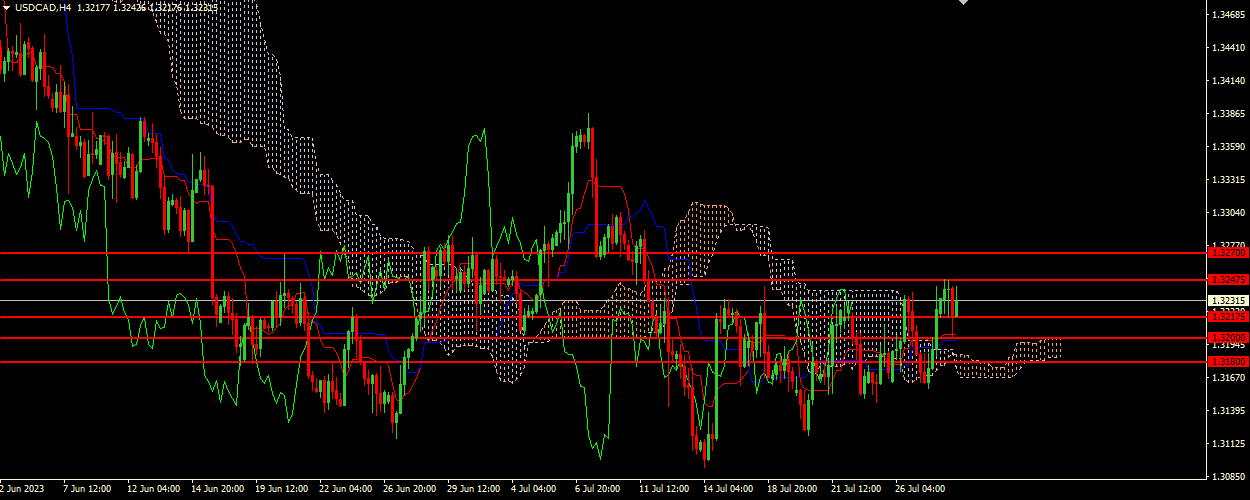
Key levels
- 1.32700, 1.32475, 1.32175, 1.32000, 1.31800
Trading scenario
- Recommended opening long positions (Buy Limit) from the level of 1.32175, with Take Profit of 1.32475 and Stop Loss of 1.32000
Alternative scenario
- Recommended opening short positions (Sell Stop) from the level of 1.32000, with Take Profit of 1.31800 and Stop Loss of 1.32175

Николай Криштопов — рыночный аналитик Investizo с более чем 15-летним опытом работы в индустрии финансовых рынков и более чем десятилетним опытом трейдинга. В сферу его интересов входят валютный и криптовалютный рынки, технический анализ, внутридневная торговля и поведение рынка.