
Technical analysis XAUUSD for 08.10.2021
XAU/USD, H4
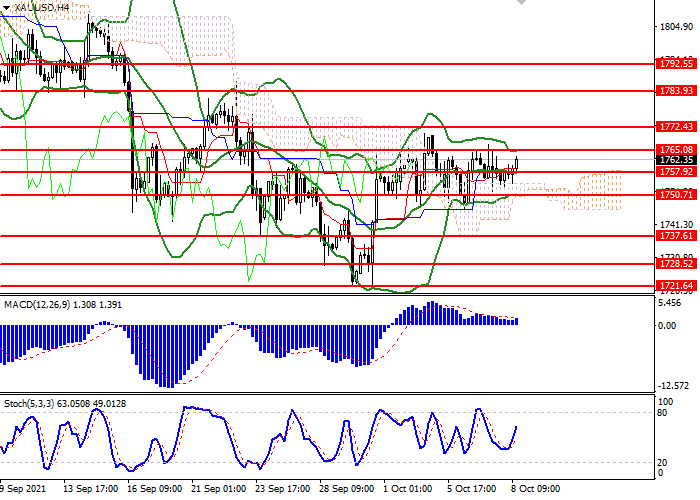
On the 4-hour chart, the instrument is trading in the upper range of the Bollinger Bands. The key resistance is the upper boundary of the indicator. The Bollinger Band is directed sideways and the price range has contracted, indicating the presence of corrective dynamics. Histogram of MACD is near the equilibrium zone, its volume has not significantly increased, having formed a weak buy signal. The Stochastic Oscillator is approaching the overbought area, there is no signal to enter the market.
XAU/USD, D1
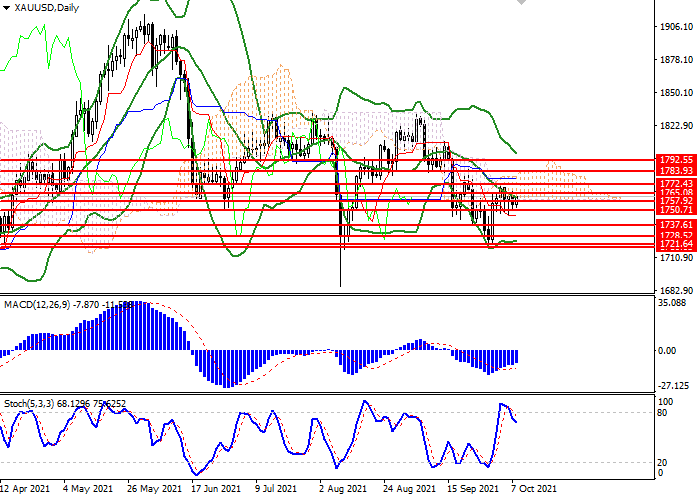
On the daily chart, the instrument is testing the Bollinger Band moving average, which is the nearest resistance level. The indicator is pointing downward and the price range has contracted, confirming a downtrend correction. The MACD histogram is holding a weak sell signal. Stochastic has left the overbought area, forming a strong sell signal.
Key levels
- Support levels: 1722.00, 1728.00, 1737.00, 1750.00, 1760.00.
- Resistance levels: 1765.00, 1772.00, 1784.00, 1.1793.
Trading scenarios
- Long positions should be opened above the level of 1765.00 with a target of 1780.00 and a Stop Loss at 1757.00. The implementation period is 1-2 days.
- Short positions can be opened below the level of 1757.00 with a target of 1737.60 and Stop Loss at the level of 1766.00. The implementation period of 1-2 days.