
General analysis USDCAD for 26.05.2022
26.05.2022 13:56
Недельный
Общий
Current Dynamics
USD/CAD is trading in an uptrend correction. Having strengthened in the first half of Wednesday afternoon, the pair lost all progress after the publication of the minutes of the Federal Open Market Committee meeting. The minutes showed that the majority of Committee members considered a half per cent monetary policy tightening in June and July to be a rational solution to combat high price pressures.Although the market reaction during the trading session was rather subdued, US equities rose and slightly increased their gains after the release of the minutes. The Dow Jones rose 0.6% to 32120 , the Nasdaq rose 1.5% to 11,434 and the broader S&P 500 rose 0.9% .
Also noteworthy was yesterday's US Durable Goods Orders statistics. In general, the dynamics in April was positive, but the actual increase was half of what was predicted. Rising prices are affecting purchasing power of American consumer while the order book continues to grow and is a confirmation that inflation has not reached its peak.
Meanwhile, the Congressional Budget Office said on Wednesday that the U.S. federal budget deficit will shrink to $1.036 trillion by the end of this year. In the 2021 fiscal year, the deficit was $2.775 trillion. The reduction will increase tax revenues, amid an improving epidemiological situation in the USA. Also, the Budget Office predicts real GDP growth of 3.1% in the USA in calendar year 2022, which is 2.4% lower than in 2021. According to the same source US GDP growth will slow down to 2.2% in 2023 and to 1.5% in 2024. Furthermore, the Office of Management and Budget predicts consumer price inflation in the USA to reach 6.1% in 2022, slowing down further to 3.1% in 2023 and 2.4% in 2024.
The key macroeconomic release today will be US GDP and labour market data. On Friday, the core Personal Consumption Expenditure Index - a key inflation indicator for the Fed - will take centre stage. The April core PCE index is forecast to slow to 4.9% from 5.2% in March. Given that this report is highly influential, we could see significant volatility in the market ahead of the weekend, amplified by lower liquidity ahead of the Memorial Day holiday, especially if the results surprise. Also worth considering is heightened tensions between the US and China after President Biden said he was prepared to defend Taiwan militarily in case of a Chinese invasion increases the impact on investor sentiment.
Support and resistance levels
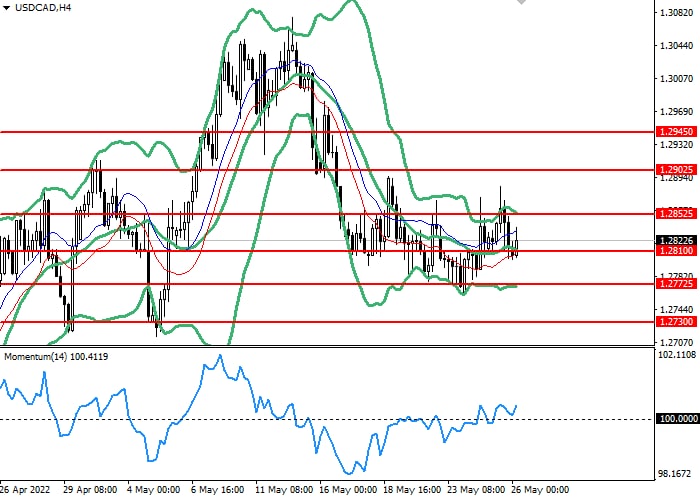
- Support levels: 1.2810, 1.2770, 1.2730.
- Resistance levels: 1.2850, 1.2900, 1.2945.
Trading scenarios
- A buy limit position can be opened from 1.2810 with a target of 1.2855 and a stop loss of 1.2785.
- Implementation period: 1-2 days
- A Sell stop position can be opened from the level 1.2770 with a target of 1.2700 and a stop-loss of 1.28100.
- Implementation period: 1-2 days.