Technical analysis WTI for 21.10.2024
21.10.2024 09:23
Недельный
Технический
The Tenkan-sen line is located below the Kijun-sen line. Blue is directed downward, while red remains horizontal. Confirmatory line Chikou Span is below the price chart. In this case, the cloud is descending. Instrument is trading below the Tenkan-se and Kijun-sen lines. The closest support and resistance levels are Tenkan-se and Kijun-sen, respectively. The closest support and resistance levels are Kijun-sen and Tenkan-se, respectively
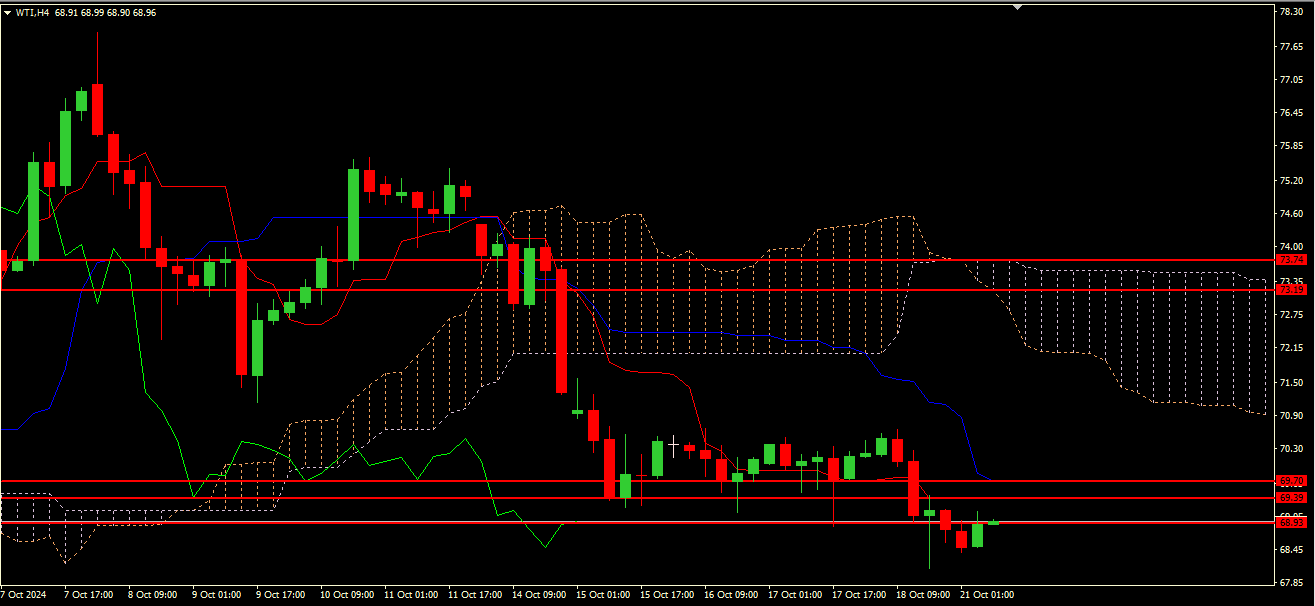
Key levels
68.93, 69.39, 69.70, 73.19, 73.74
Trading scenario
Recommended opening long positions (Buy) at the current price, with Take Profit of 69.70 and Stop Loss of 68.93
Alternative scenario
Recommended opening short positions (Sell Limit) from the level of 69.39, with Take Profit of 68.93 and Stop Loss of 69.70
Сценарии
Рекомендации
BUY
Точка входа
69.39
Взять прибыль
69.70
Stop Loss
68.93
Ключевые уровни
68.93, 69.39, 69.70, 73.19, 73.74
Альтернативный сценарий
Рекомендации
SELL LIMIT
Точка входа
69.39
Взять прибыль
68.93
Stop Loss
69.70