
Fundamental analysis of XAU/USD
Gold prices rose on Thursday to their highest level in almost a month, helped by a weaker U.S. dollar and expectations of an end to Fed monetary tightening. The consumer price index rose slightly in June, the smallest annual increase in more than two years. While this does not completely contradict the Fed's decision to raise rates later this month, it does indicate a downward trend in inflation. Market participants are keeping a close eye on other clues from Fed officials, especially regarding the upcoming rate hike meeting, which could affect gold prices in the near term.
Recently, the gold market has been affected by the threat of further rate hikes to address inflation, which has caused gold to fall over 100 USD from its peak in May. High interest rates increase the opportunity cost of gold's low returns despite its reputation as a safe-haven asset in unpredictable times. Future Fed decisions are expected to determine the trajectory of gold prices. In anticipation of future U.S. economic indicators such as initial jobless claims and PPI reports, investors want a better understanding of the inflationary situation. Even despite the latest inflation data, Fed officials remain uncertain, with some saying that further policy tightening is needed to reduce inflationary concerns. The recent modest rise in consumer prices points to the possibility of a slowdown in inflation.
Futures on the S&P 500 Index posted strong gains the day before, emphasizing the theme of increased risk appetite. The US Dollar Index (DXY) hovered around 100.50 after a five-day decline in CPI, easing fears of an impending recession. U.S. producer price index (PPI) data released today is under scrutiny. Consumer prices rose just 0.2% in June from the previous month, the slowest increase since February 2021. This month may be the last.
Technical analysis and scenarios:
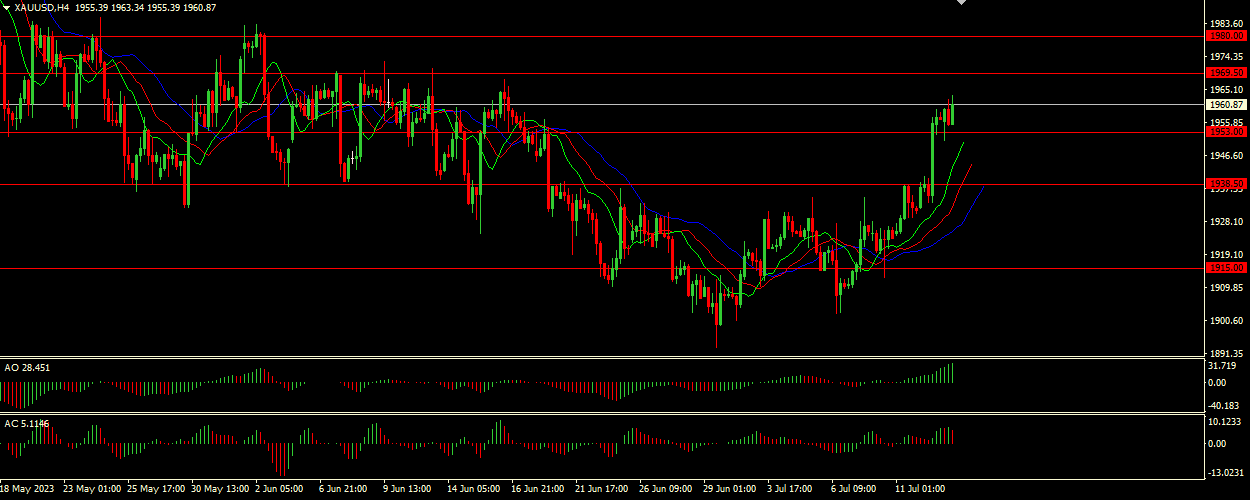
The pair is in an uptrend, which is confirmed by the Alligator indicator, which shows a wide open mouth and low jaw (blue line) under the lips and teeth (green and red lines). This suggests that the market is hungry for higher prices. However, the divergence indicators in the gray zone show uncertainty.
Main scenario (BUY)
Recommended entry level: 1969.50.
Take Profit: 1980.00.
Stop loss: 1963.00.
Alternative scenario (SELL)
Recommended entry level: 1953.00.
Take Profit: 1838.00.
Stop loss: 1960.00.