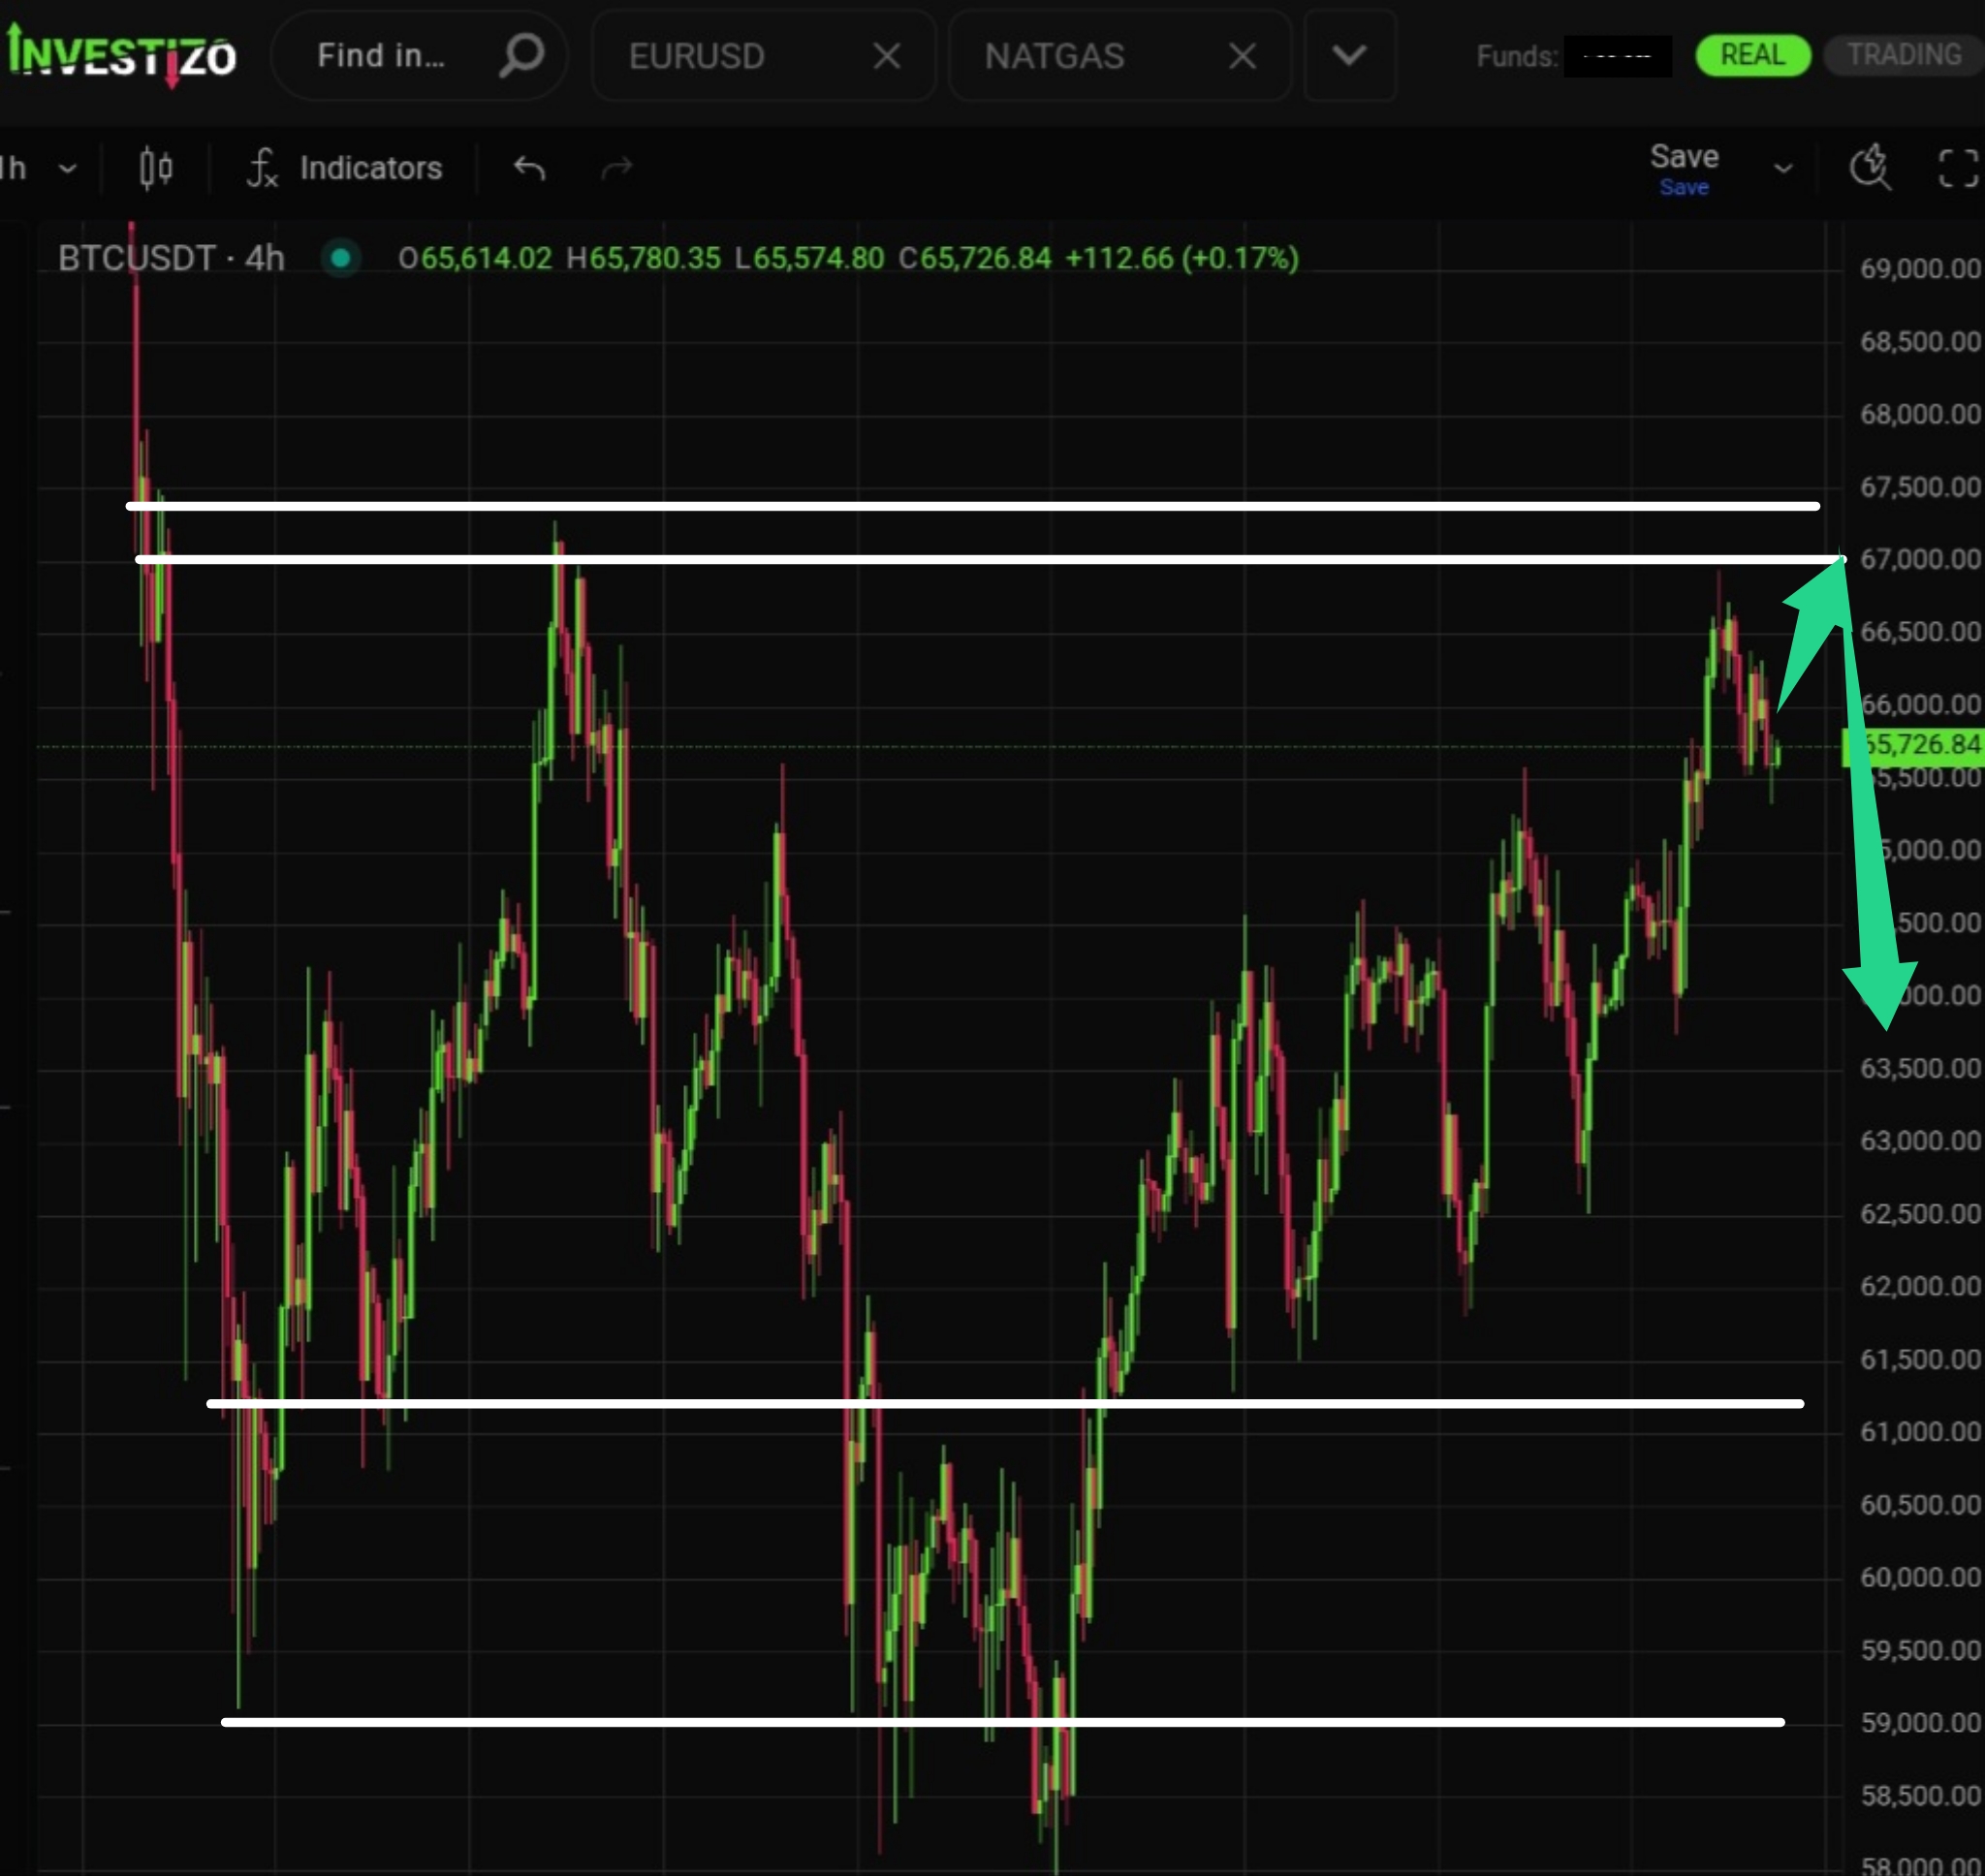
Bitcoin, Technical Analysis – H4
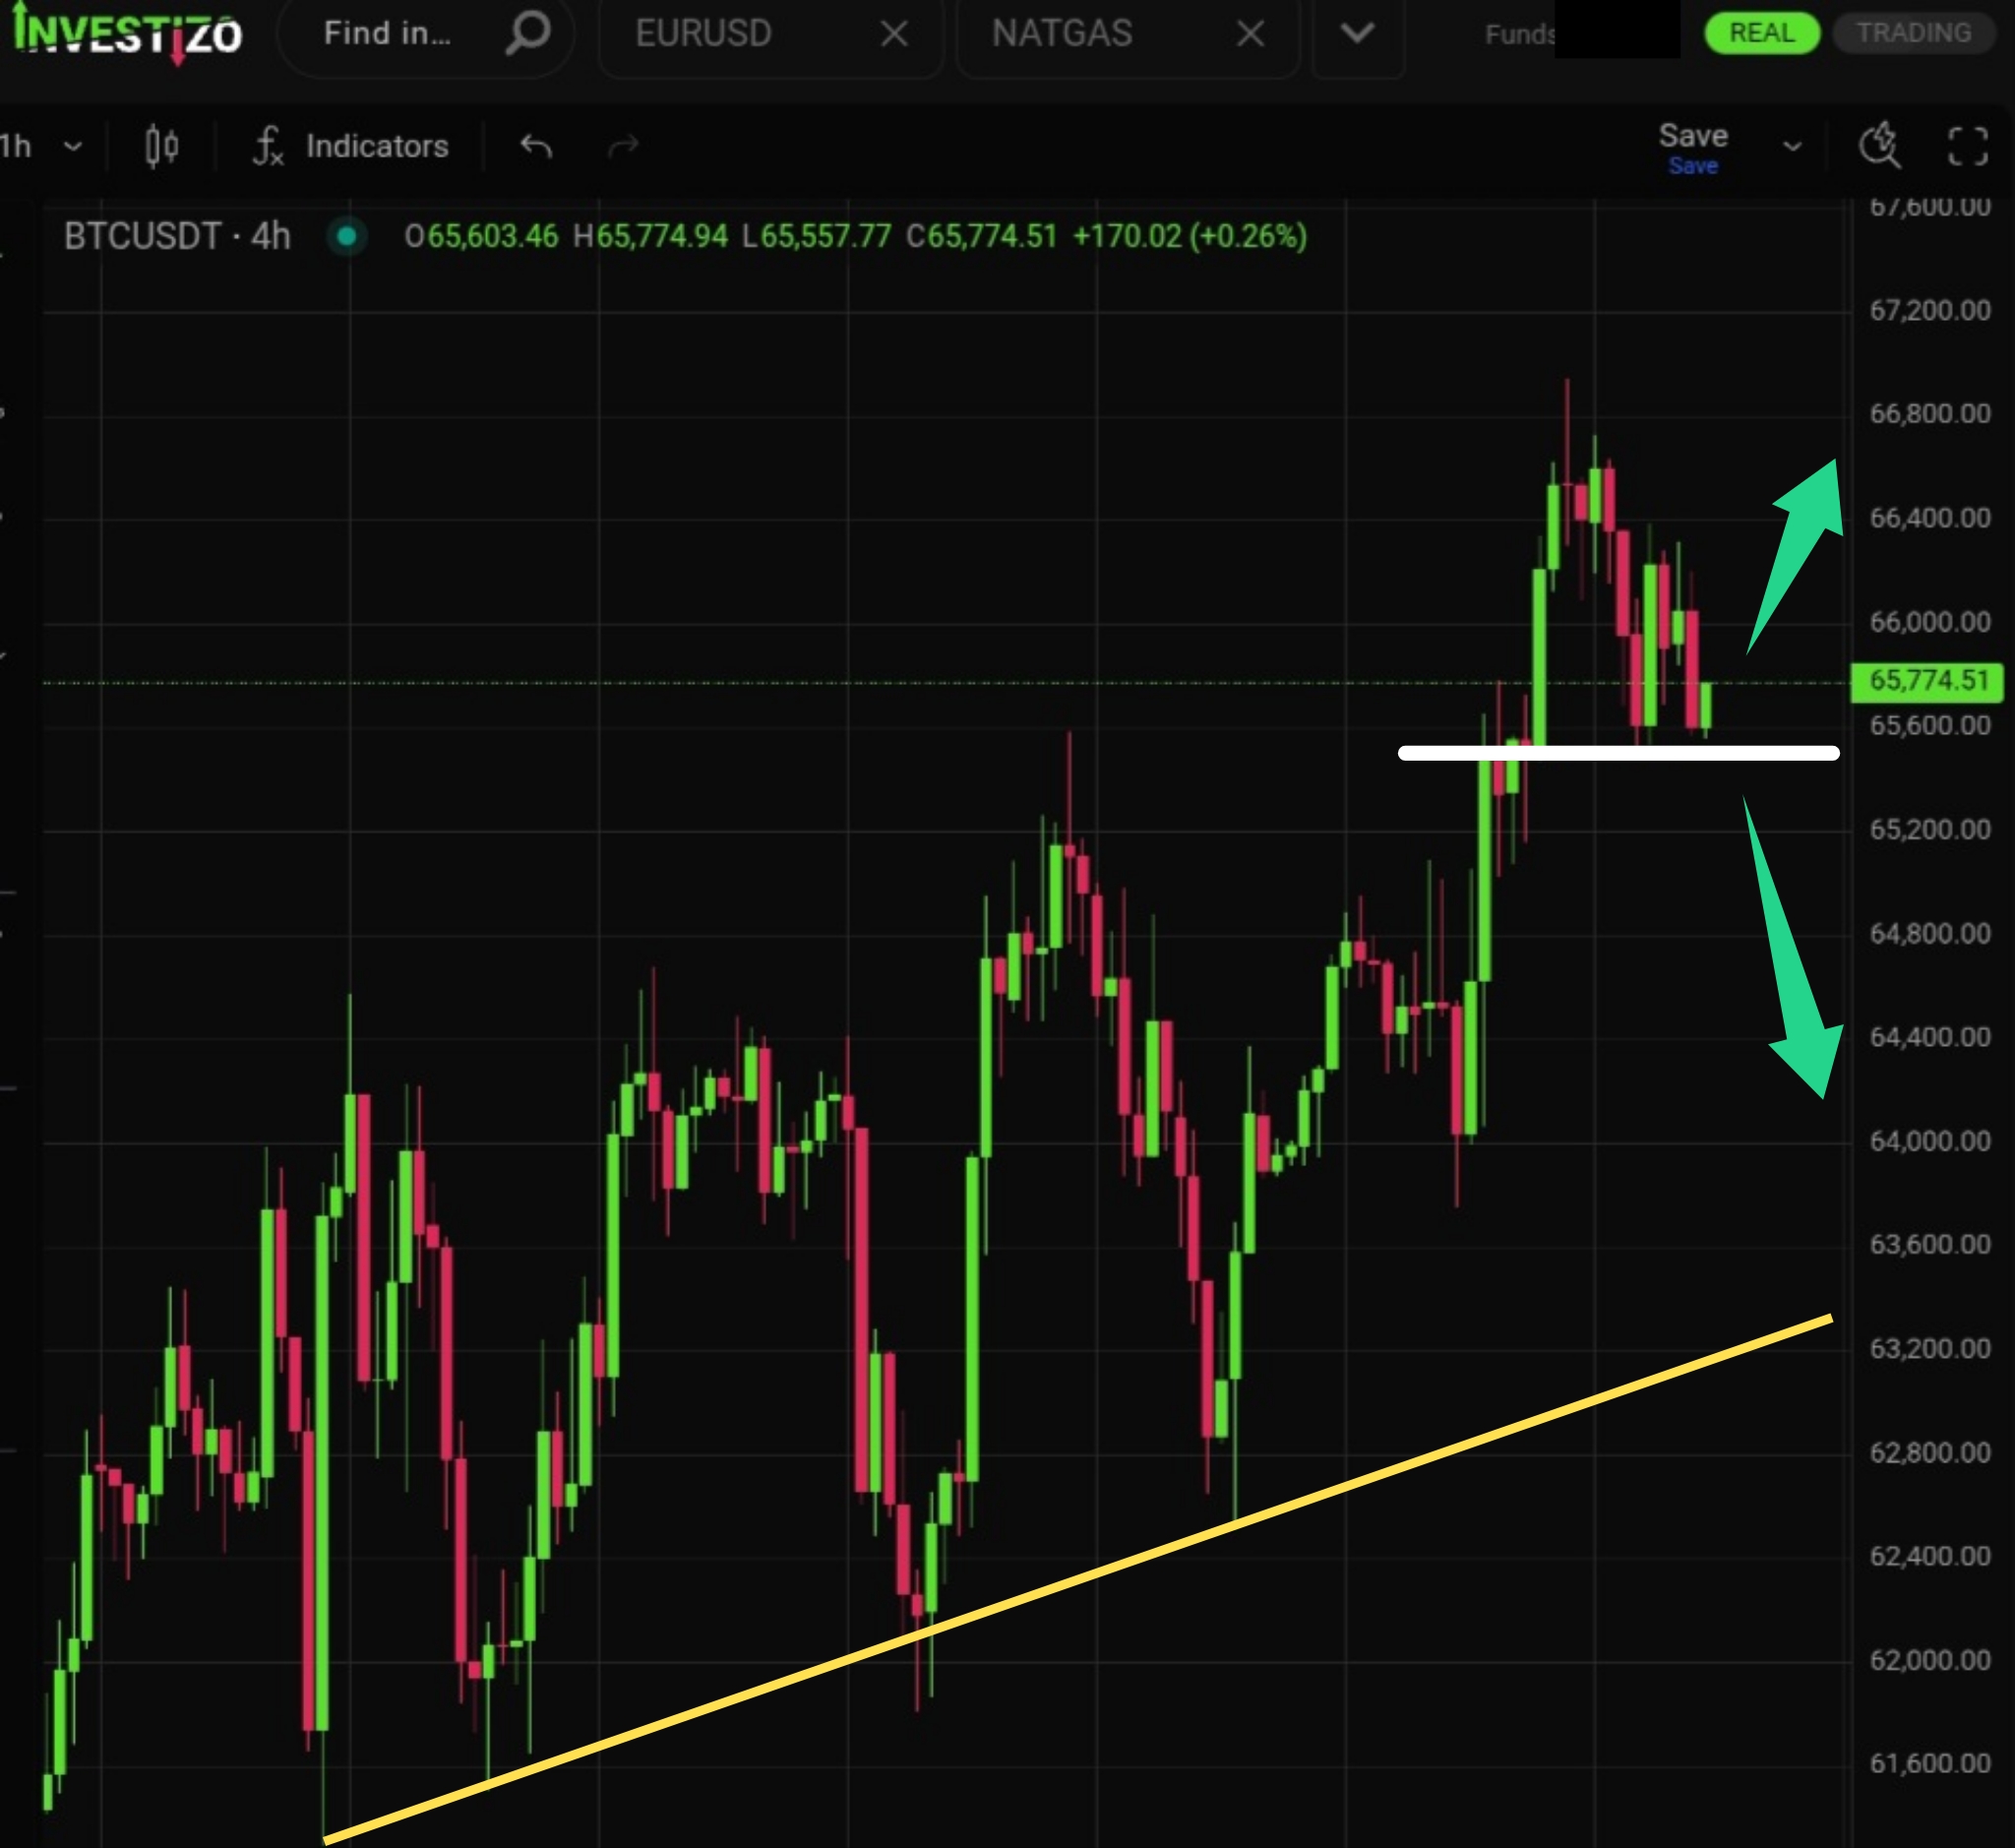
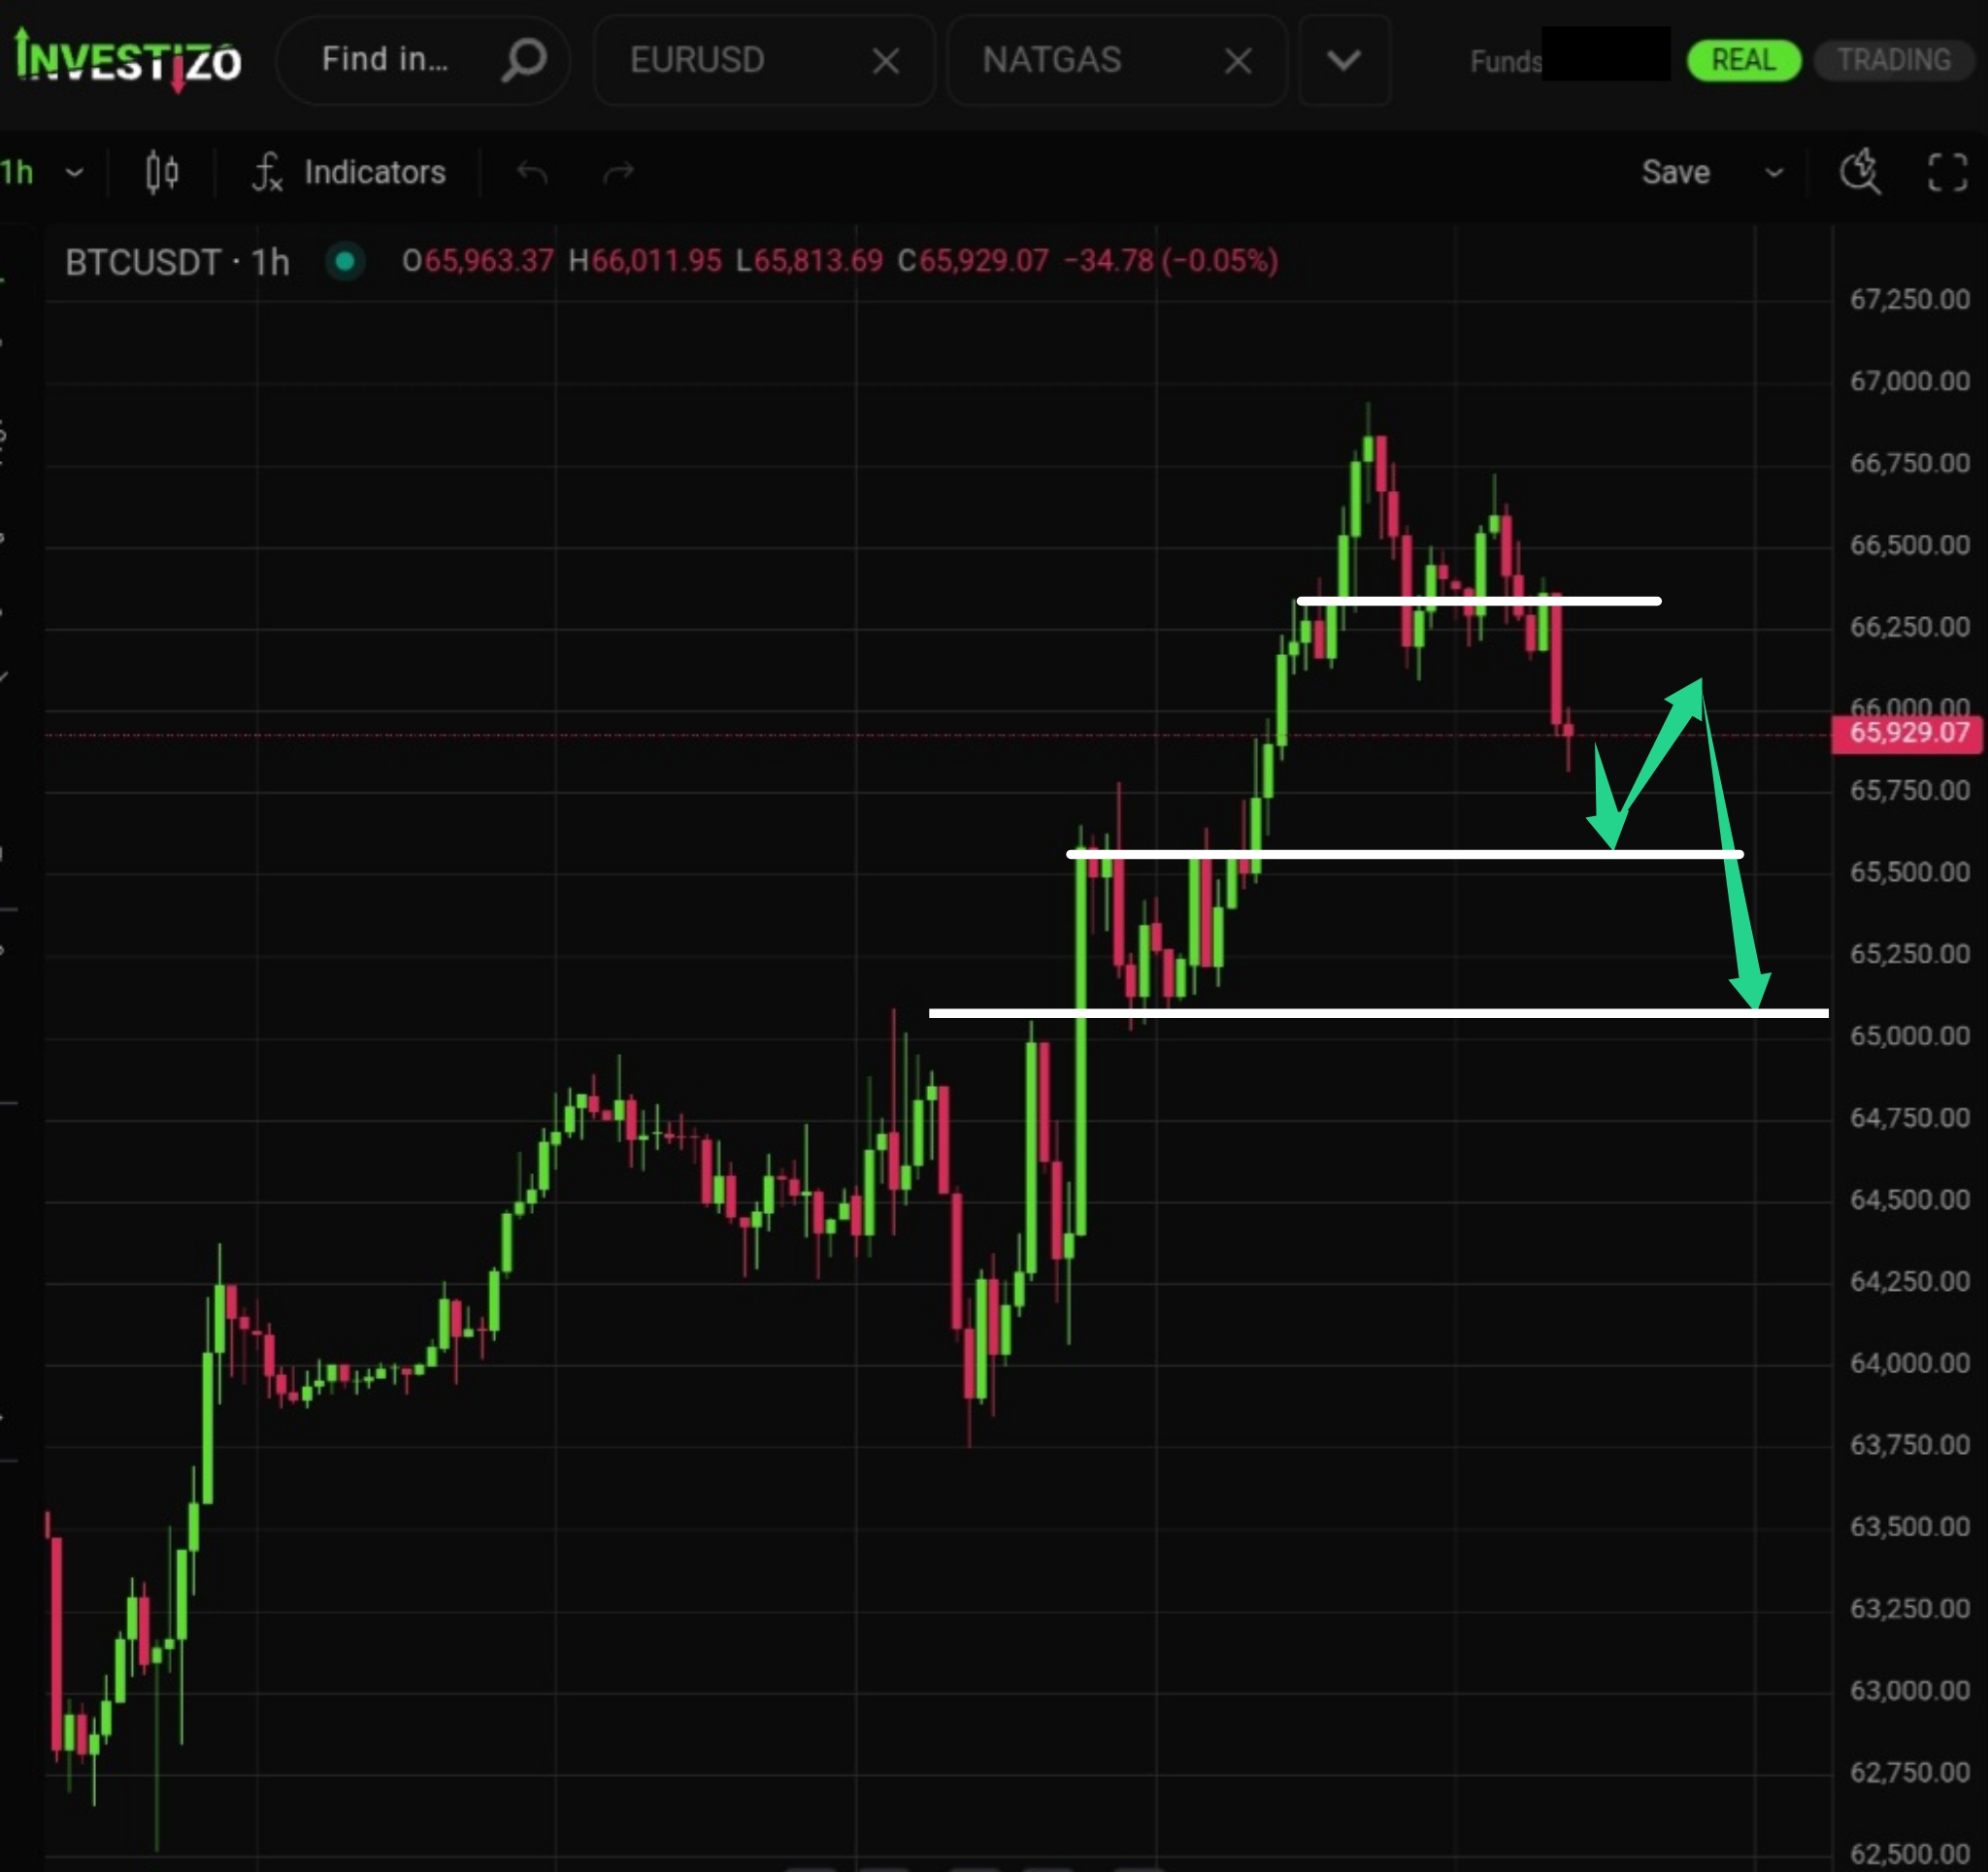
Bitcoin is consolidating just below a massive solid concrete resistance in the $67,000–67,500 zone.
Investizo LTD. Business company number 25432 BC 2019
Suite 305, Griffith Corporate Centre,
P.O. Box 1510, Beachmont, Kingstown,
St. Vincent and the Grenadines
DUNS 817053497
Phone:+996312610515
E-mail: [email protected]
© 2019-2026 Investizo 18+ جميع الحقوق محفوظة
تحذير من المخاطر: العقود مقابل الفروقات هي منتجات مالية معقدة يتم تداولها على الهامش. يعتبر تداول العقود مقابل الفروقات محفوفًا بالمخاطر وقد لا يكون مناسبًا لجميع المستثمرين. تأكد من فهمك للمخاطر التي ينطوي عليها الأمر حيث قد تفقد كل رأس المال المستثمر
Bitcoin is consolidating just below a massive solid concrete resistance in the $67,000–67,500 zone.
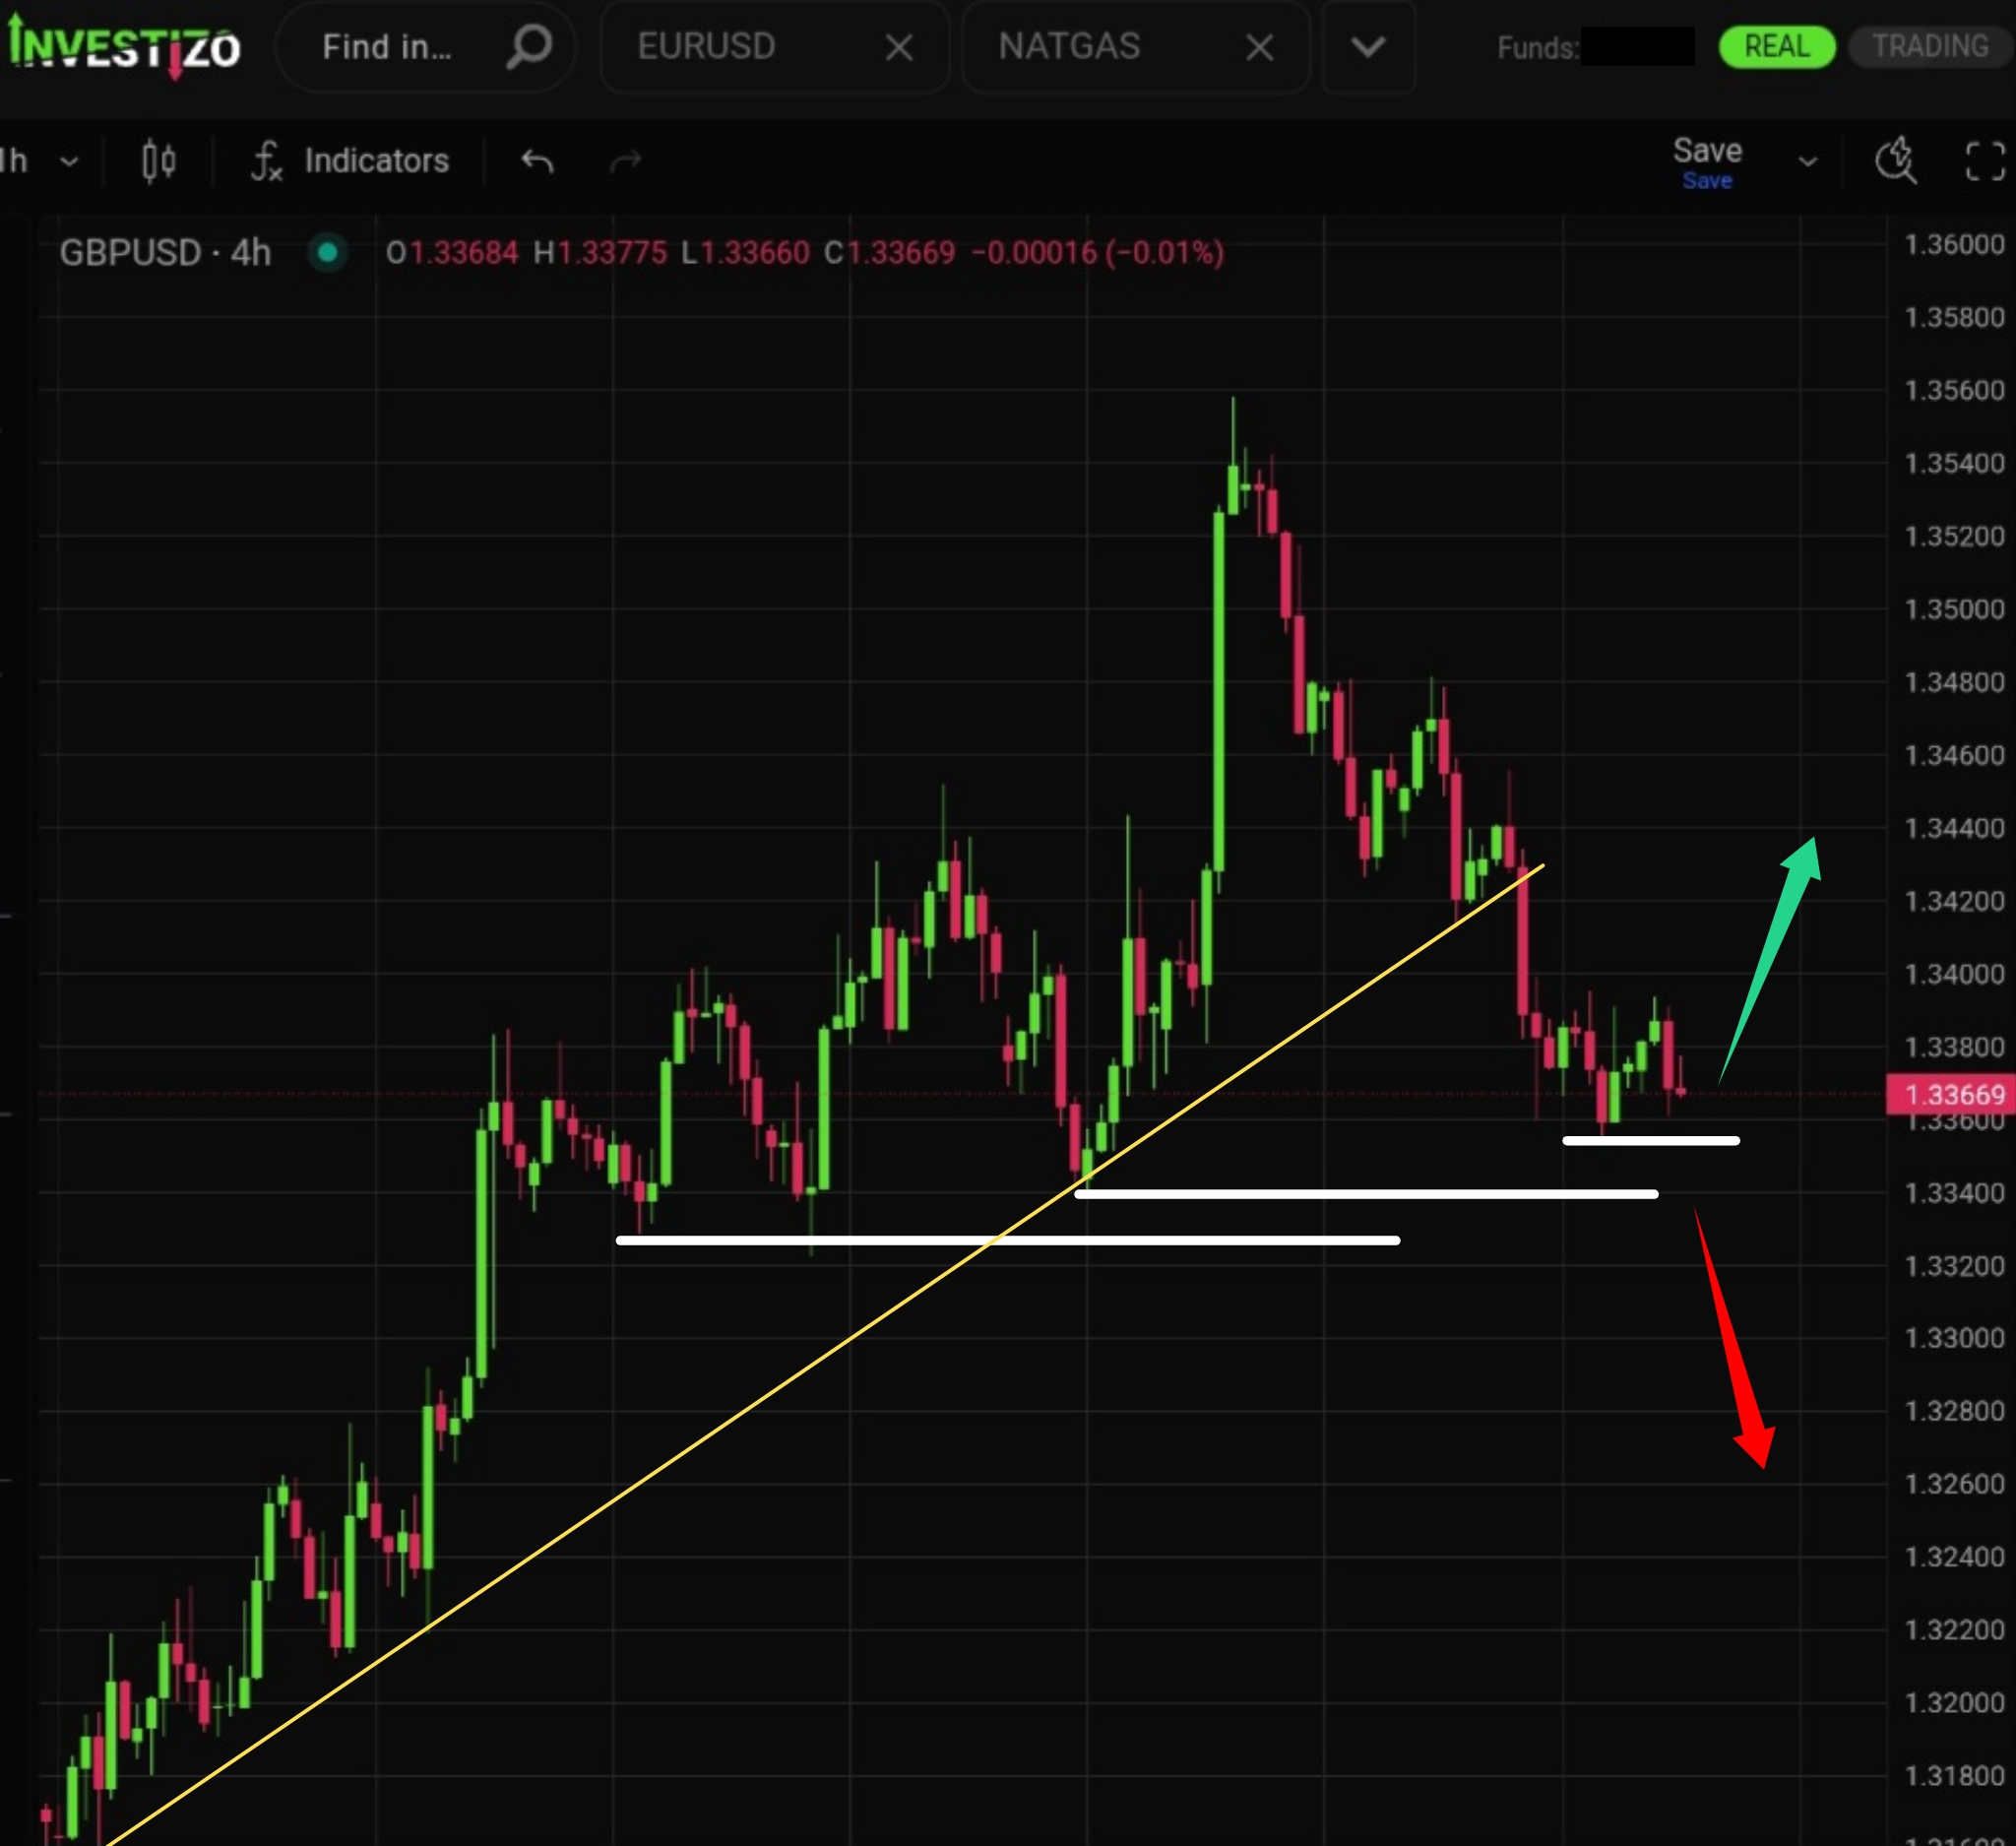
The overall structure remains bullish, as evidenced by consistently higher lows. However, the price action has also shown notable deterioration.
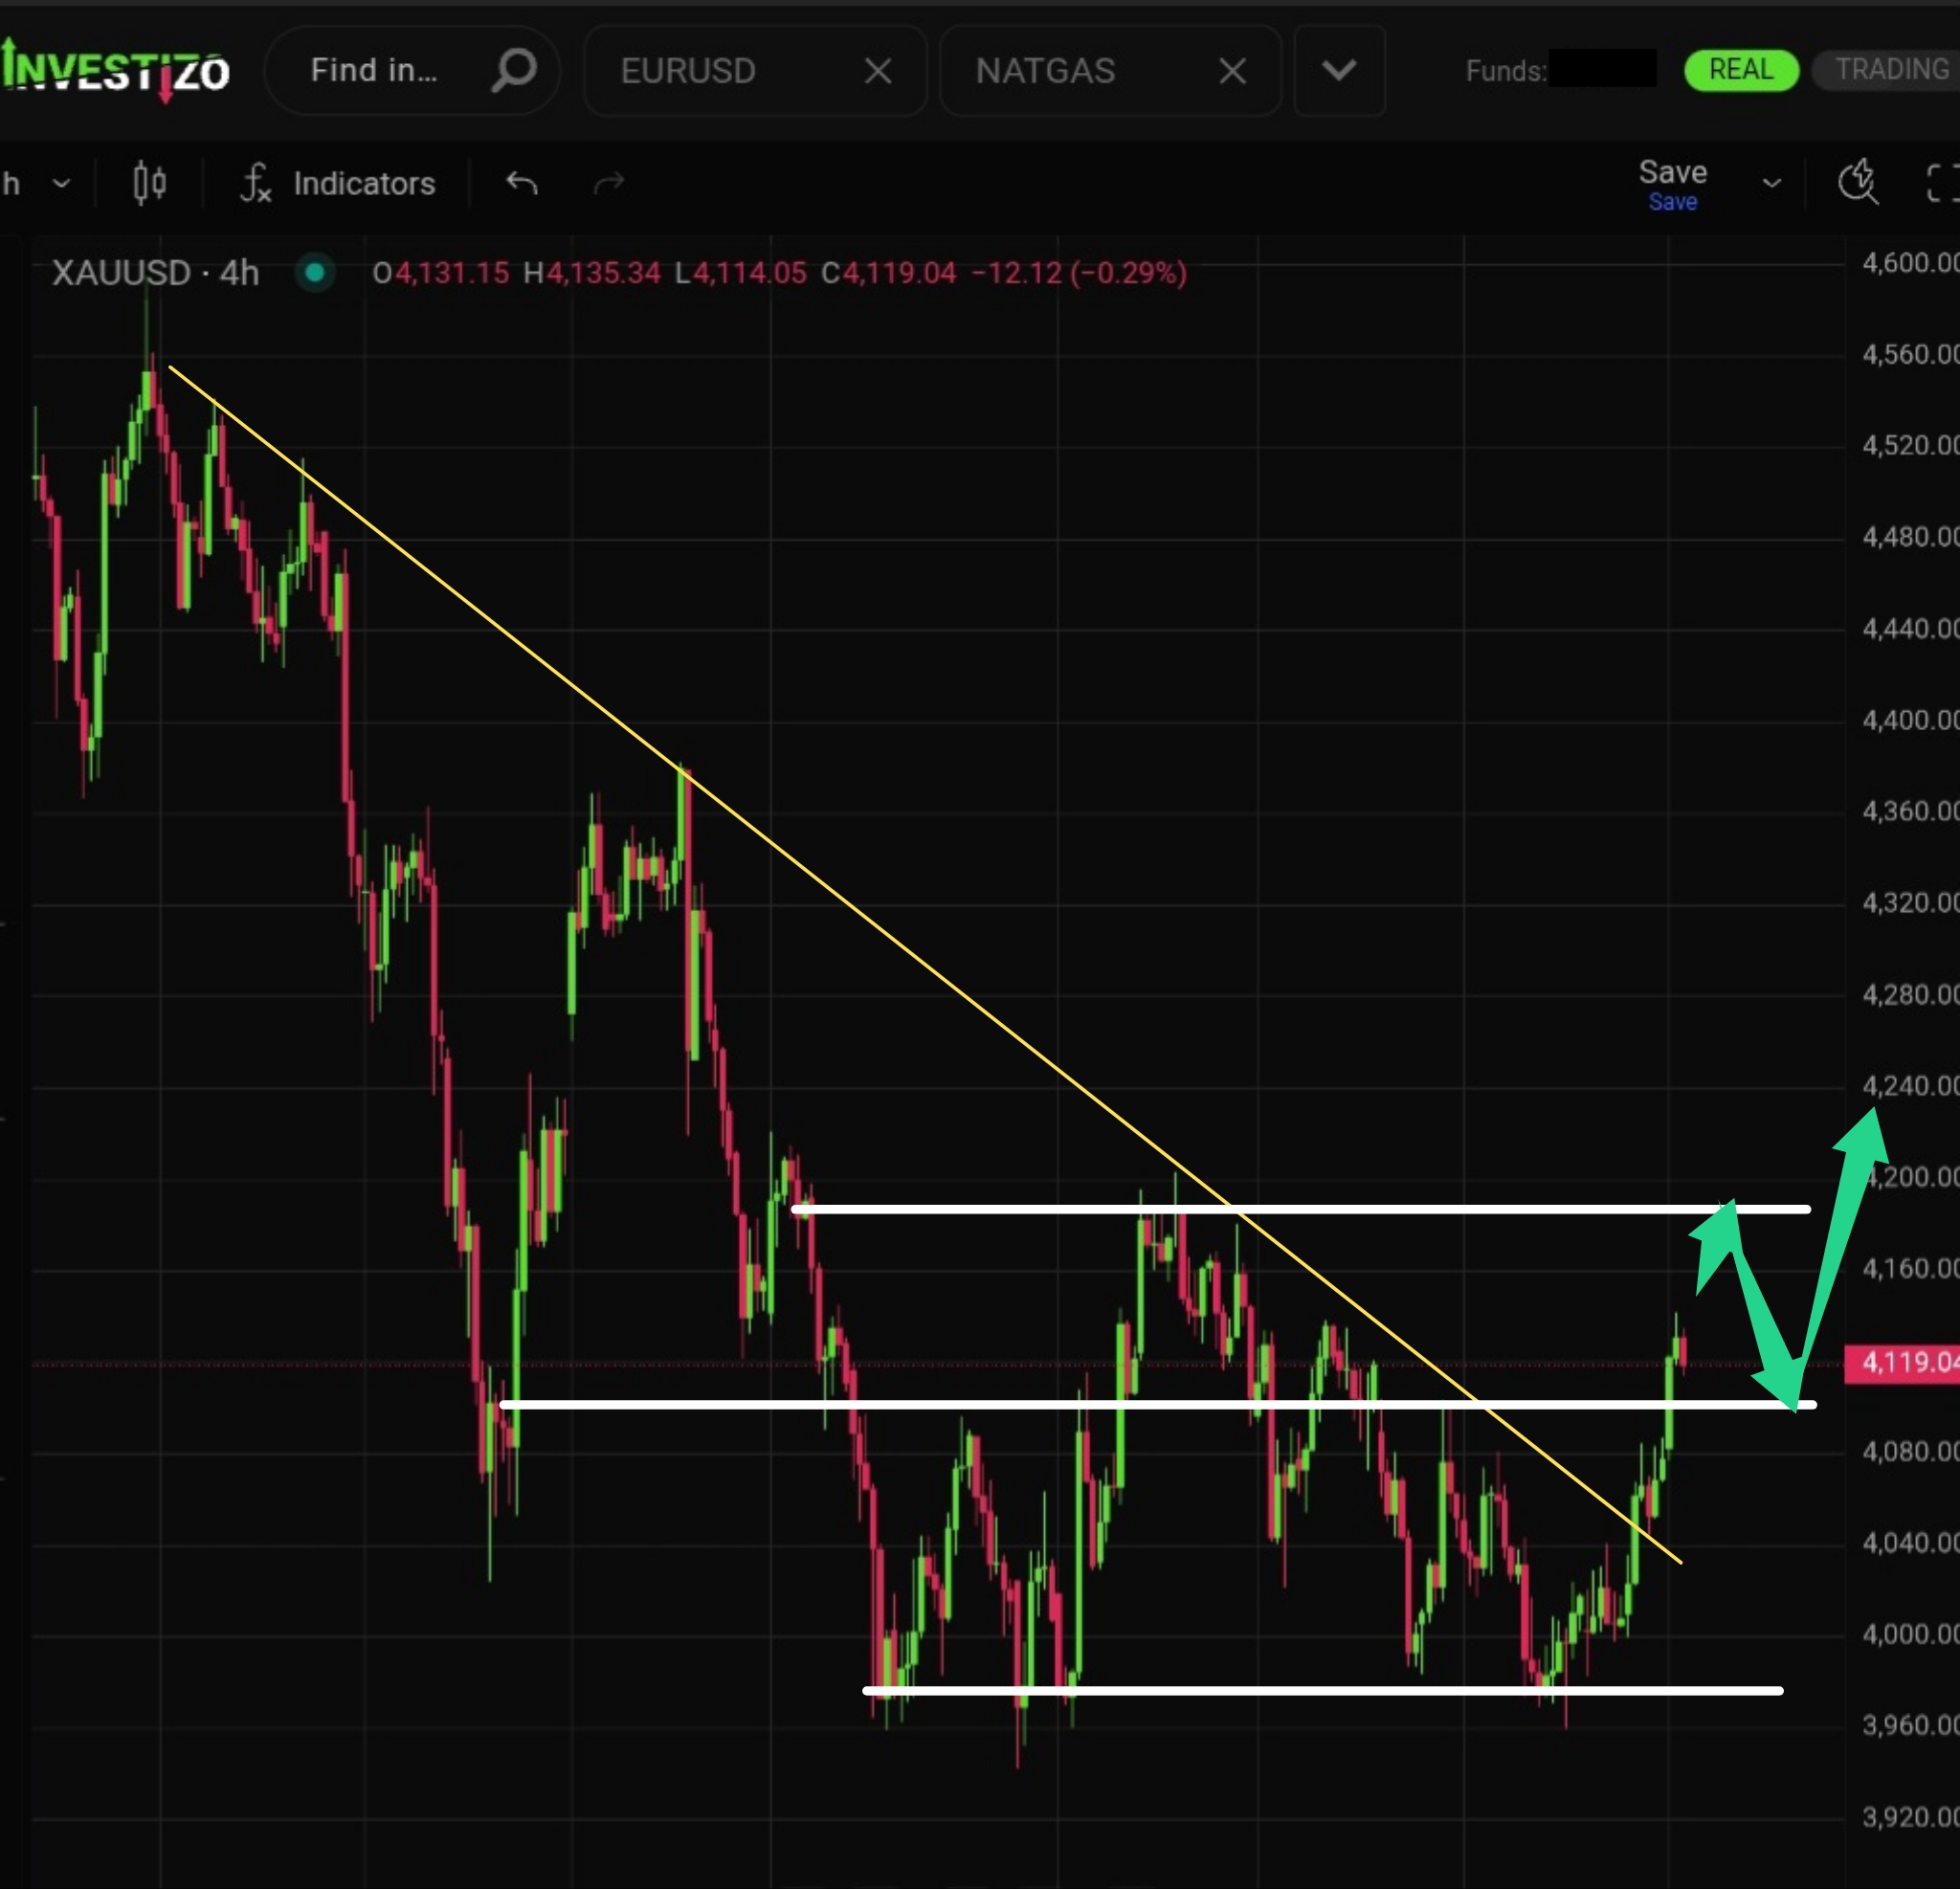
The price is approaching the upper boundary of the “megaphone” (horn) pattern we highlighted yesterday.
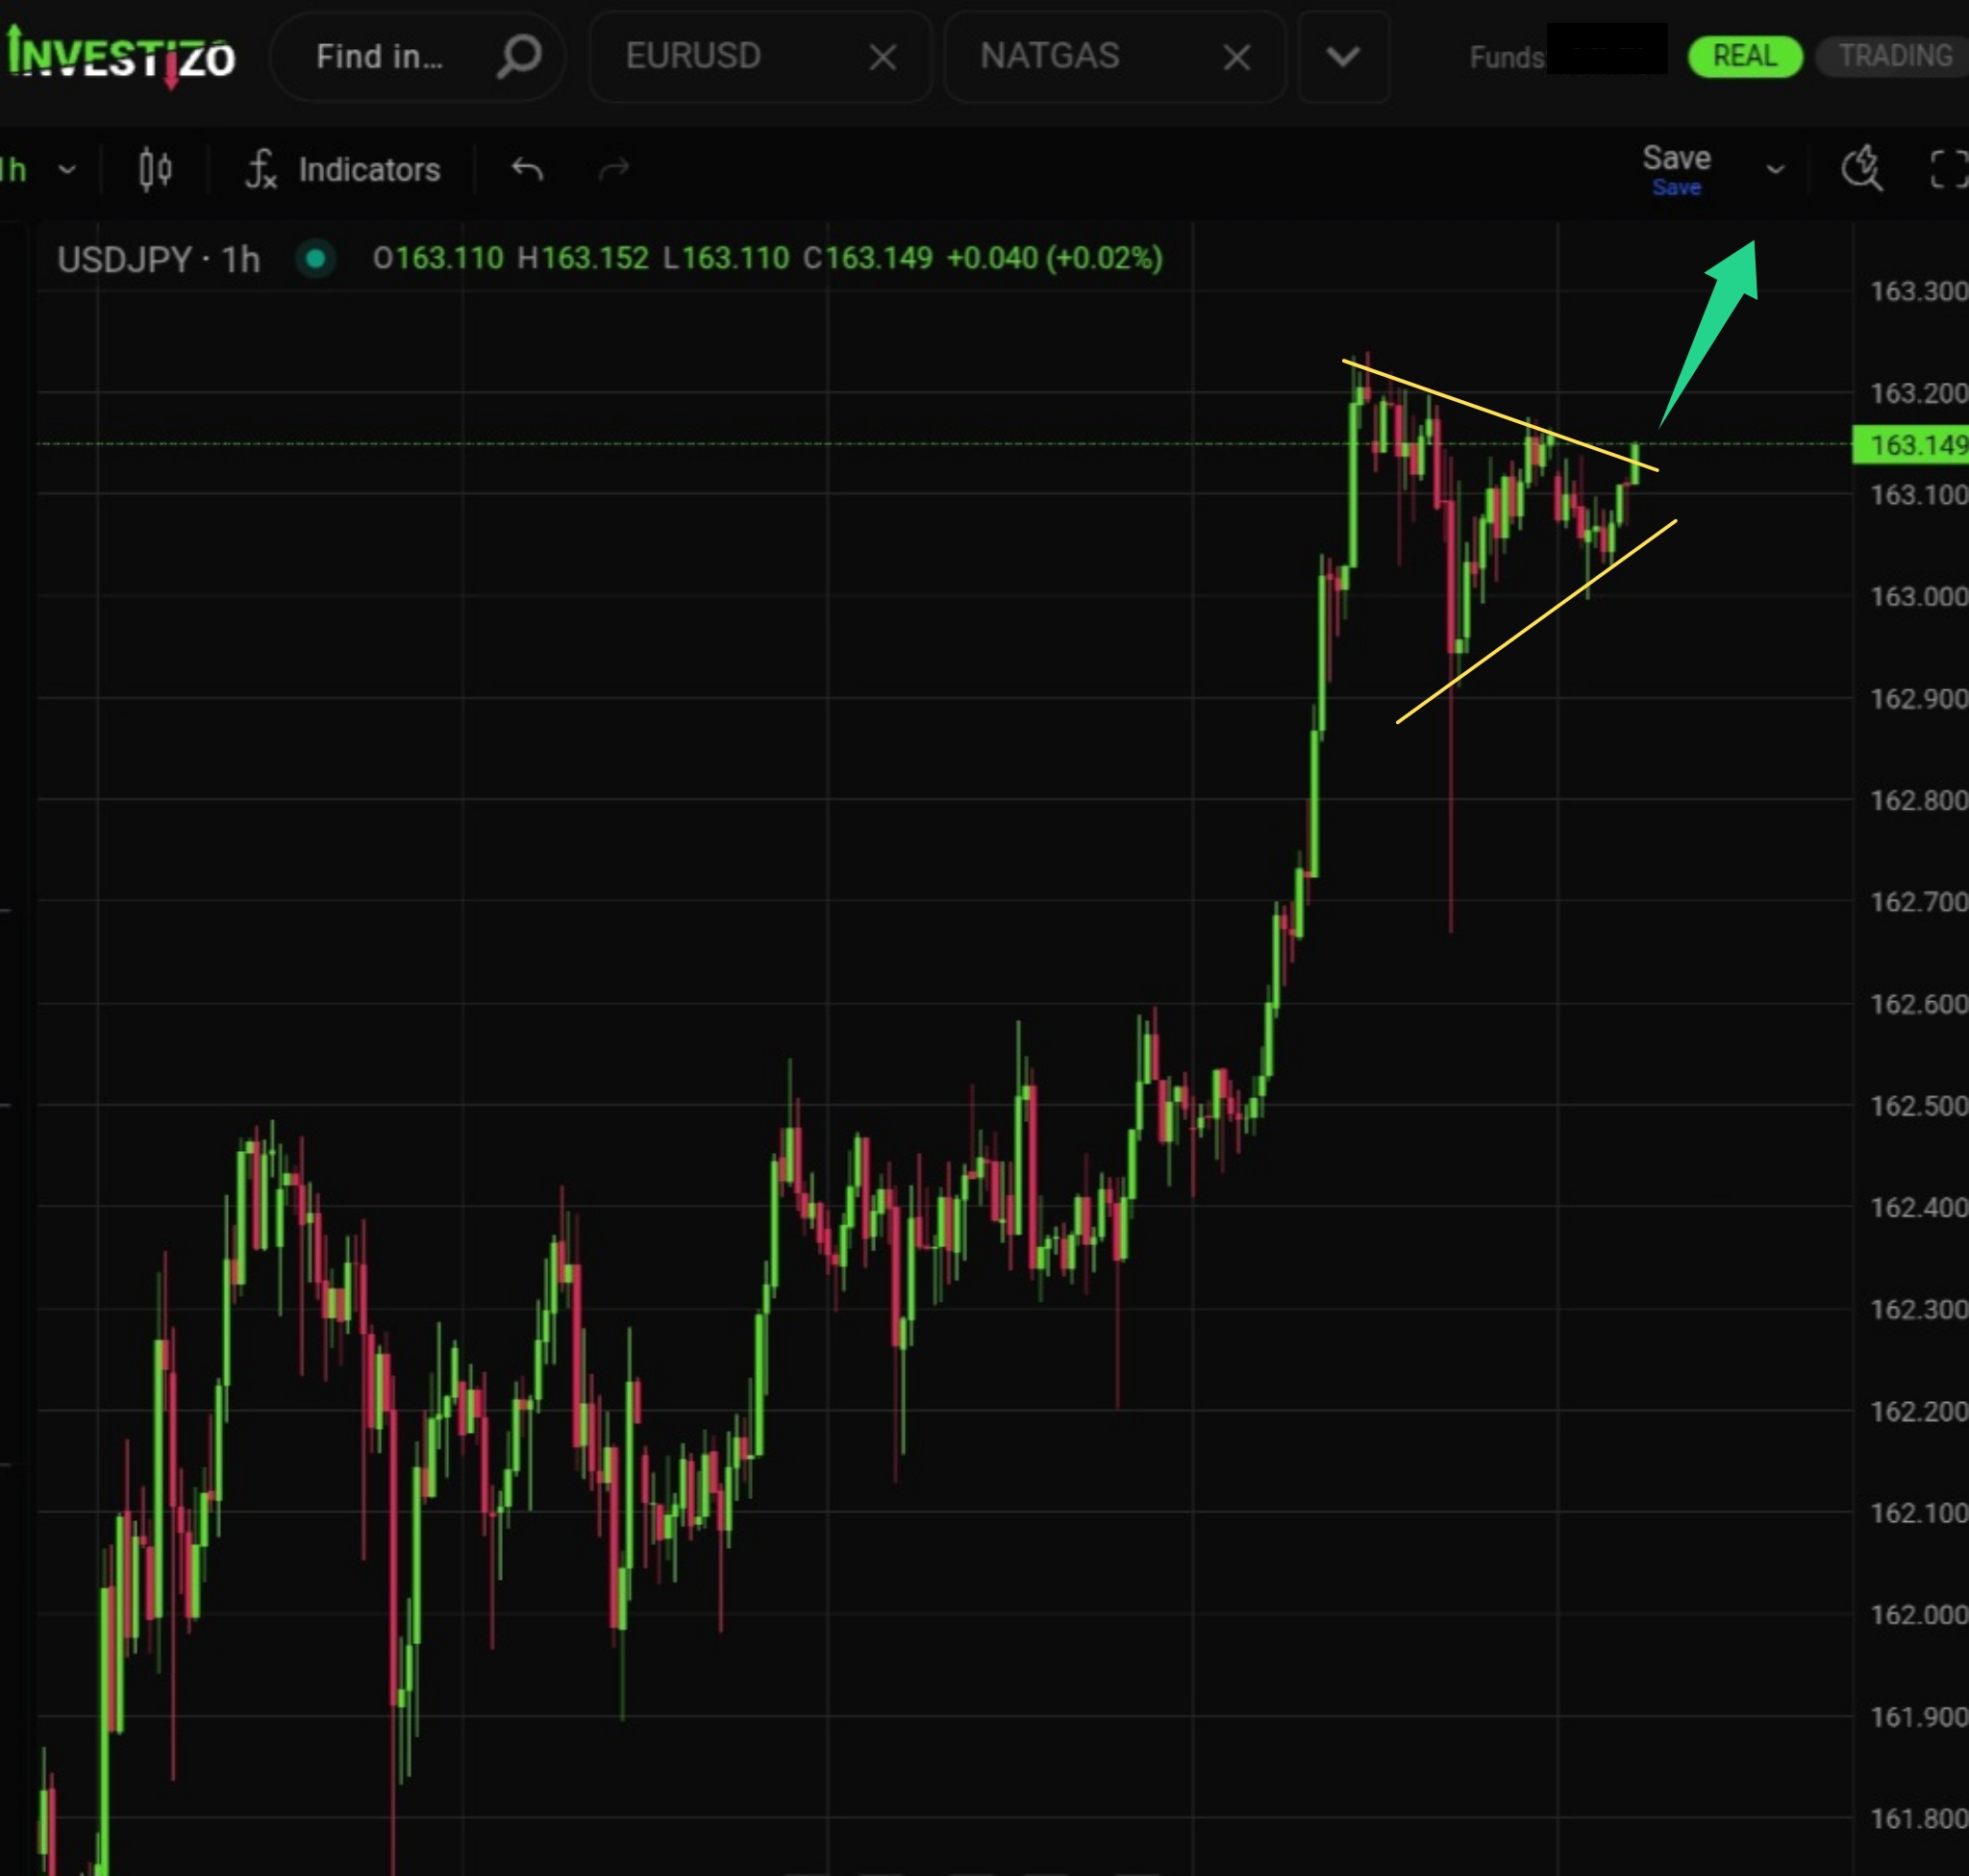
A bullish continuation pattern (“bull pennant”) has formed, suggesting further upside momentum.
The pair continues to form a local consolidation channel, confirming bearish control over the market.
Bitcoin (BTC/USD) trades at 65,700 this Thursday morning, continuing to build a structural floor after gaining 11.5% from its June low.
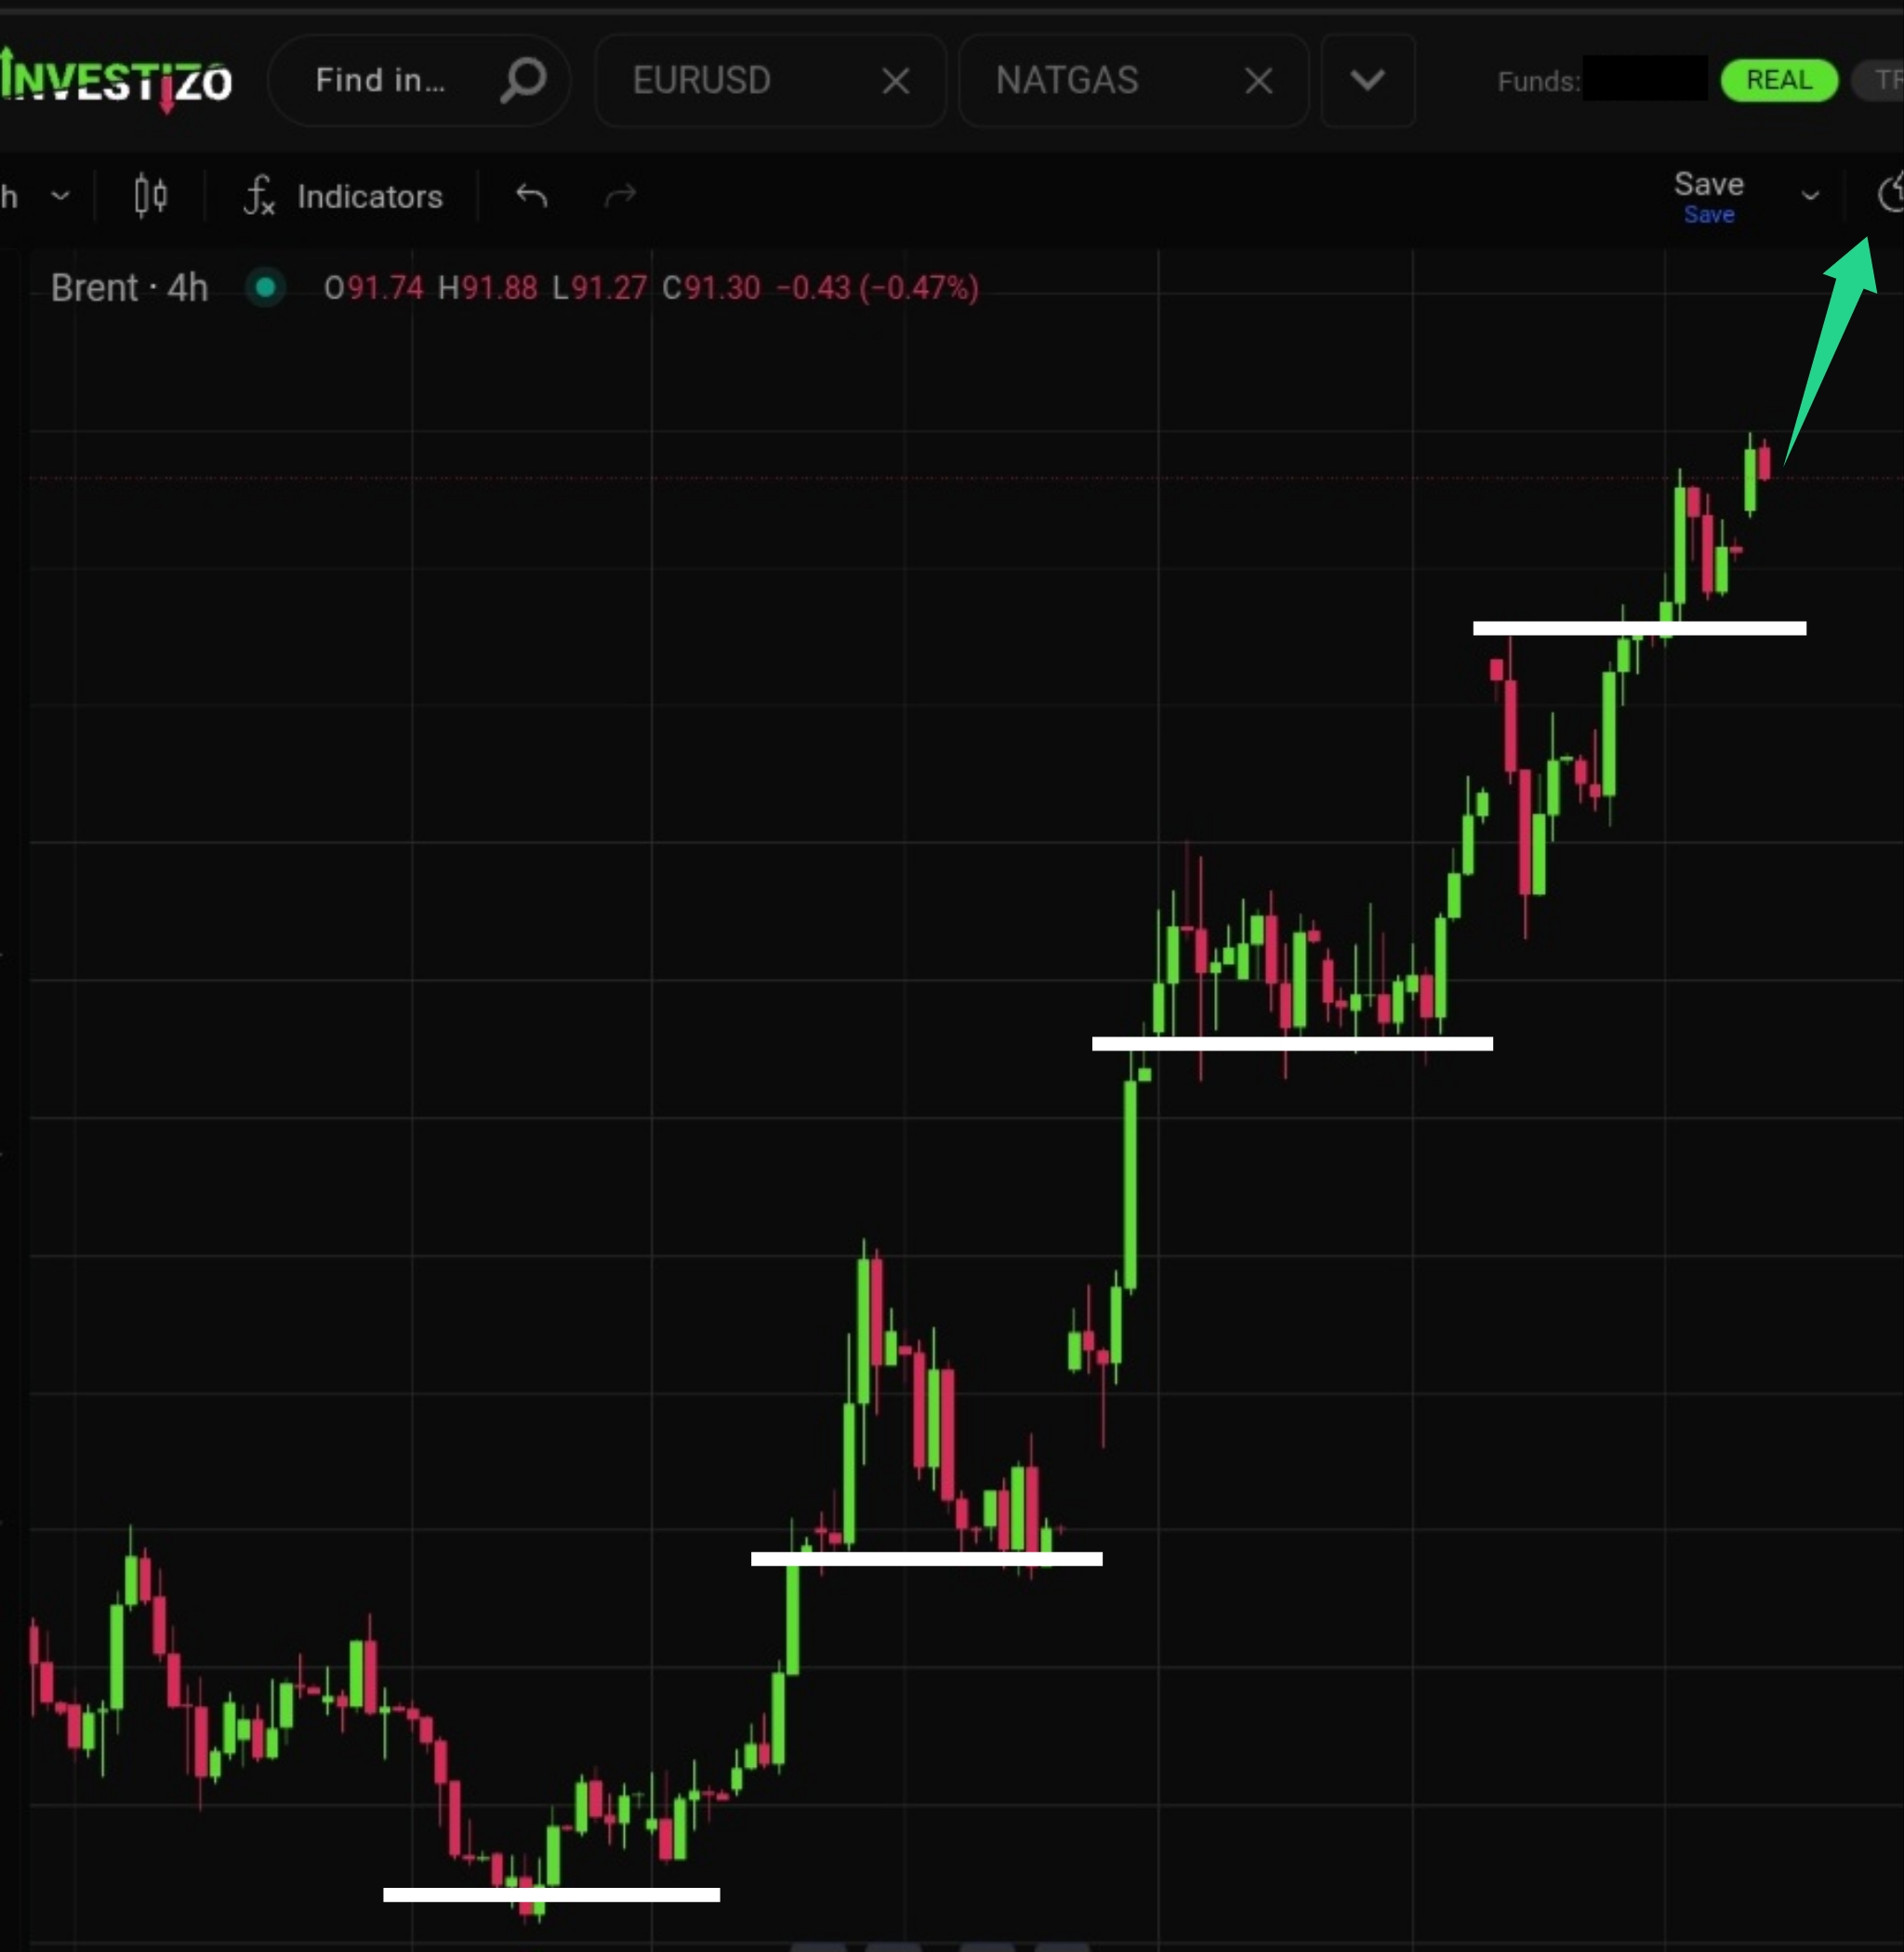
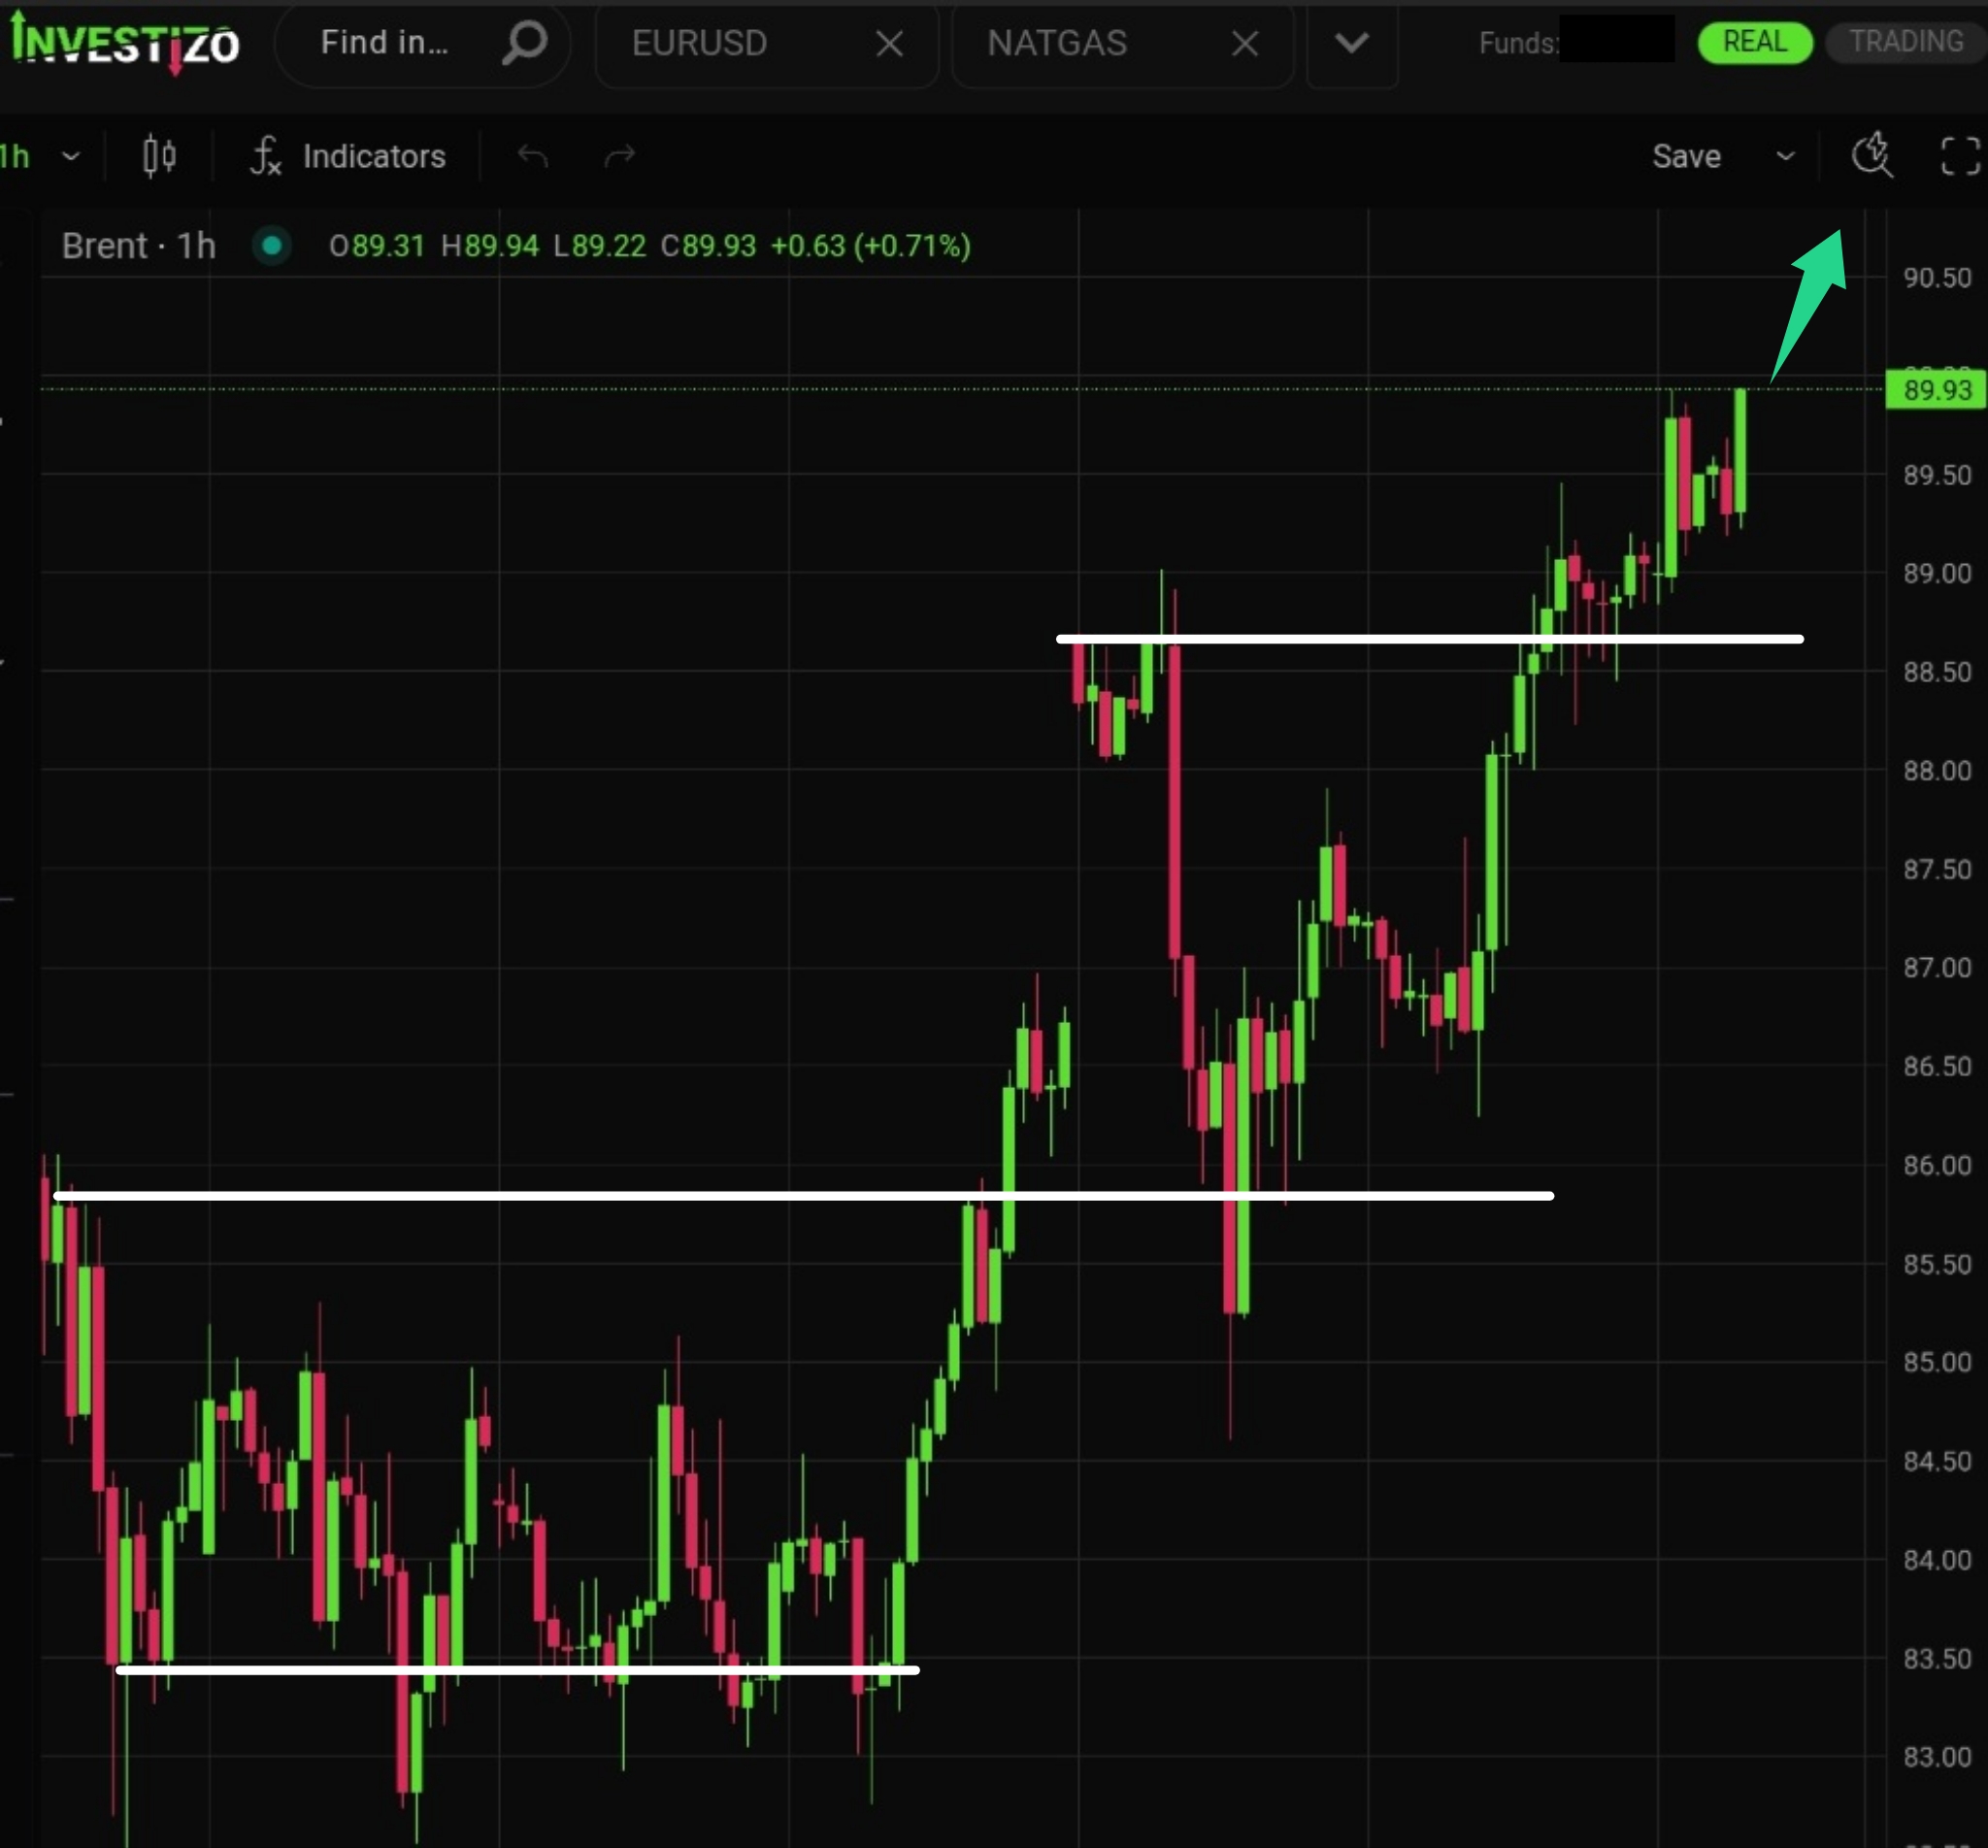
Brent Crude trades at 92.00 this Thursday morning, holding near its intra-session peak of 92.22 per barrel as mounting military tensions.
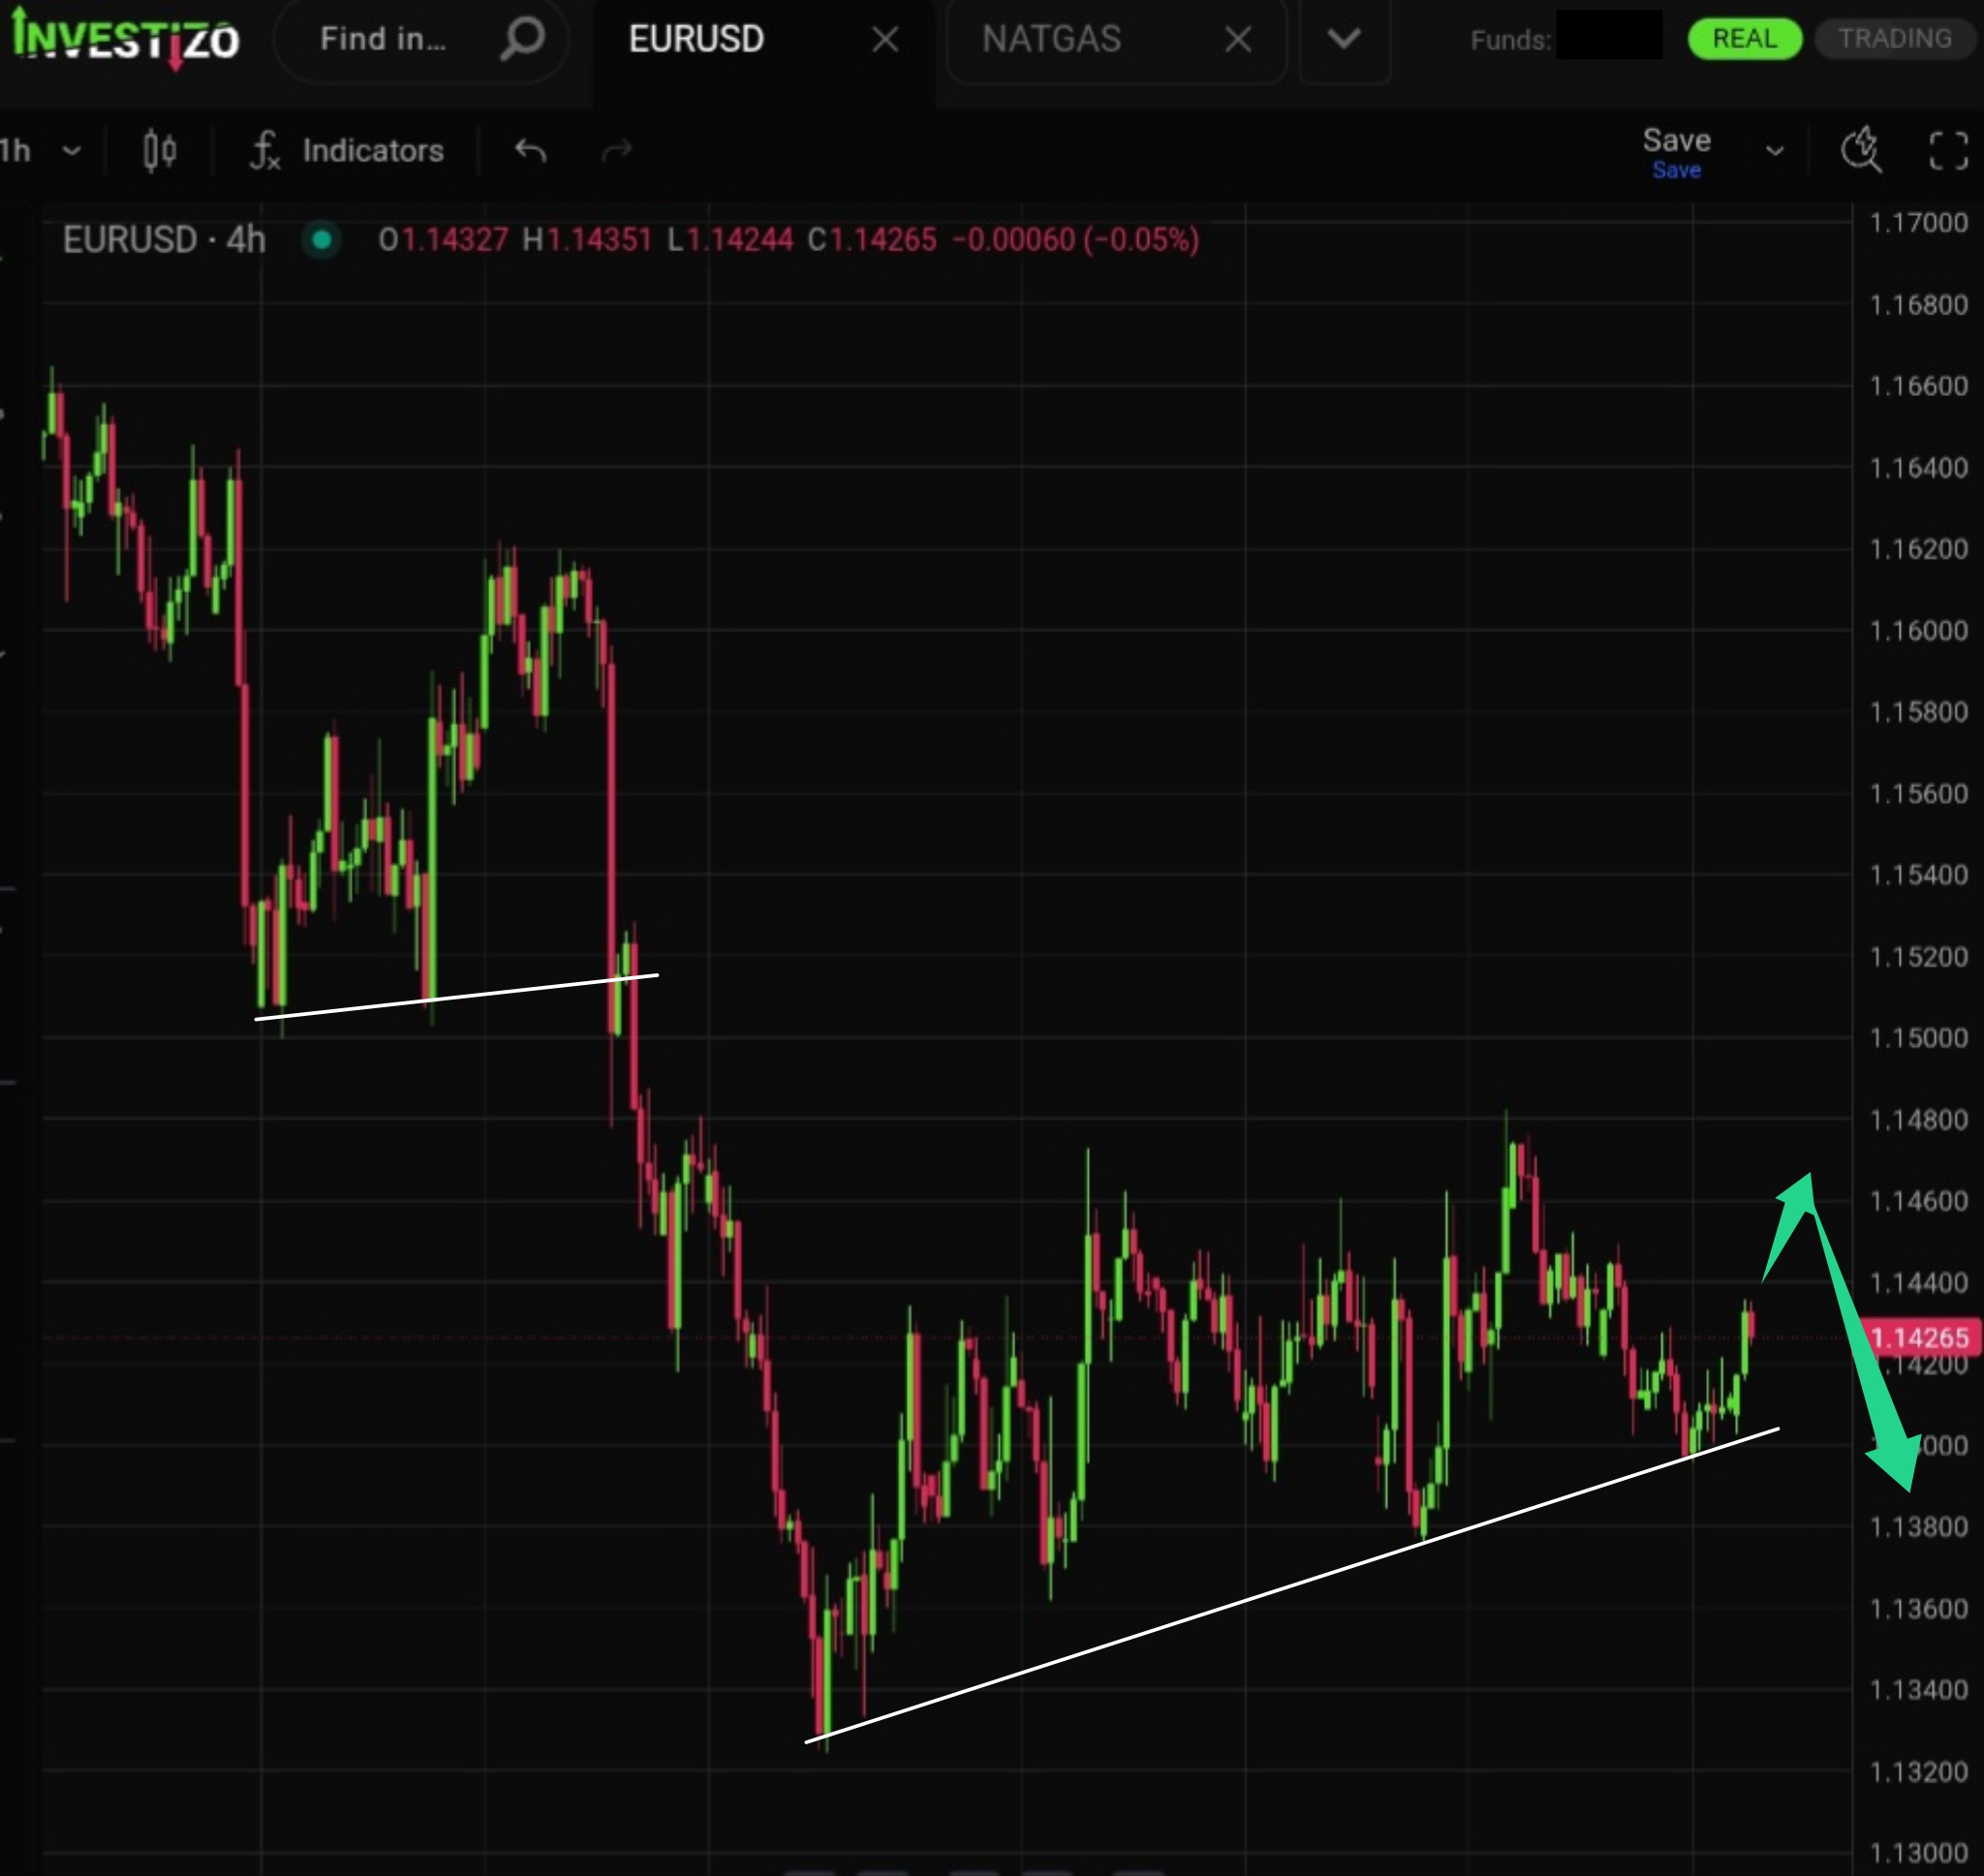
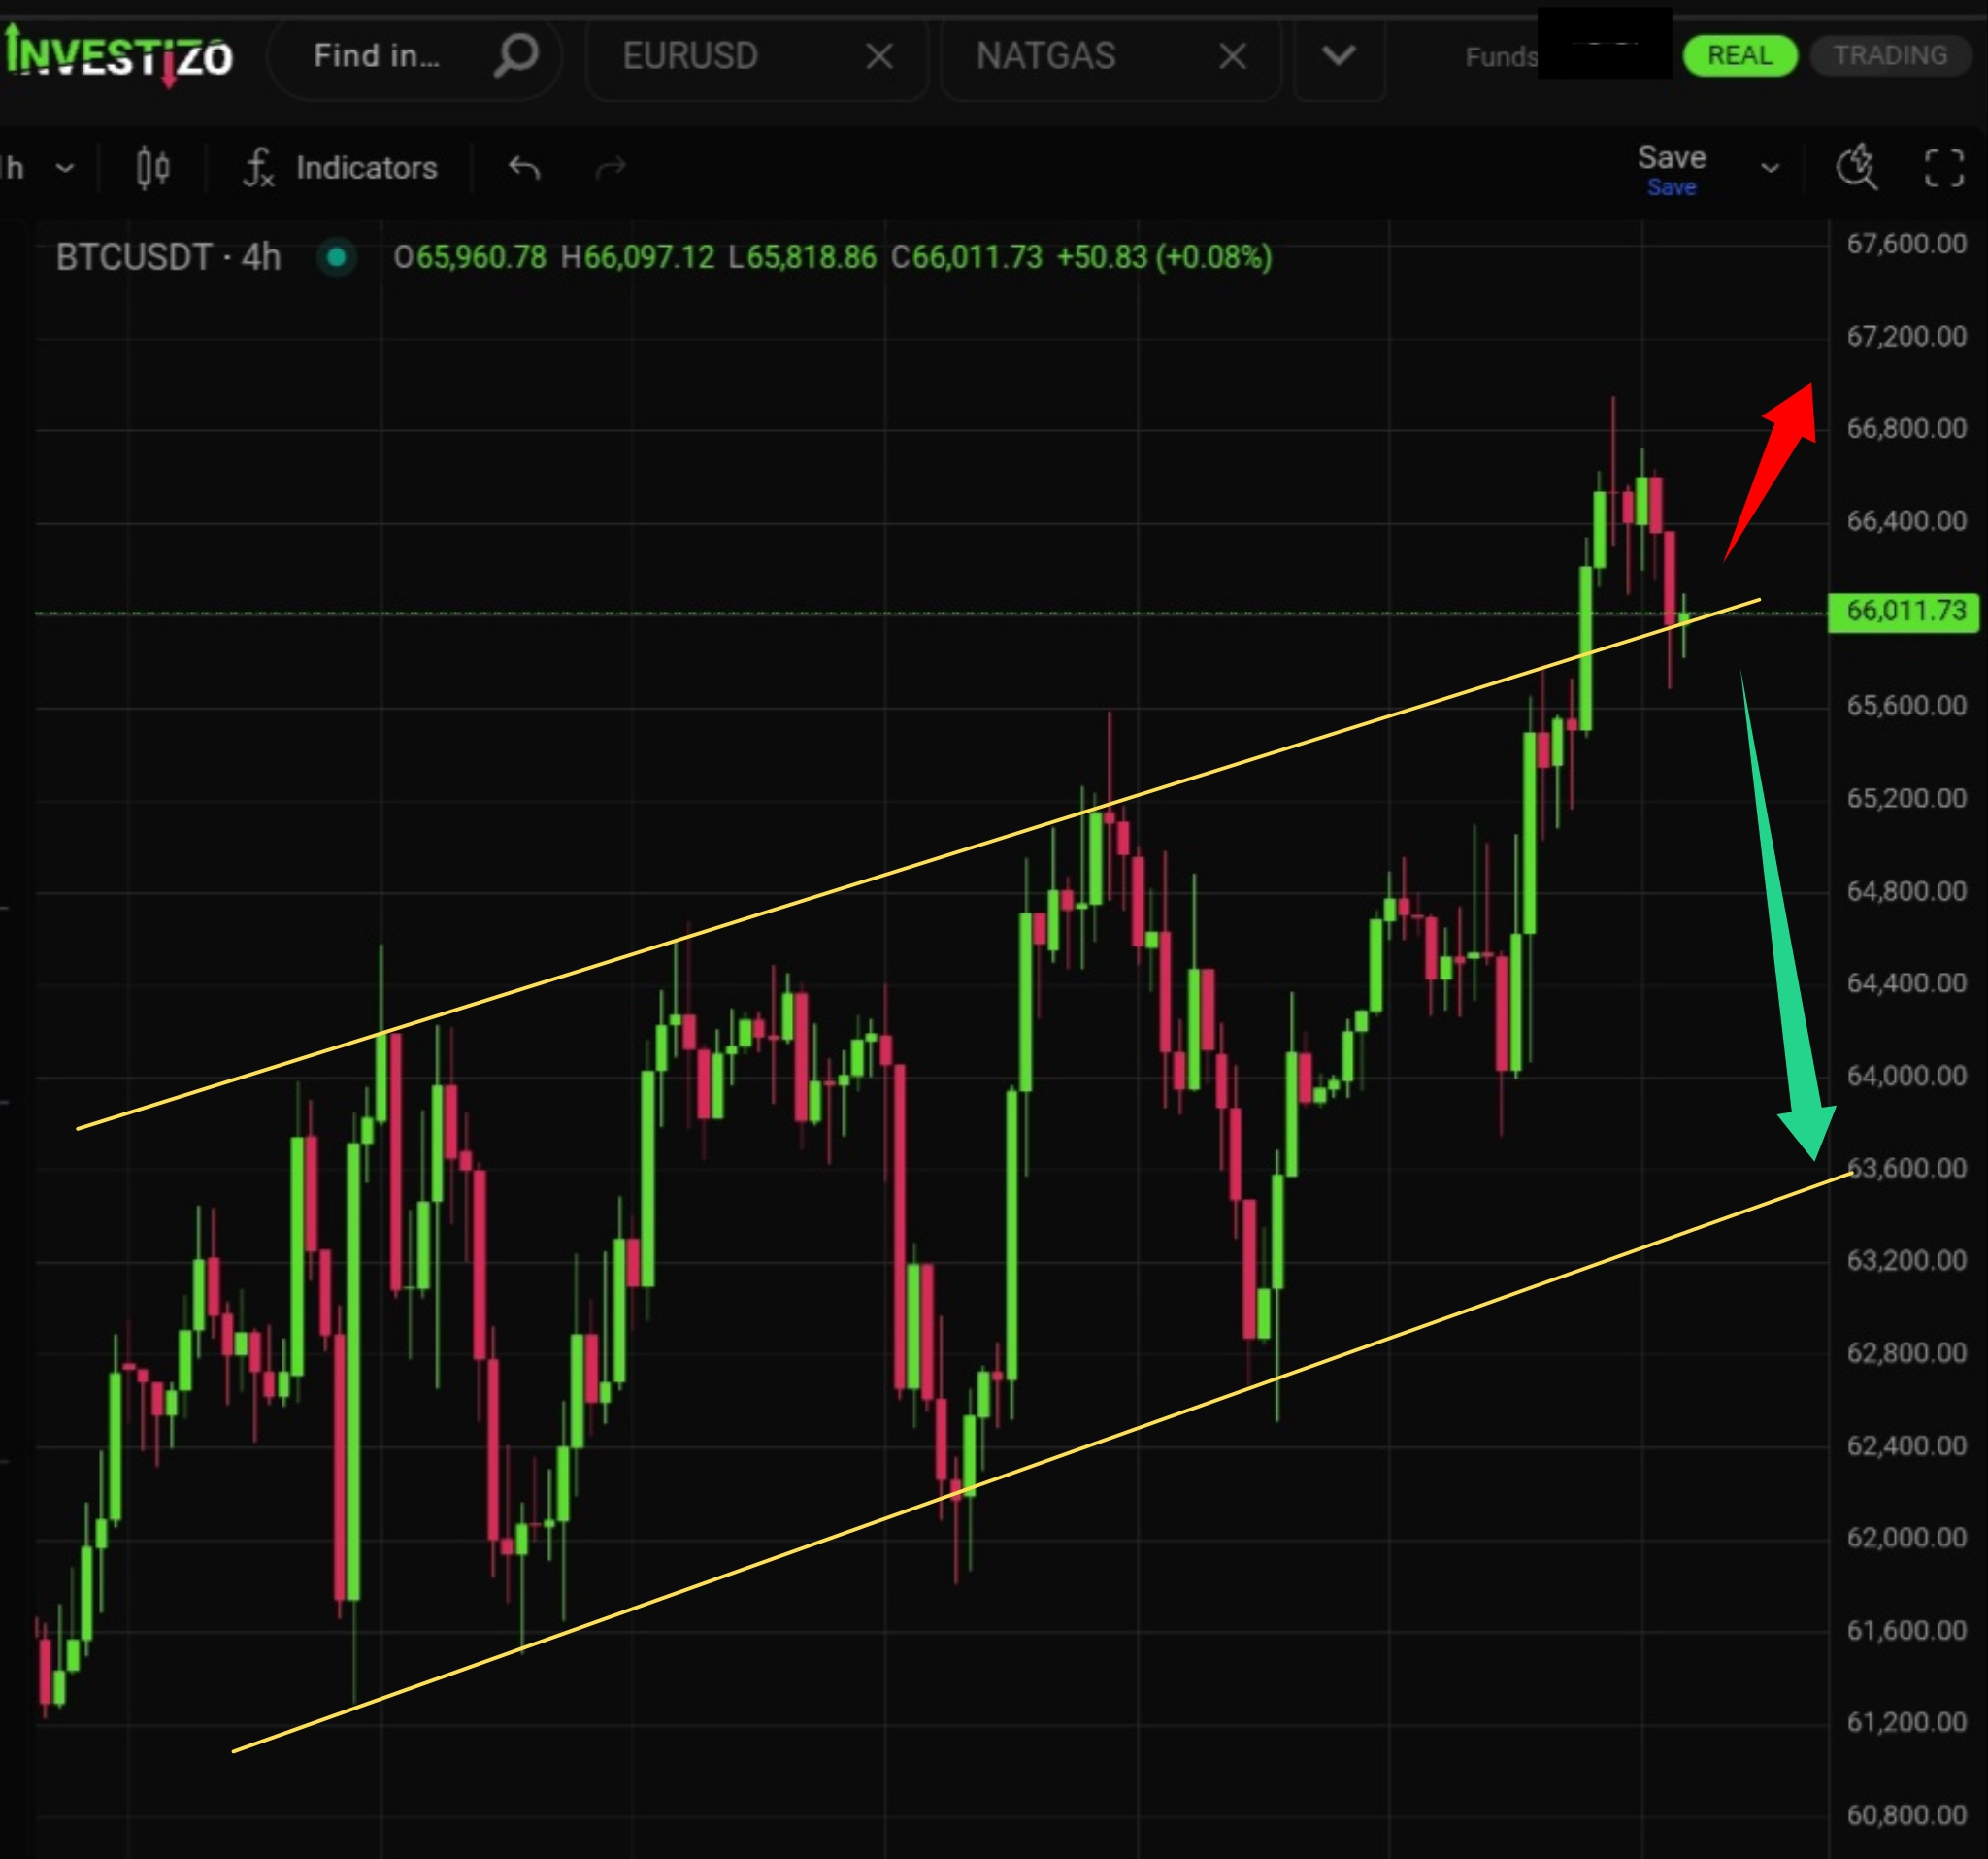
The market is debating whether the breakout above the ascending channel signals a full shift toward buyer dominance or if it was merely a false breakout.
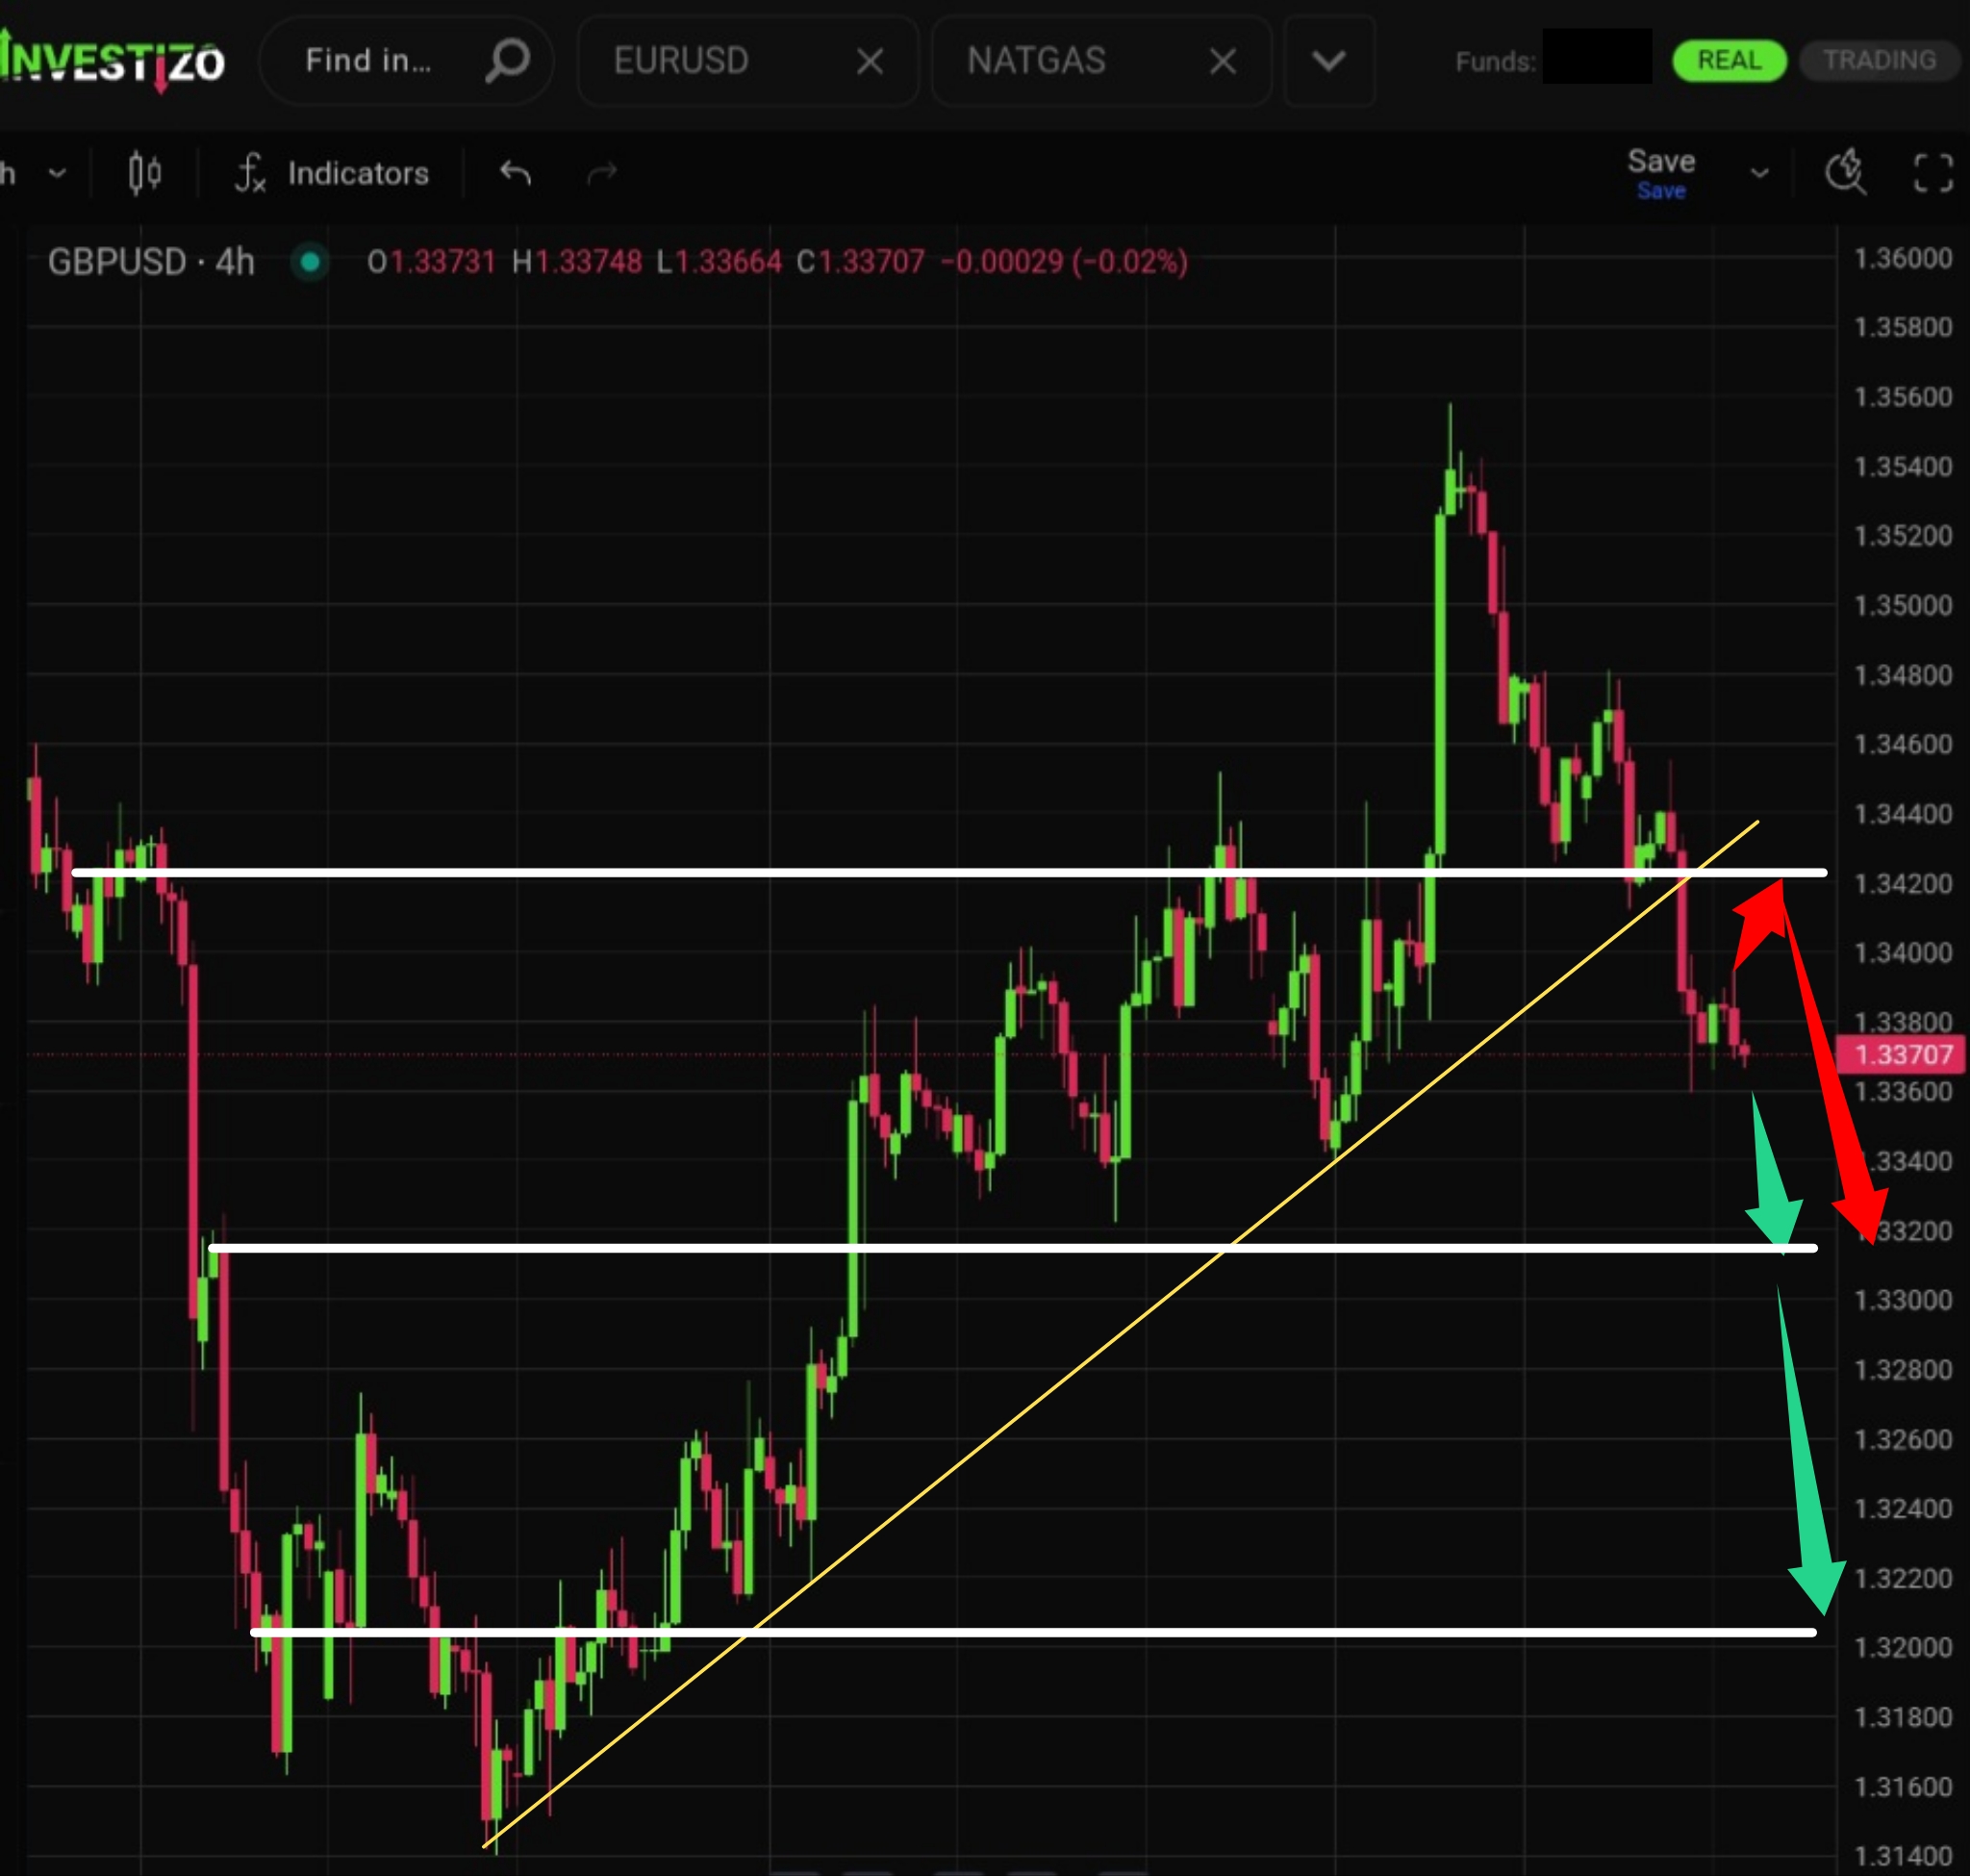
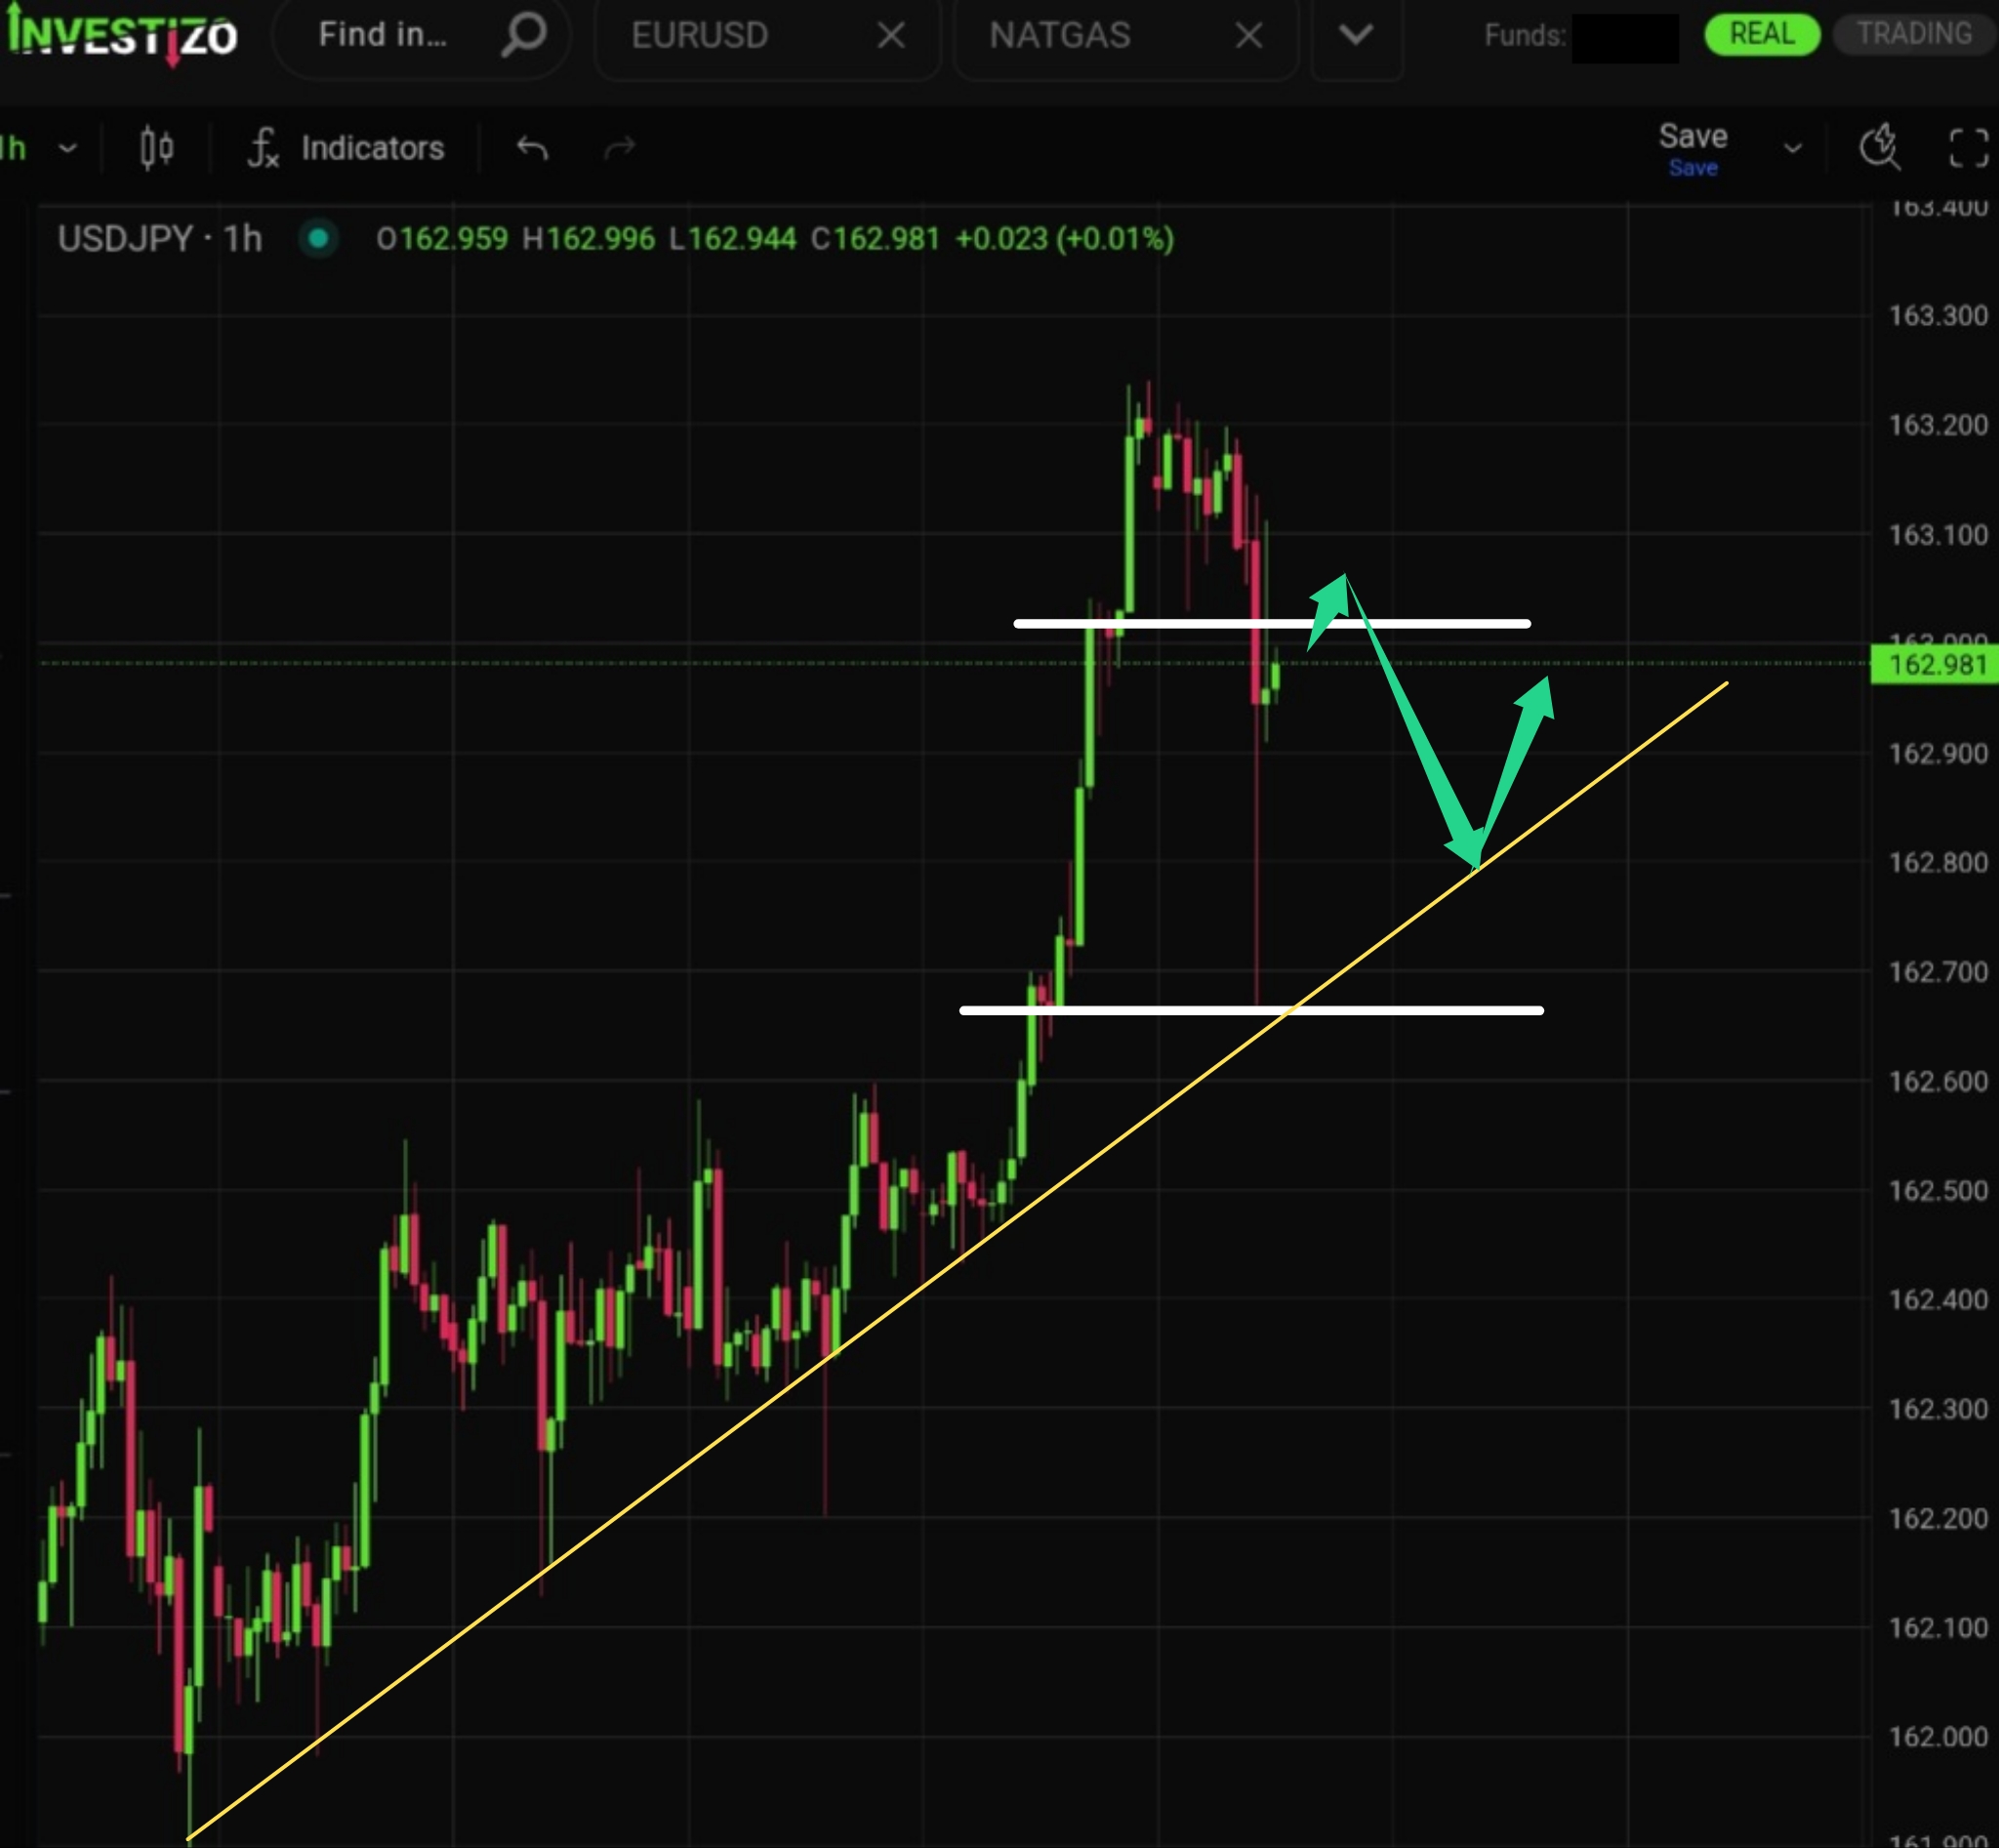
The local uptrend that followed the breakout of the trendline appears to have completed.
The strong upward momentum triggered active profit-taking, resulting in a sharp local sell-off of nearly 70 pips.
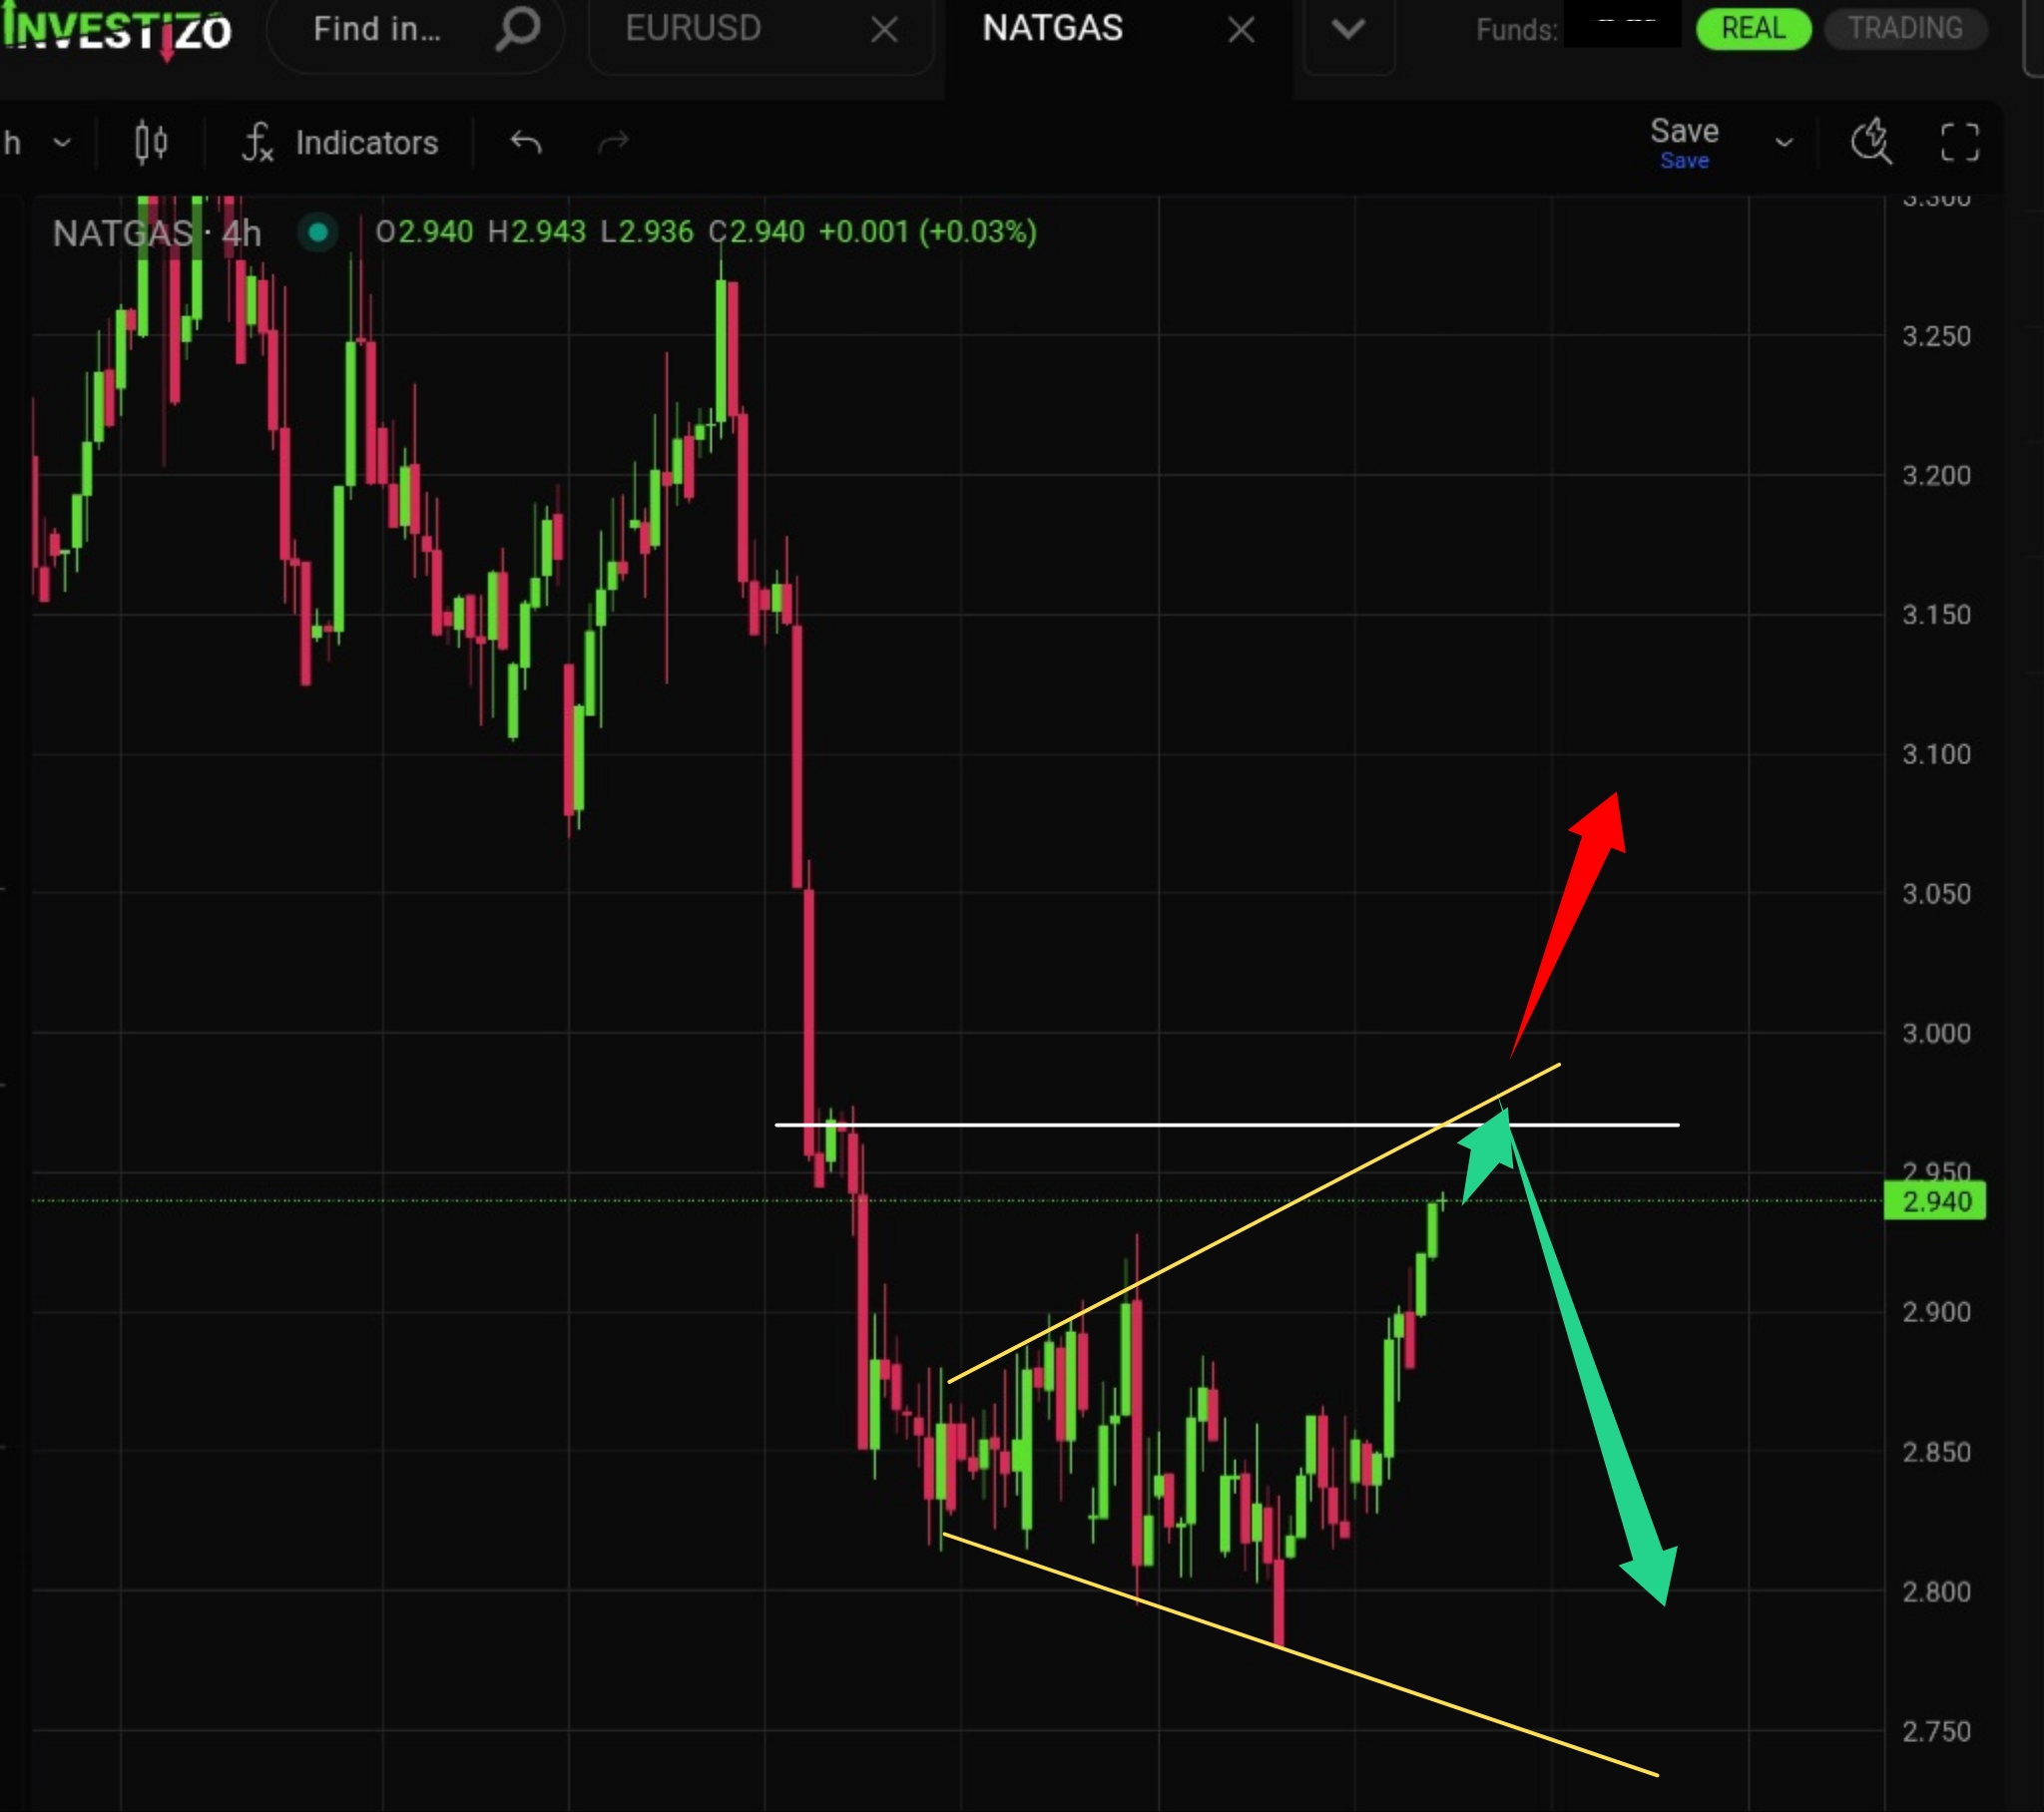
The final phase of consolidation is underway ahead of a highly probable breakdown of the downward-sloping trendline.
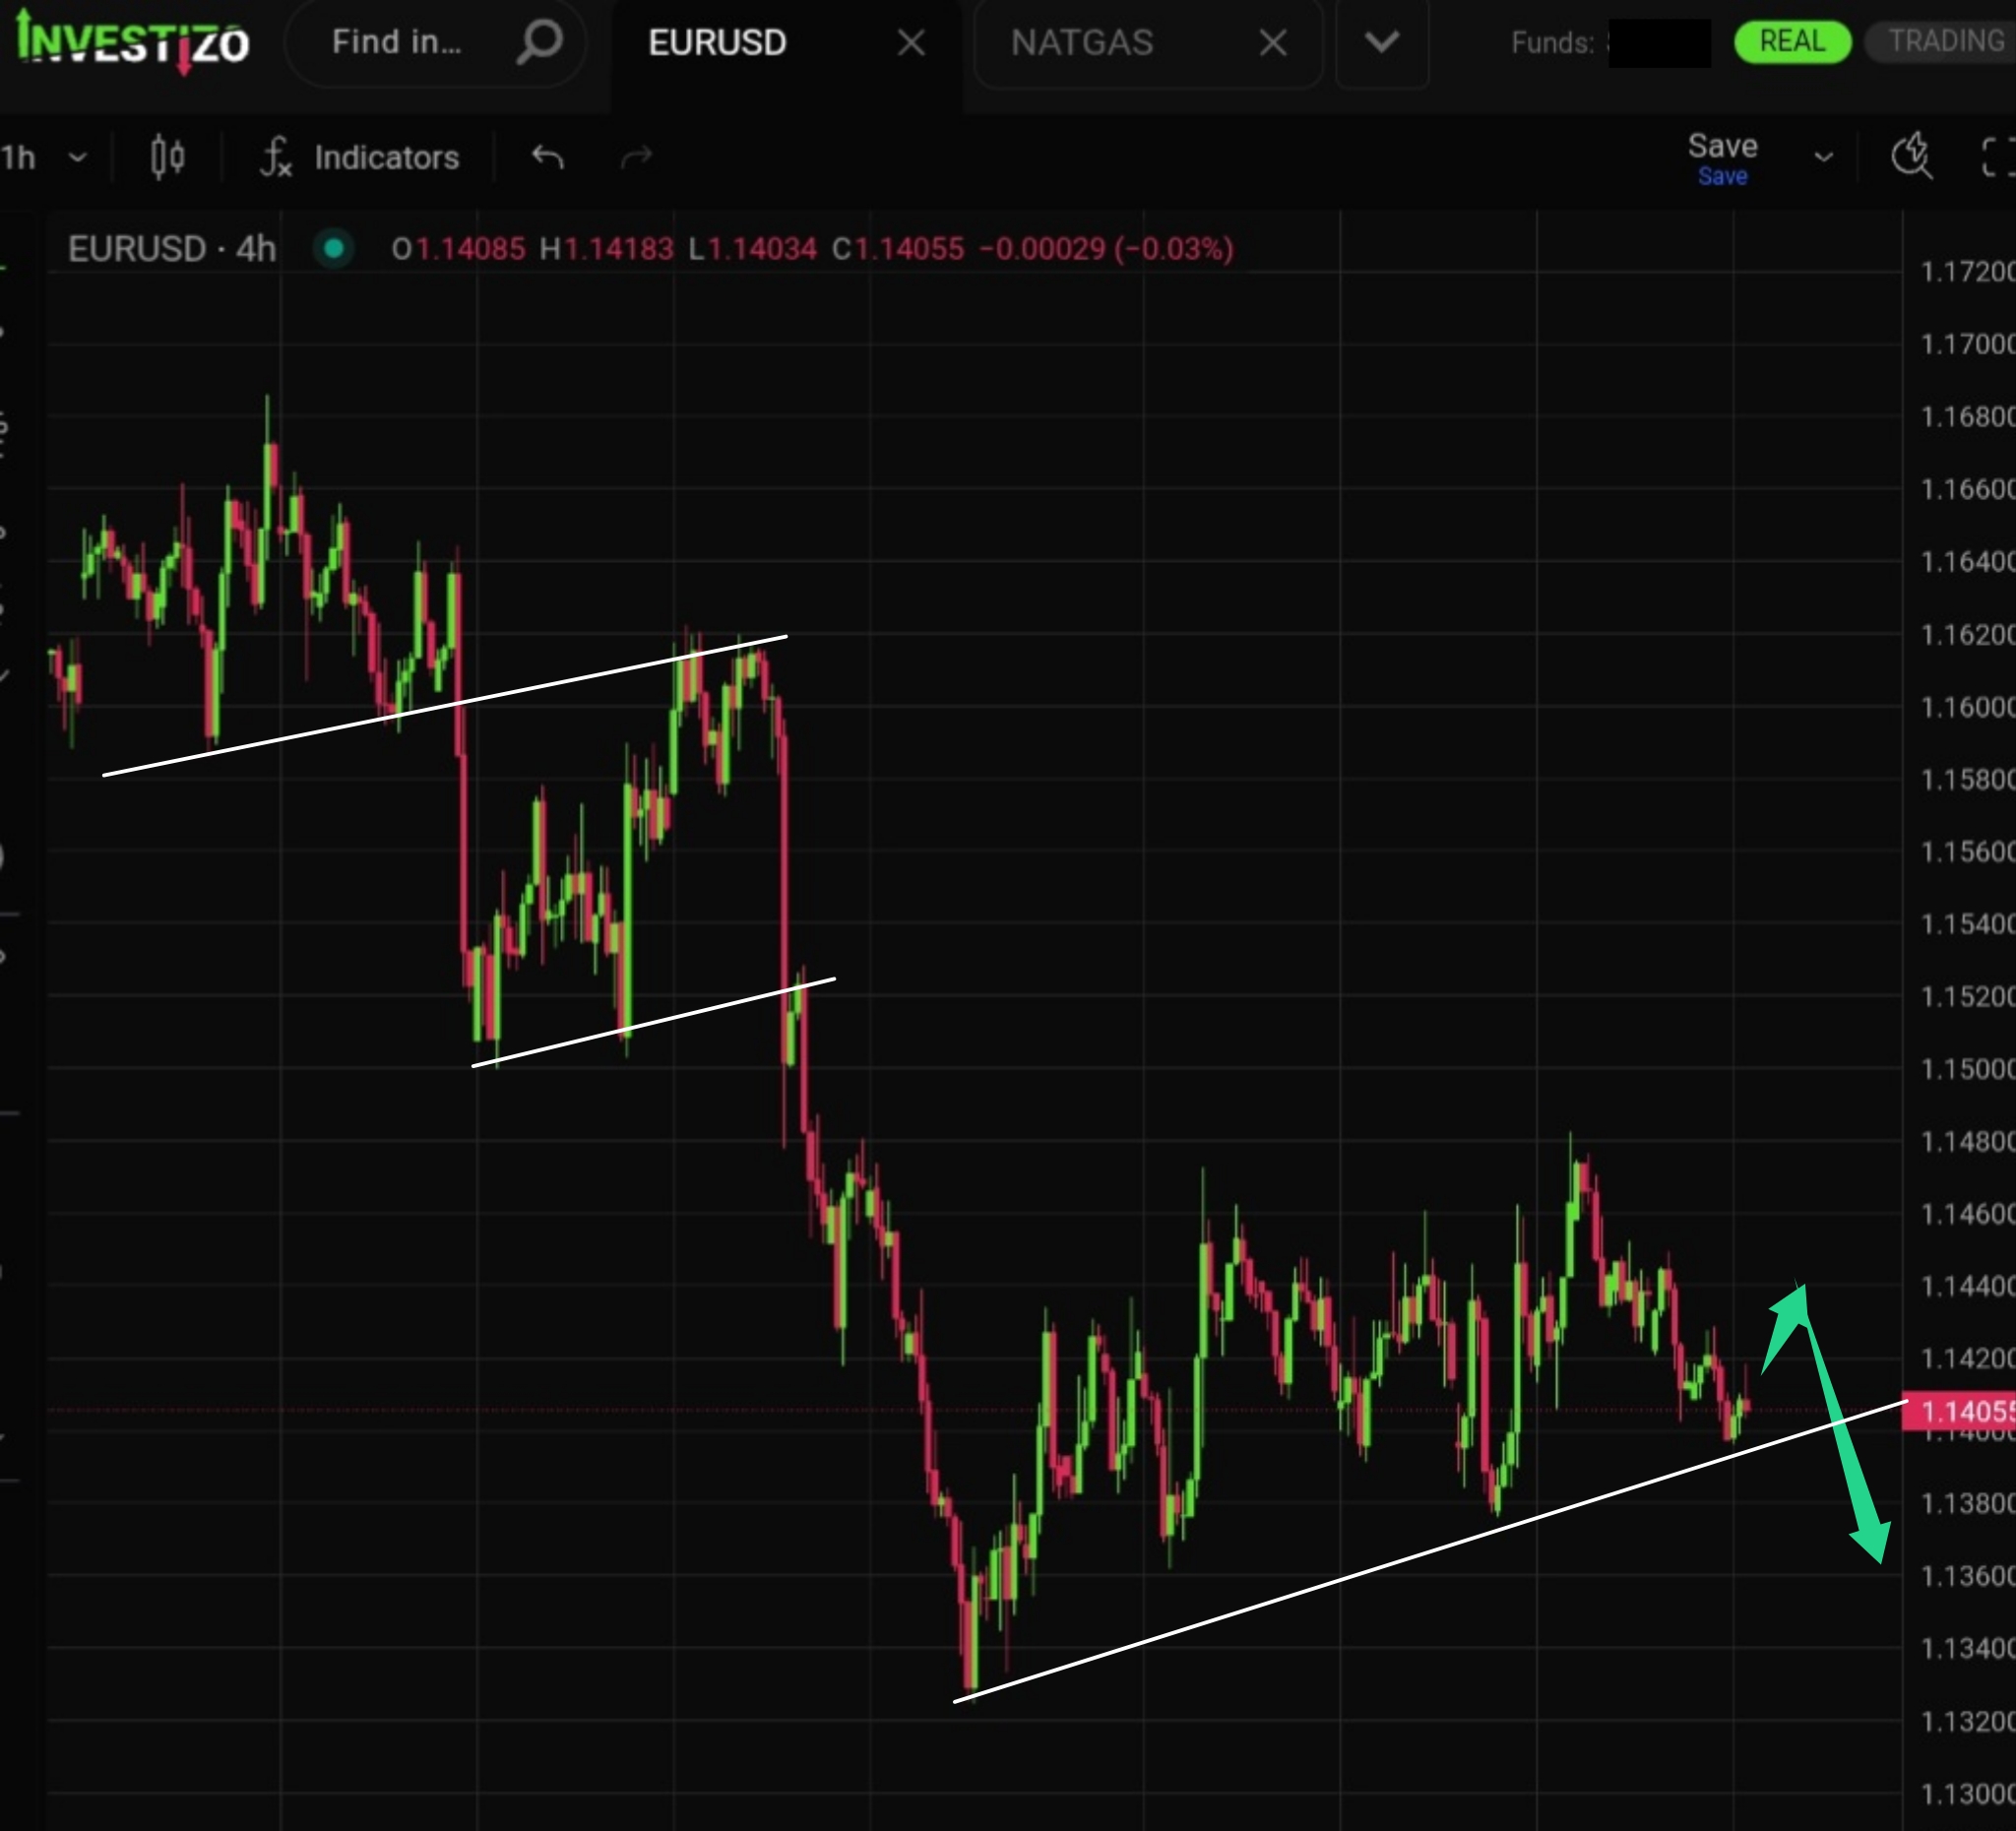
The medium-term downtrend line has been decisively broken, allowing bulls to establish a solid base for a potential upward move over the coming weeks.
Bitcoin (BTC/USD) trades at 65,930 this Wednesday morning, consolidating near five-week highs along the upper boundary of its established 59,000 to 66,000 trading range.
Brent Crude trades at $90.00 this Wednesday morning, reaching the key psychological threshold after mounting a 20% rally across July.
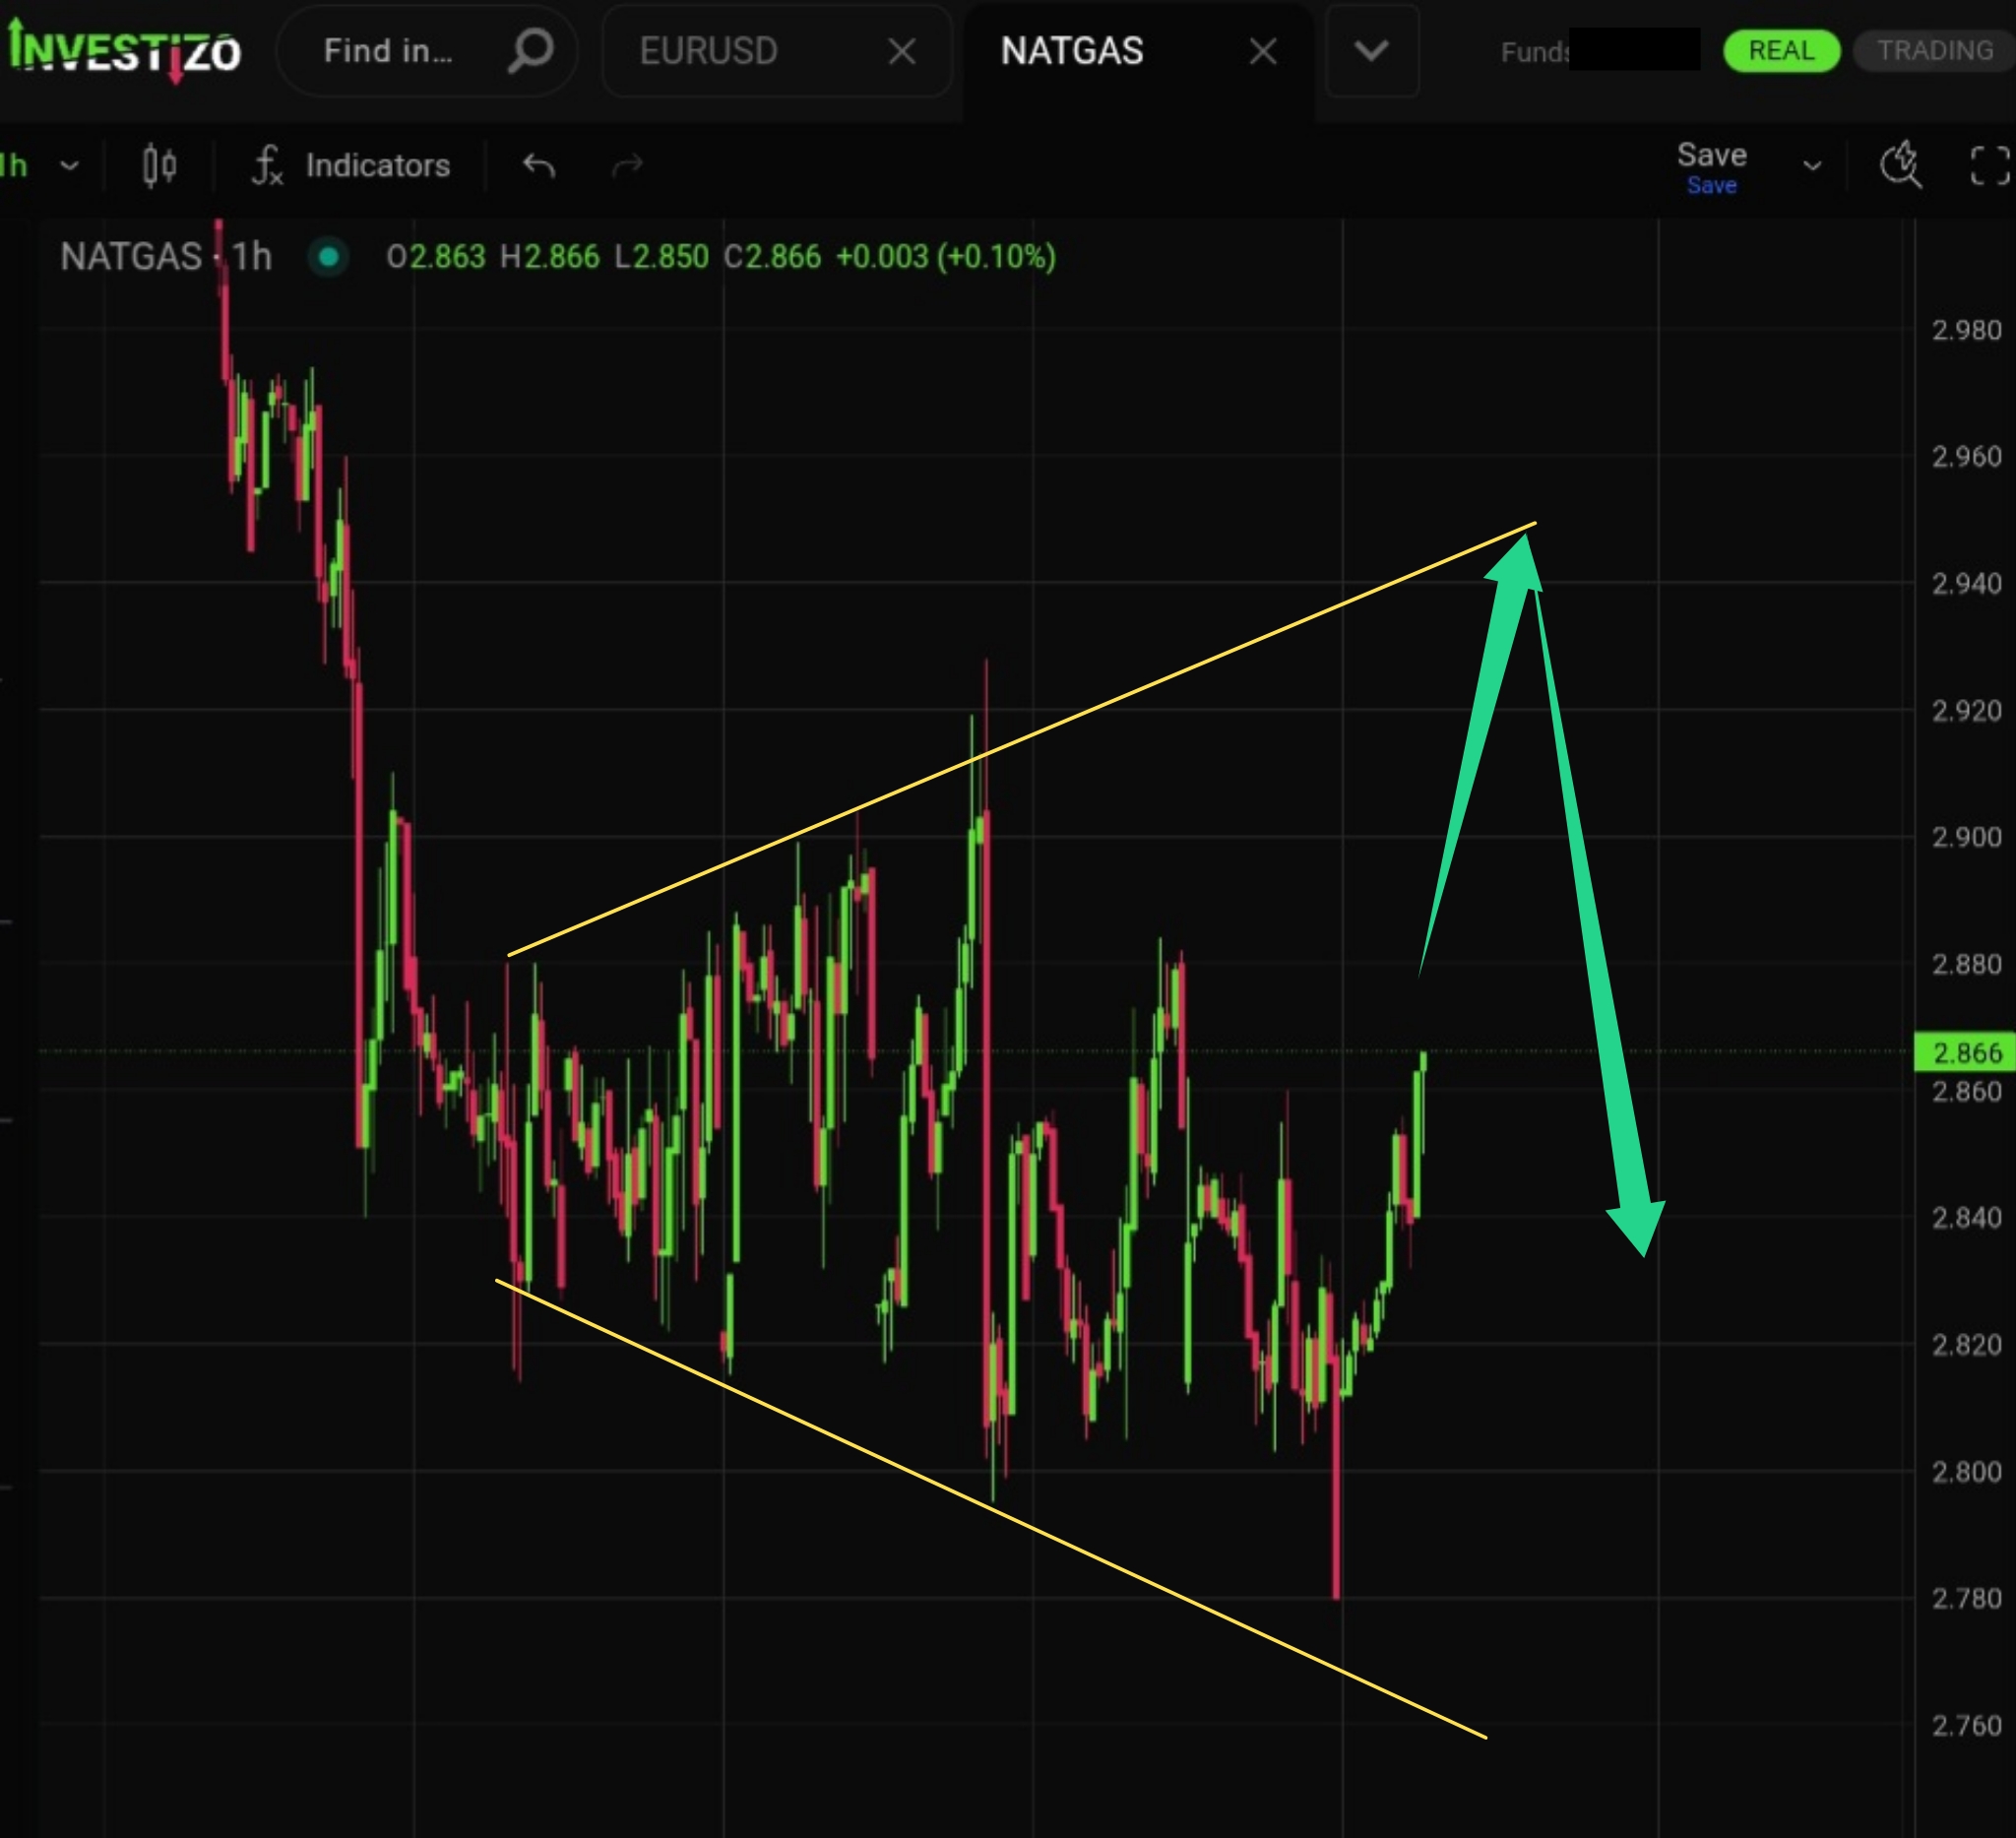
The formation of an expanding “megaphone” (broadening wedge) pattern is being confirmed.