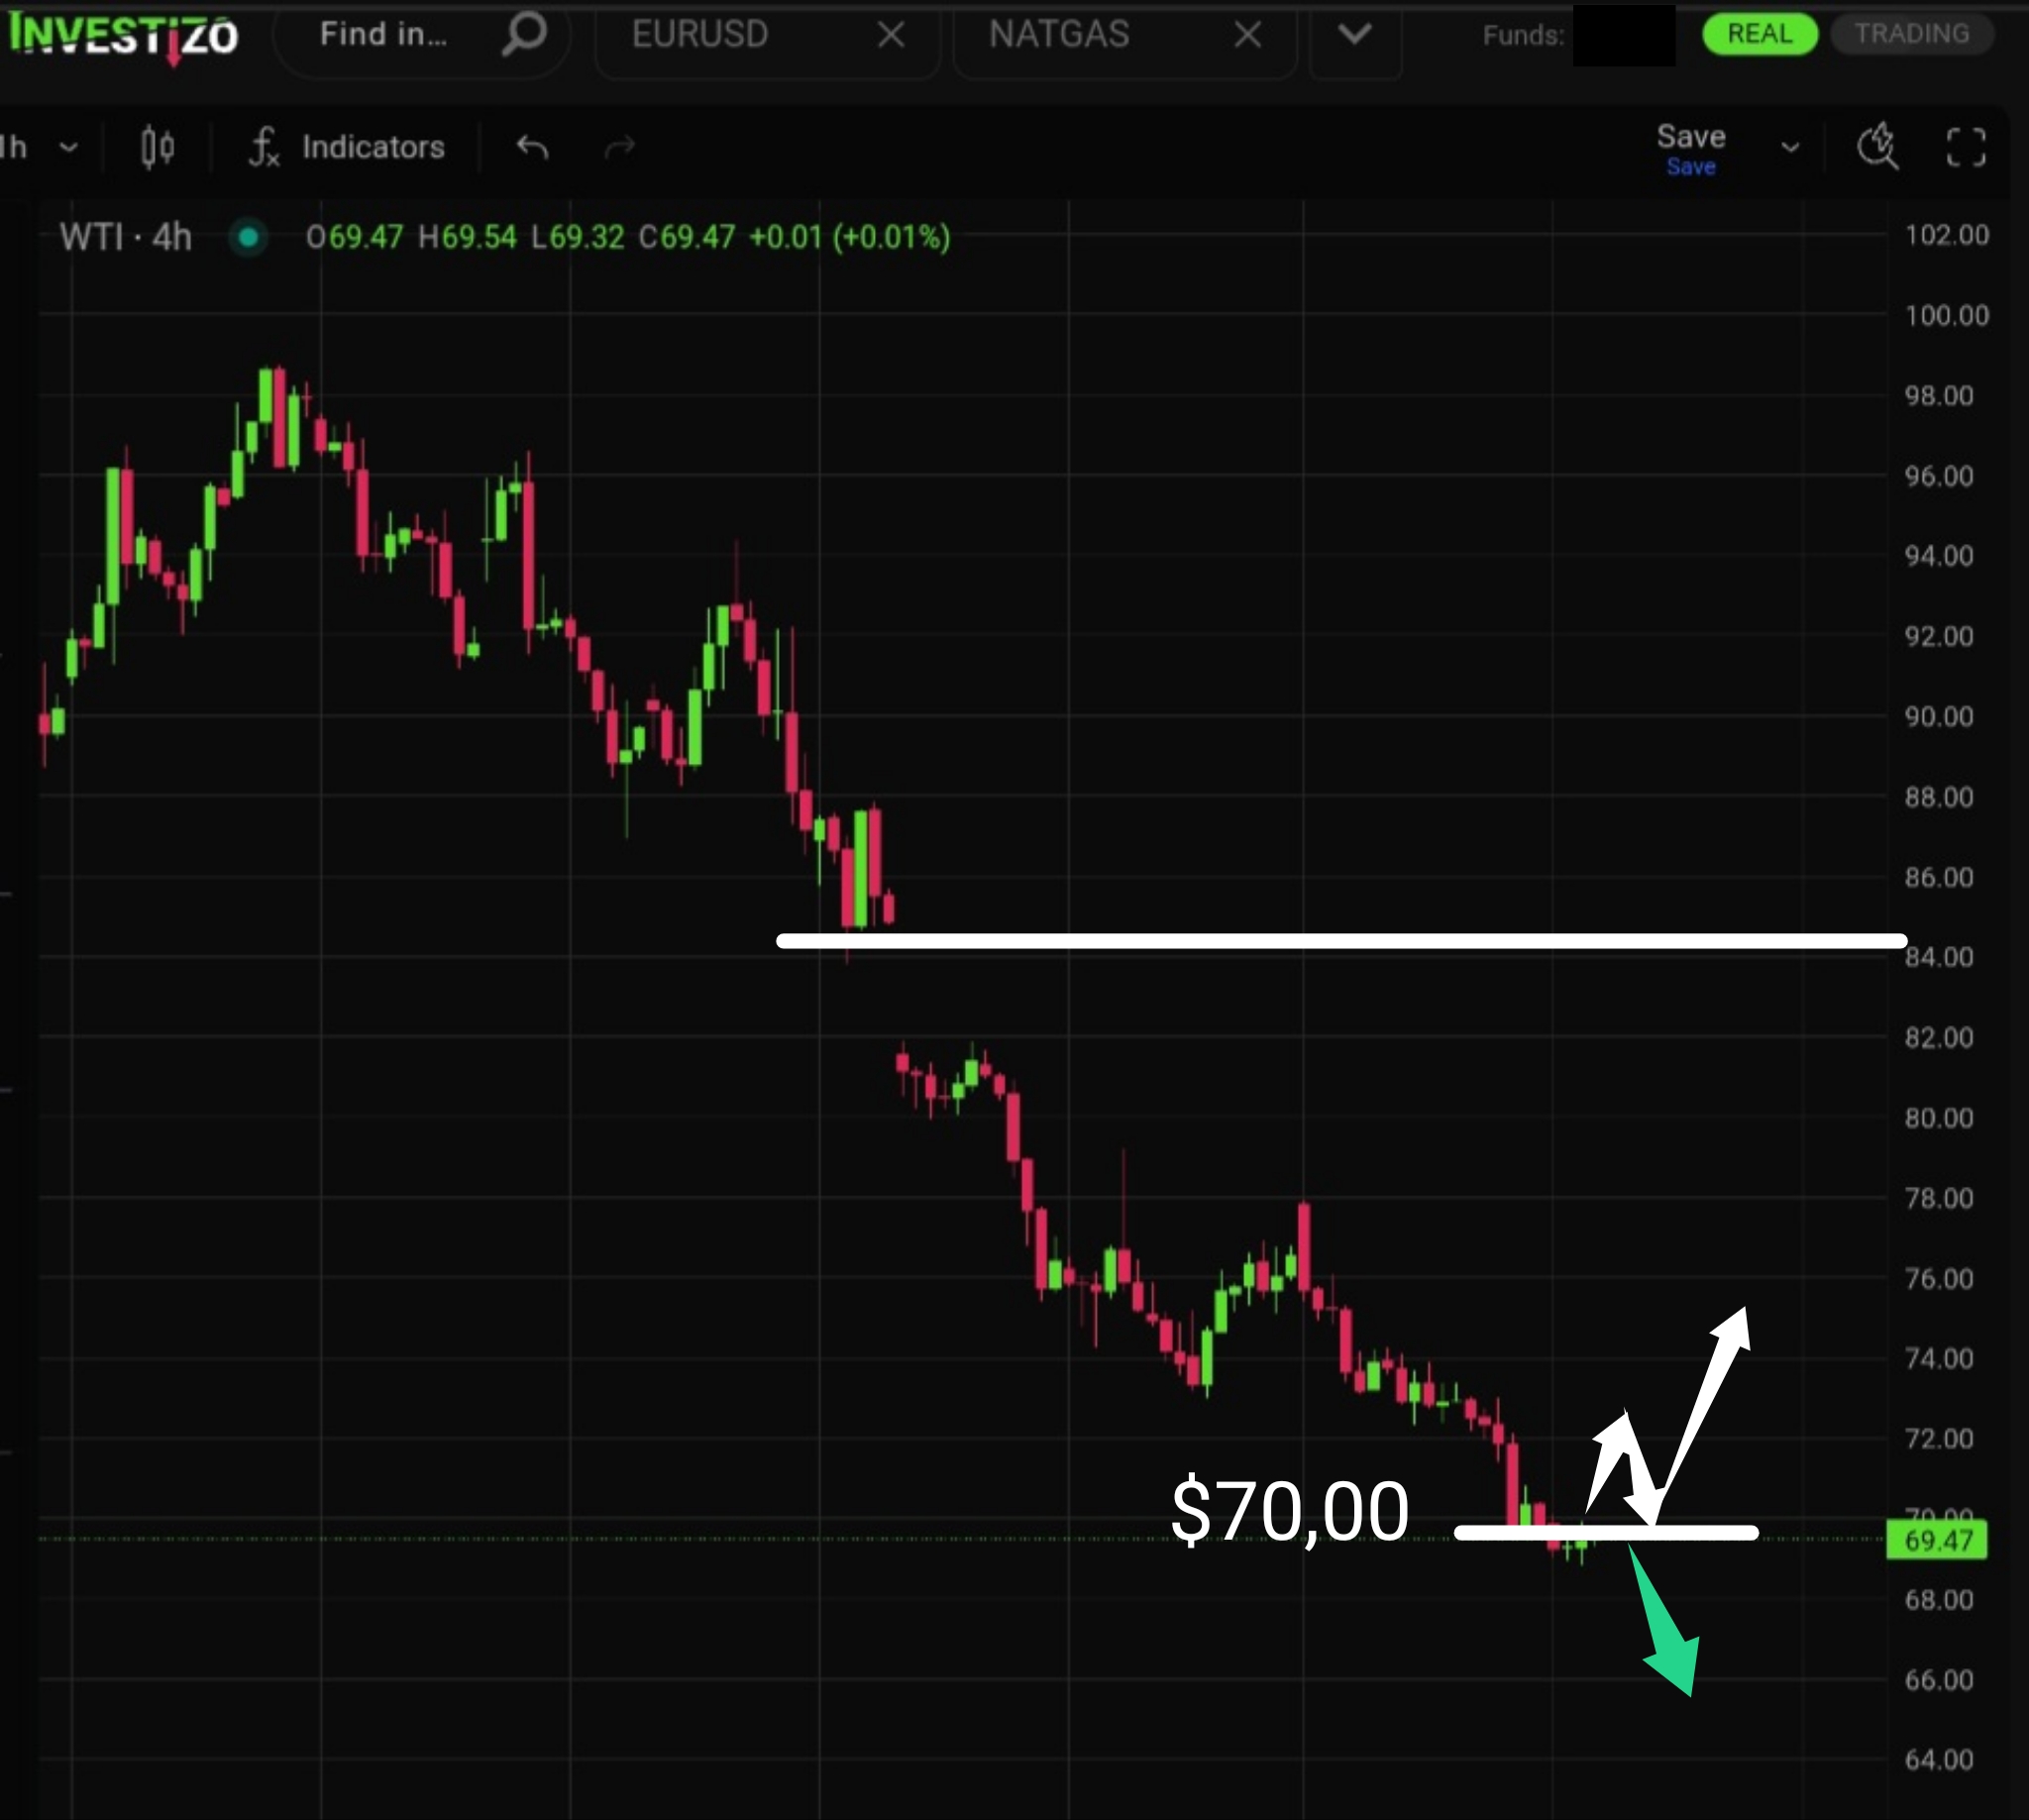
WTI Crude Oil, Technical Analysis – H4
Oil remains in a clear and undisputed downtrend. However, an unfilled gap around $84.20 may act as a catalyst for a corrective bounce.
Investizo LTD. Business company number 25432 BC 2019
Suite 305, Griffith Corporate Centre,
P.O. Box 1510, Beachmont, Kingstown,
St. Vincent and the Grenadines
DUNS 817053497
Phone:+996312610515
E-mail: [email protected]
© 2019-2026 Investizo 18+ Hak cipta terpelihara
Amaran Risiko: CFD adalah produk kewangan kompleks yang diperdagangkan berdasarkan margin. Perdagangan CFD berisiko dan mungkin tidak sesuai untuk sebilangan pelabur. Pastikan anda memahami risiko yang dihadapi kerana anda mungkin kehilangan semua modal yang anda laburkan.
Oil remains in a clear and undisputed downtrend. However, an unfilled gap around $84.20 may act as a catalyst for a corrective bounce.
The pair continues to consolidate inside an extremely narrow triangular range, with progressively less room remaining.
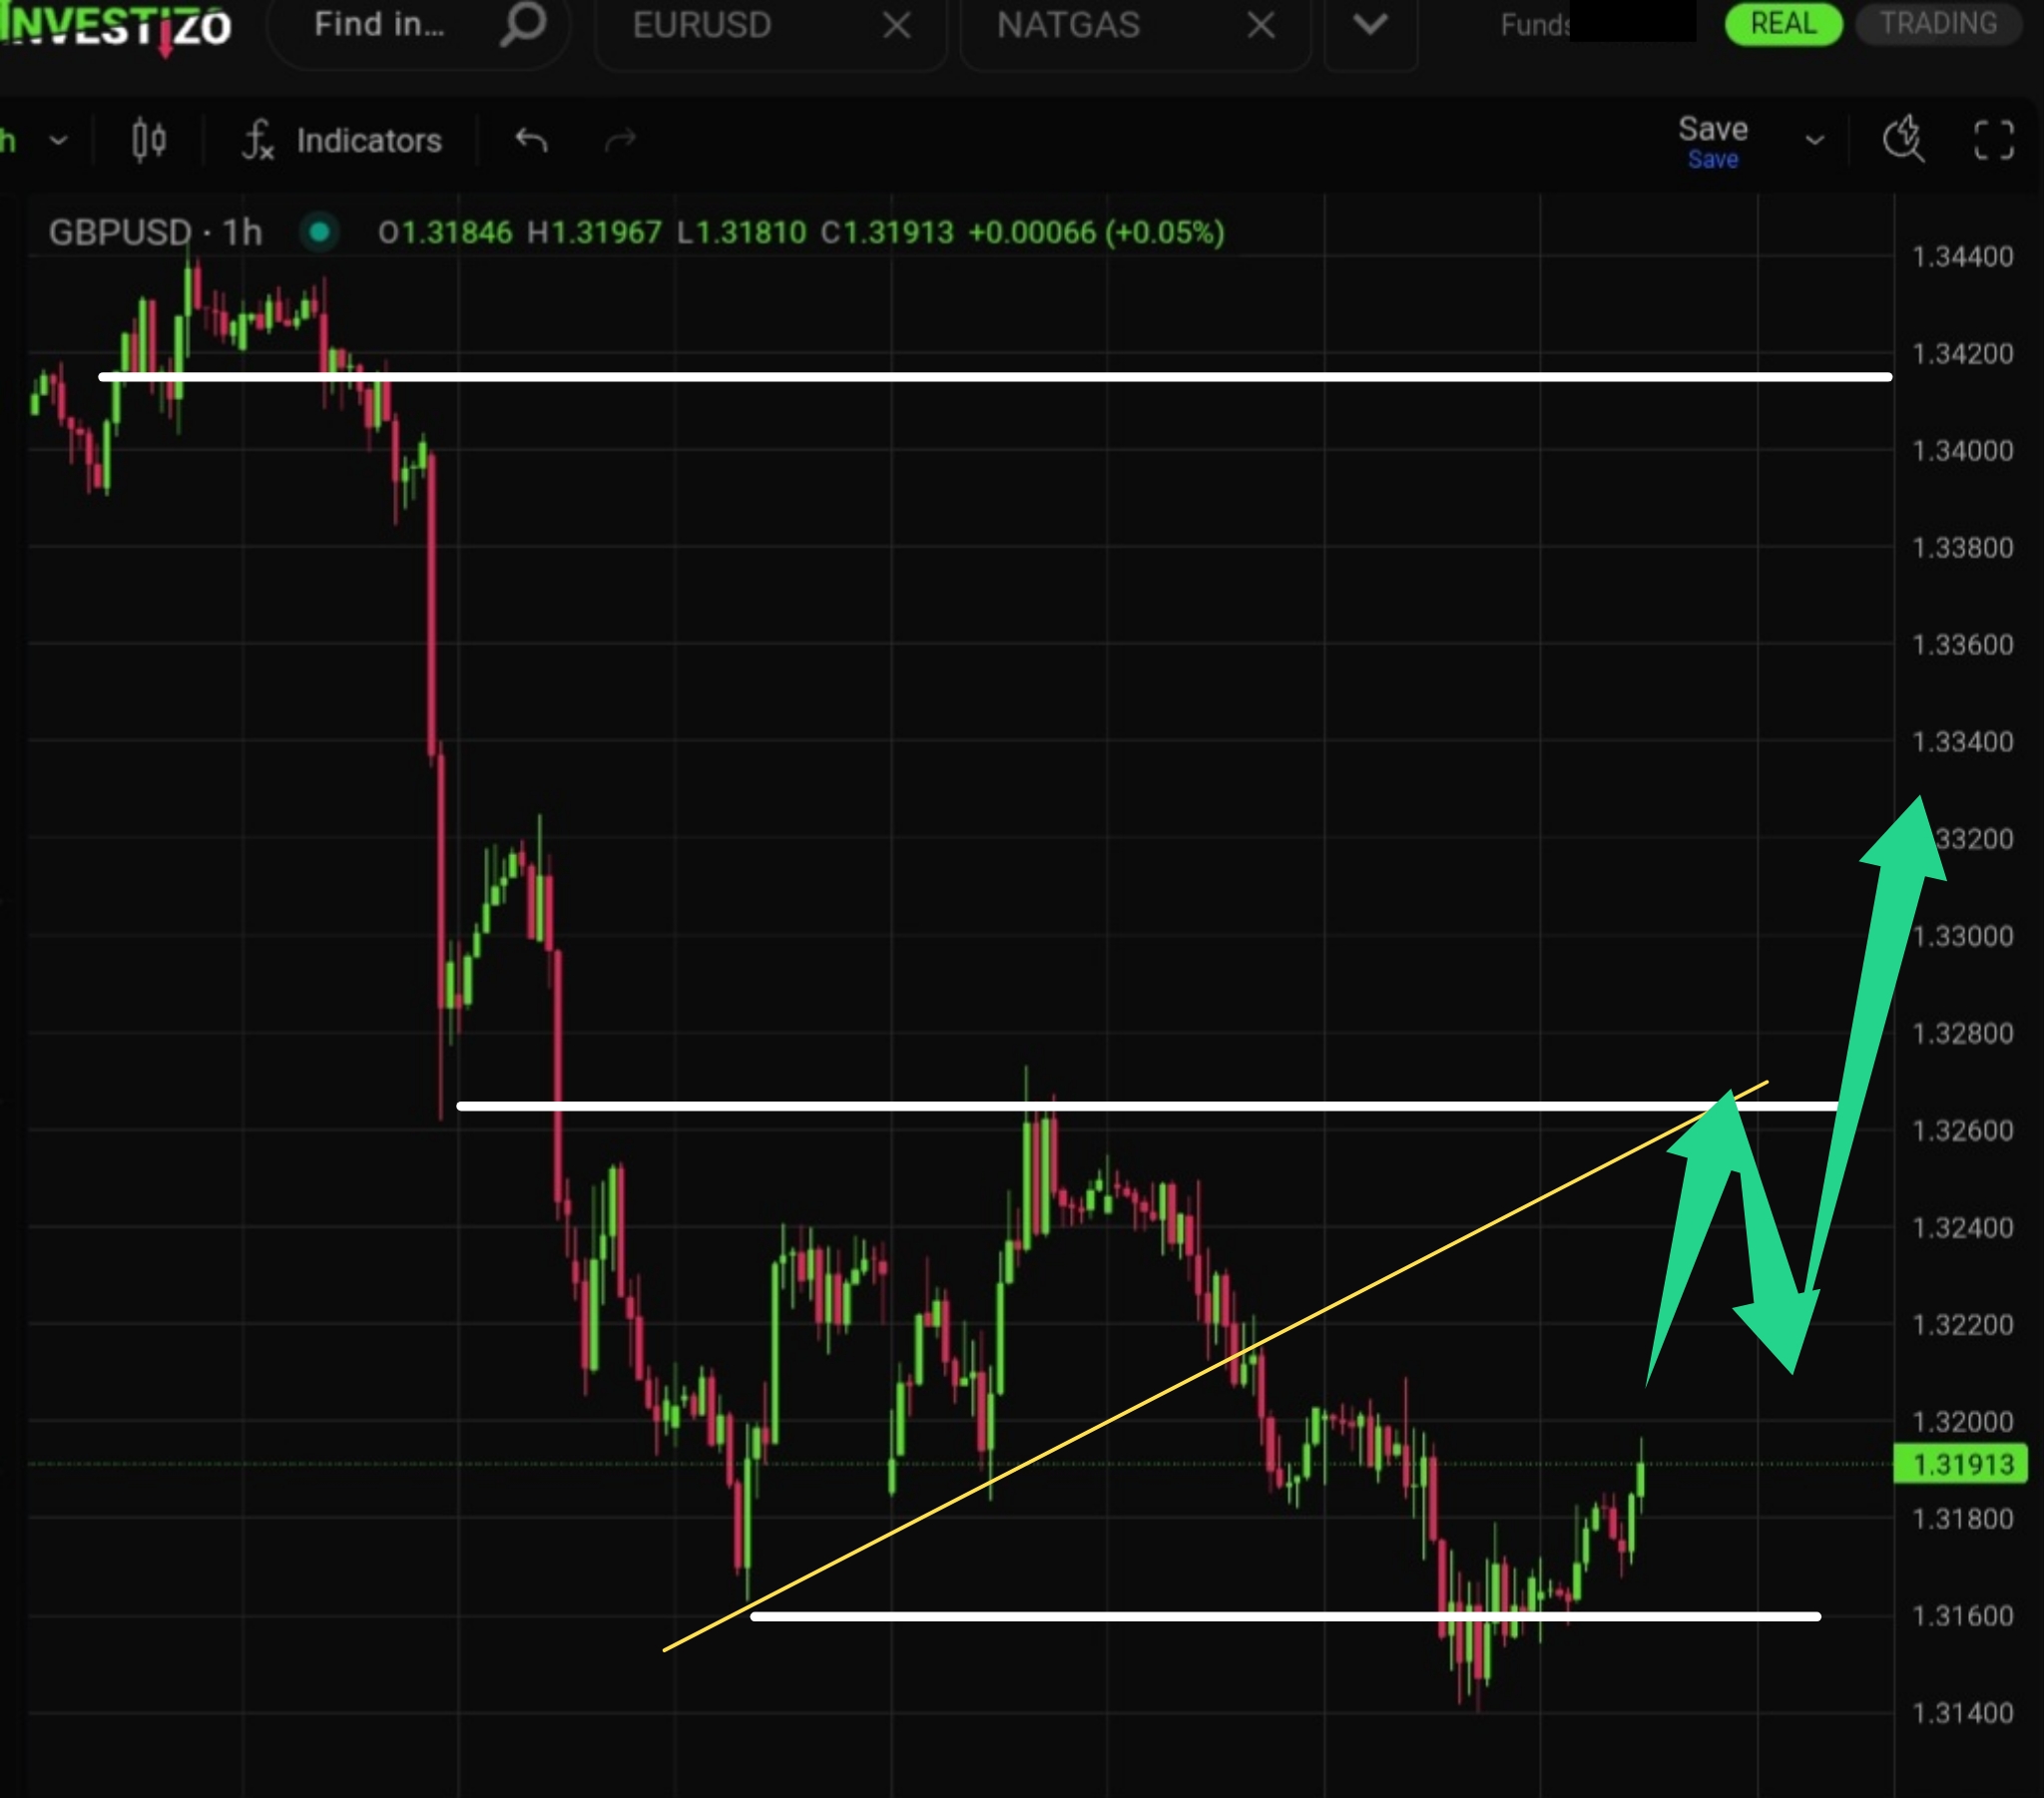
The pair is developing a new upward trend swing. A recovery toward the 1.3400–1.3410 area can be expected.
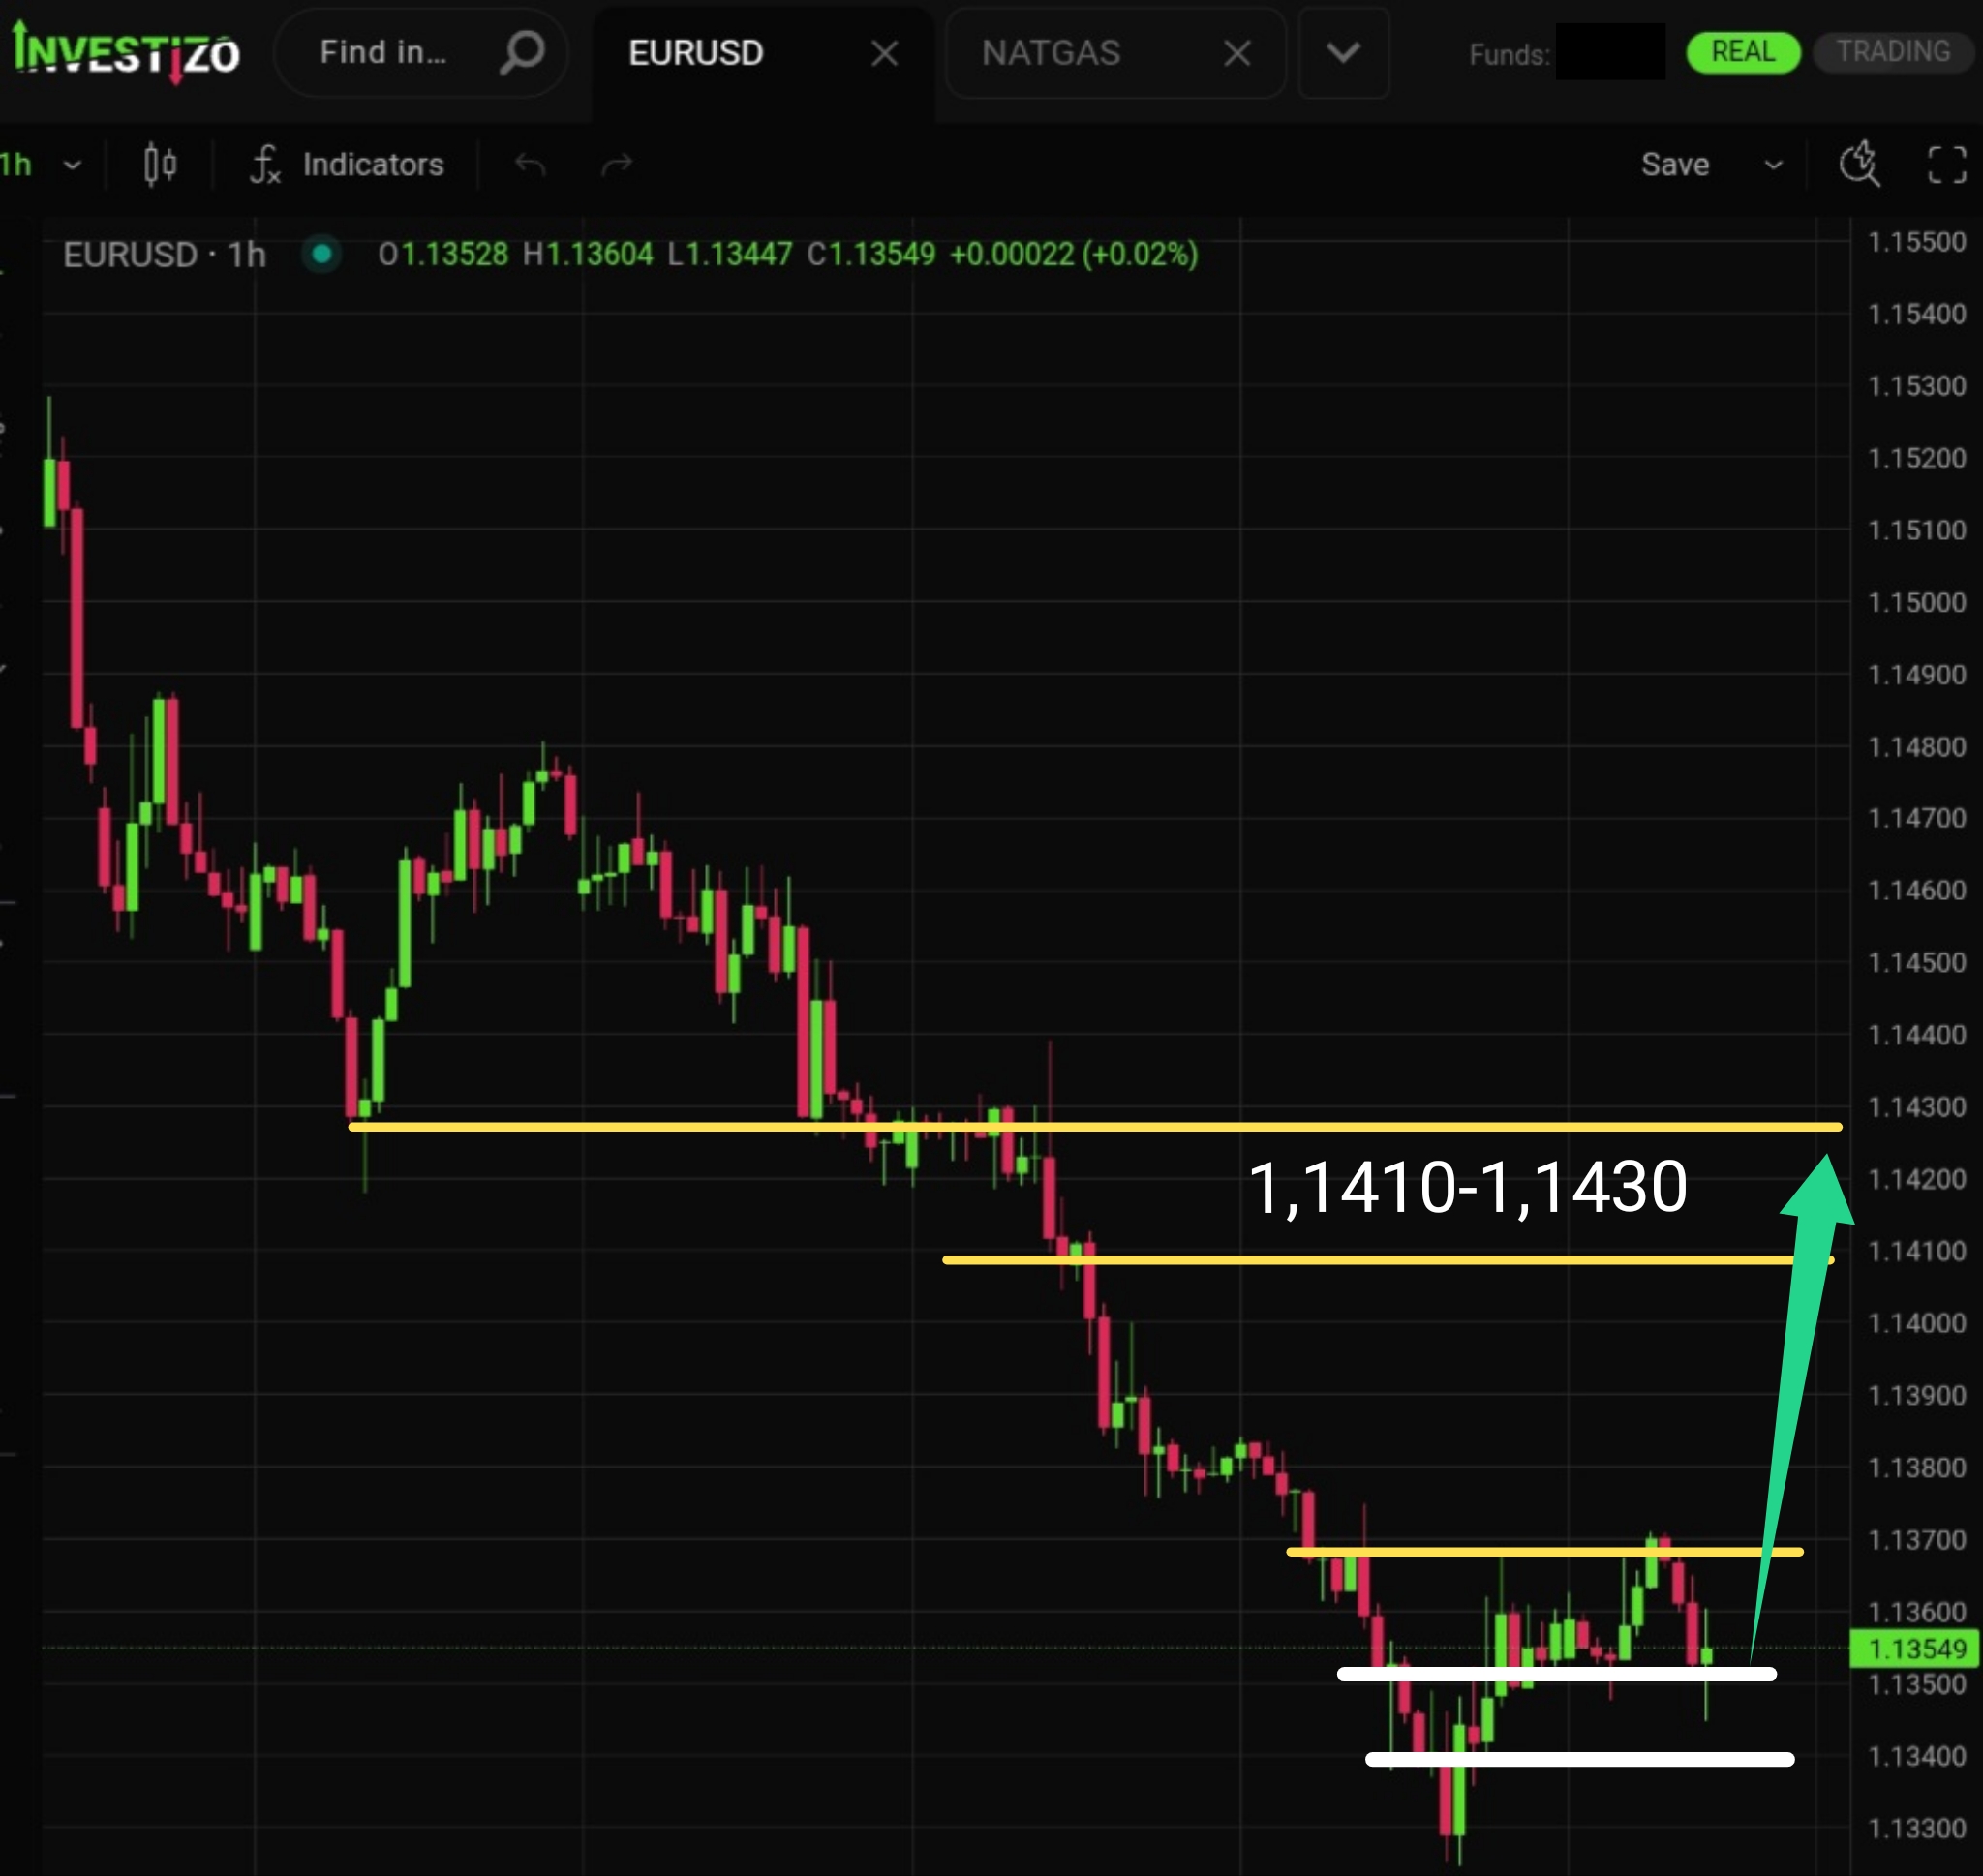
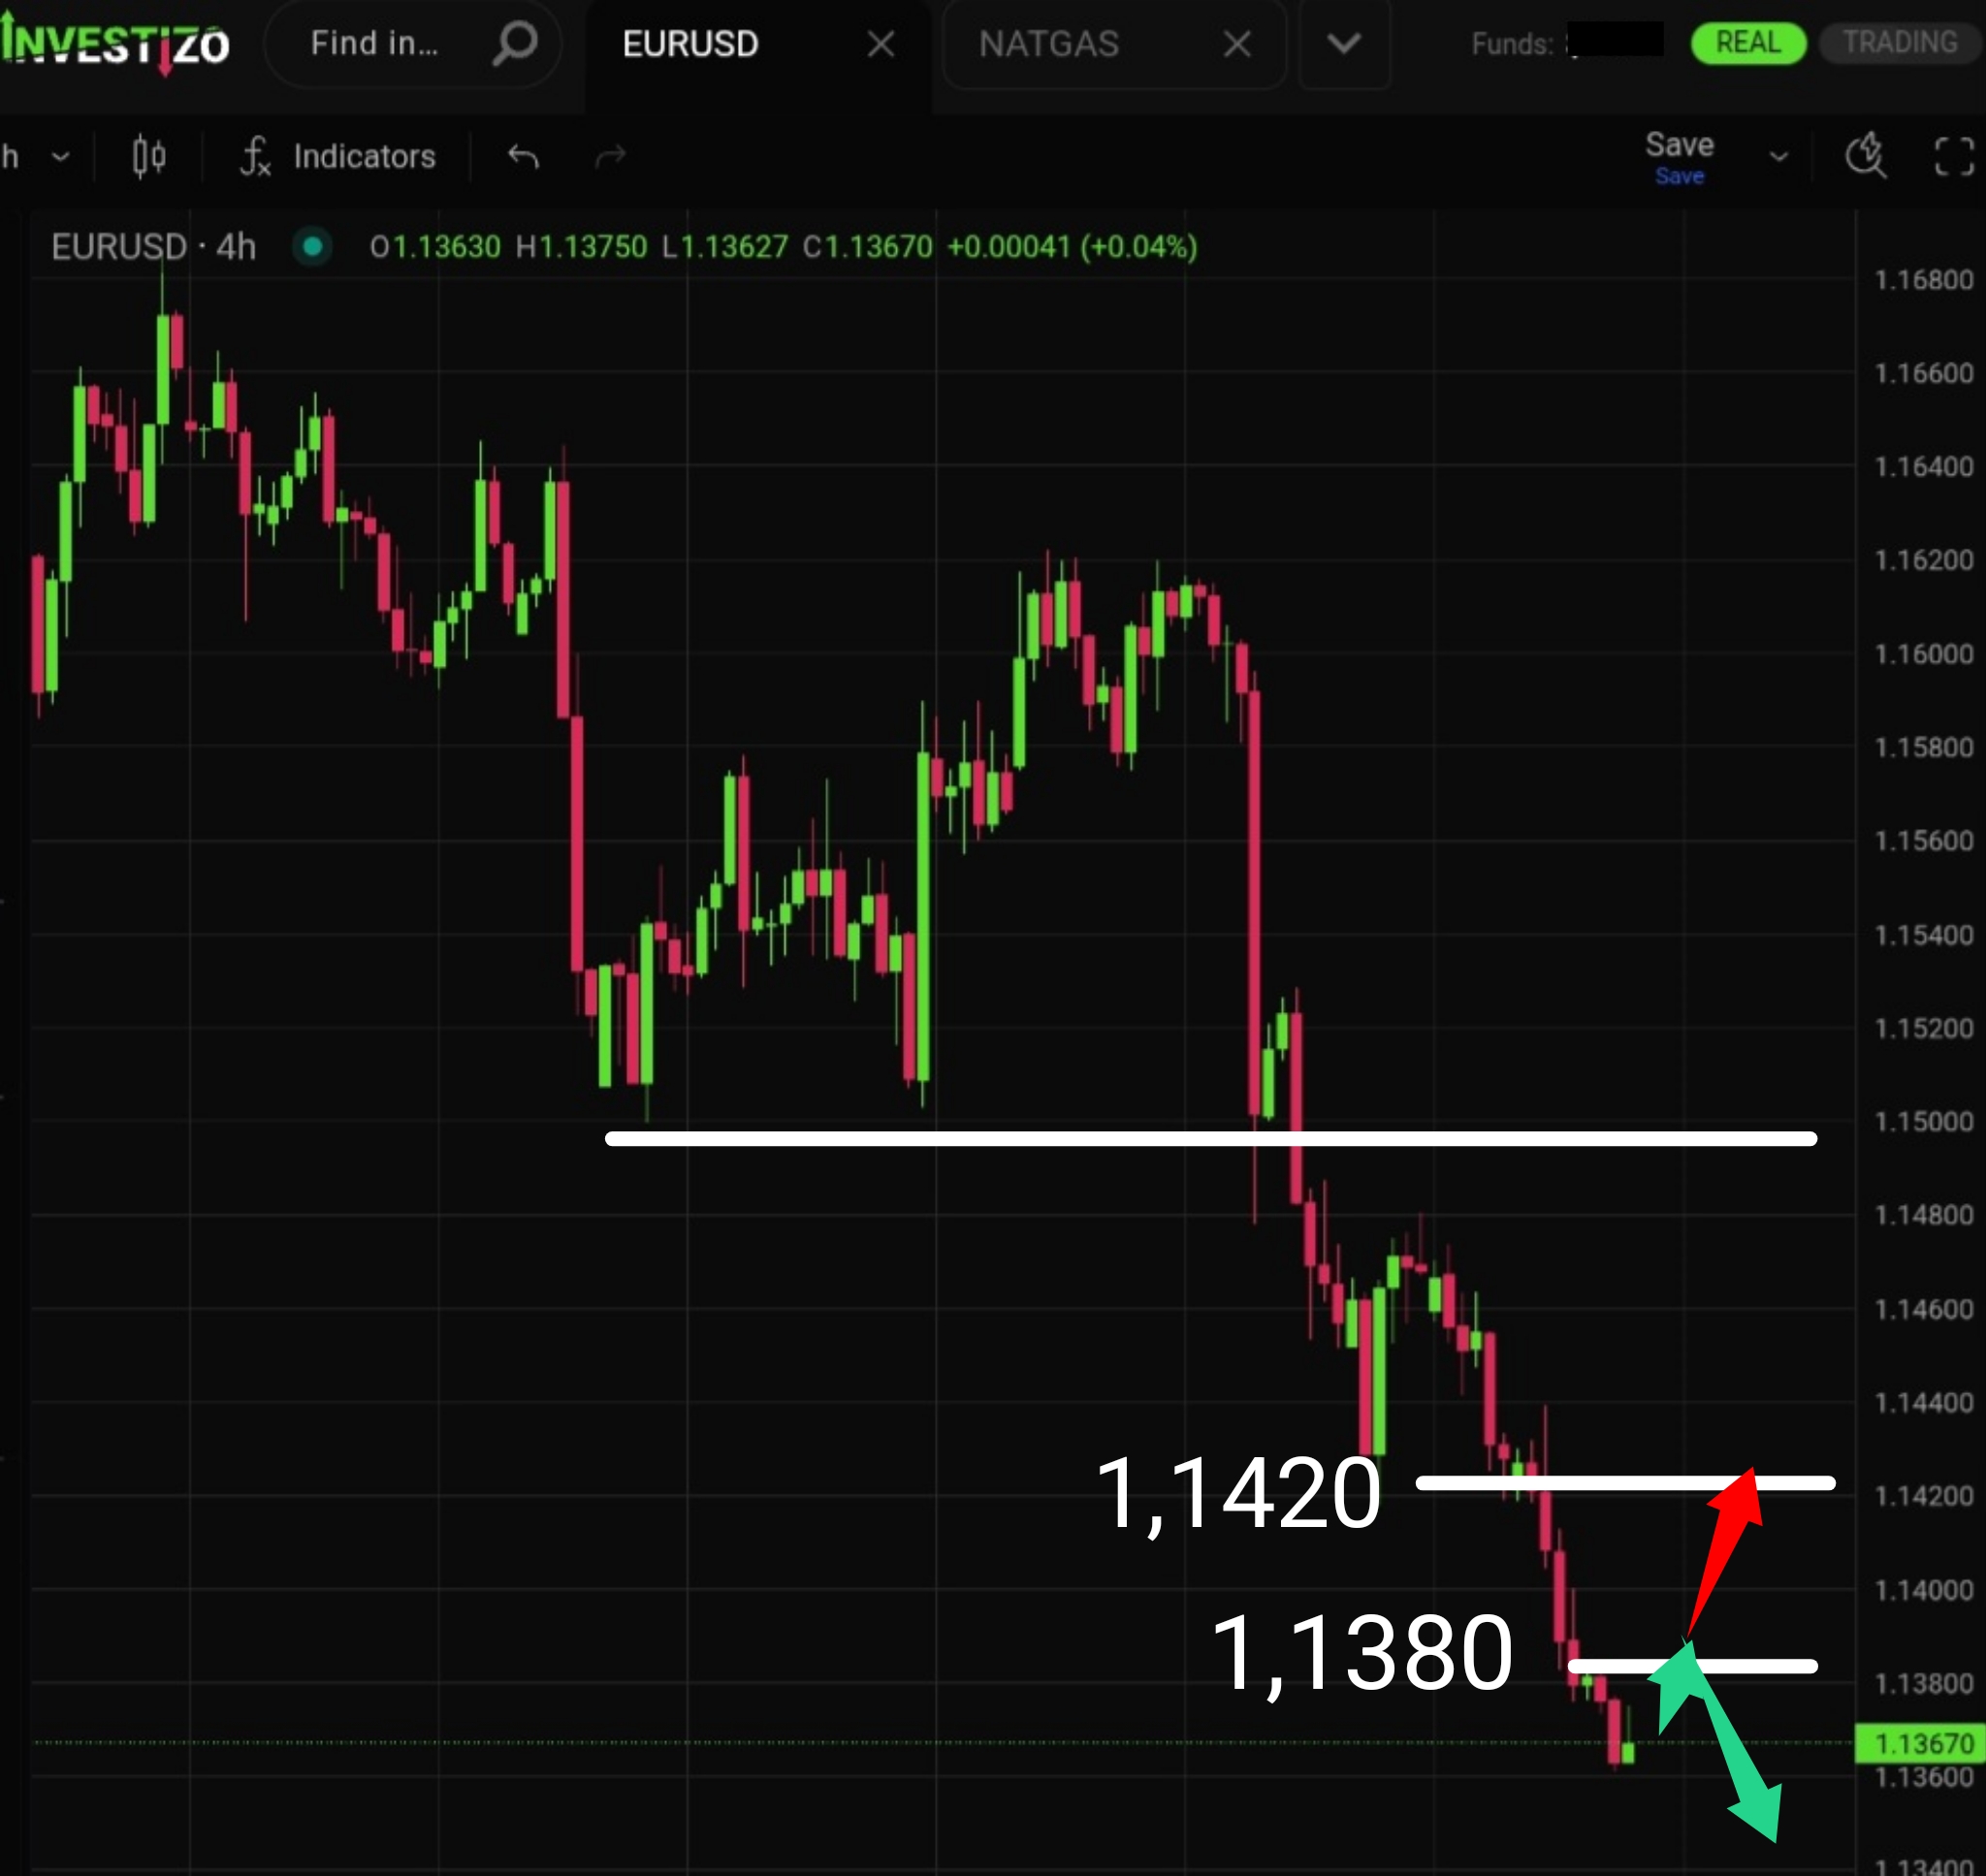
A clear upward reversal has formed, with prospects for a dynamic euro recovery toward the 1.1410–1.1430 area.
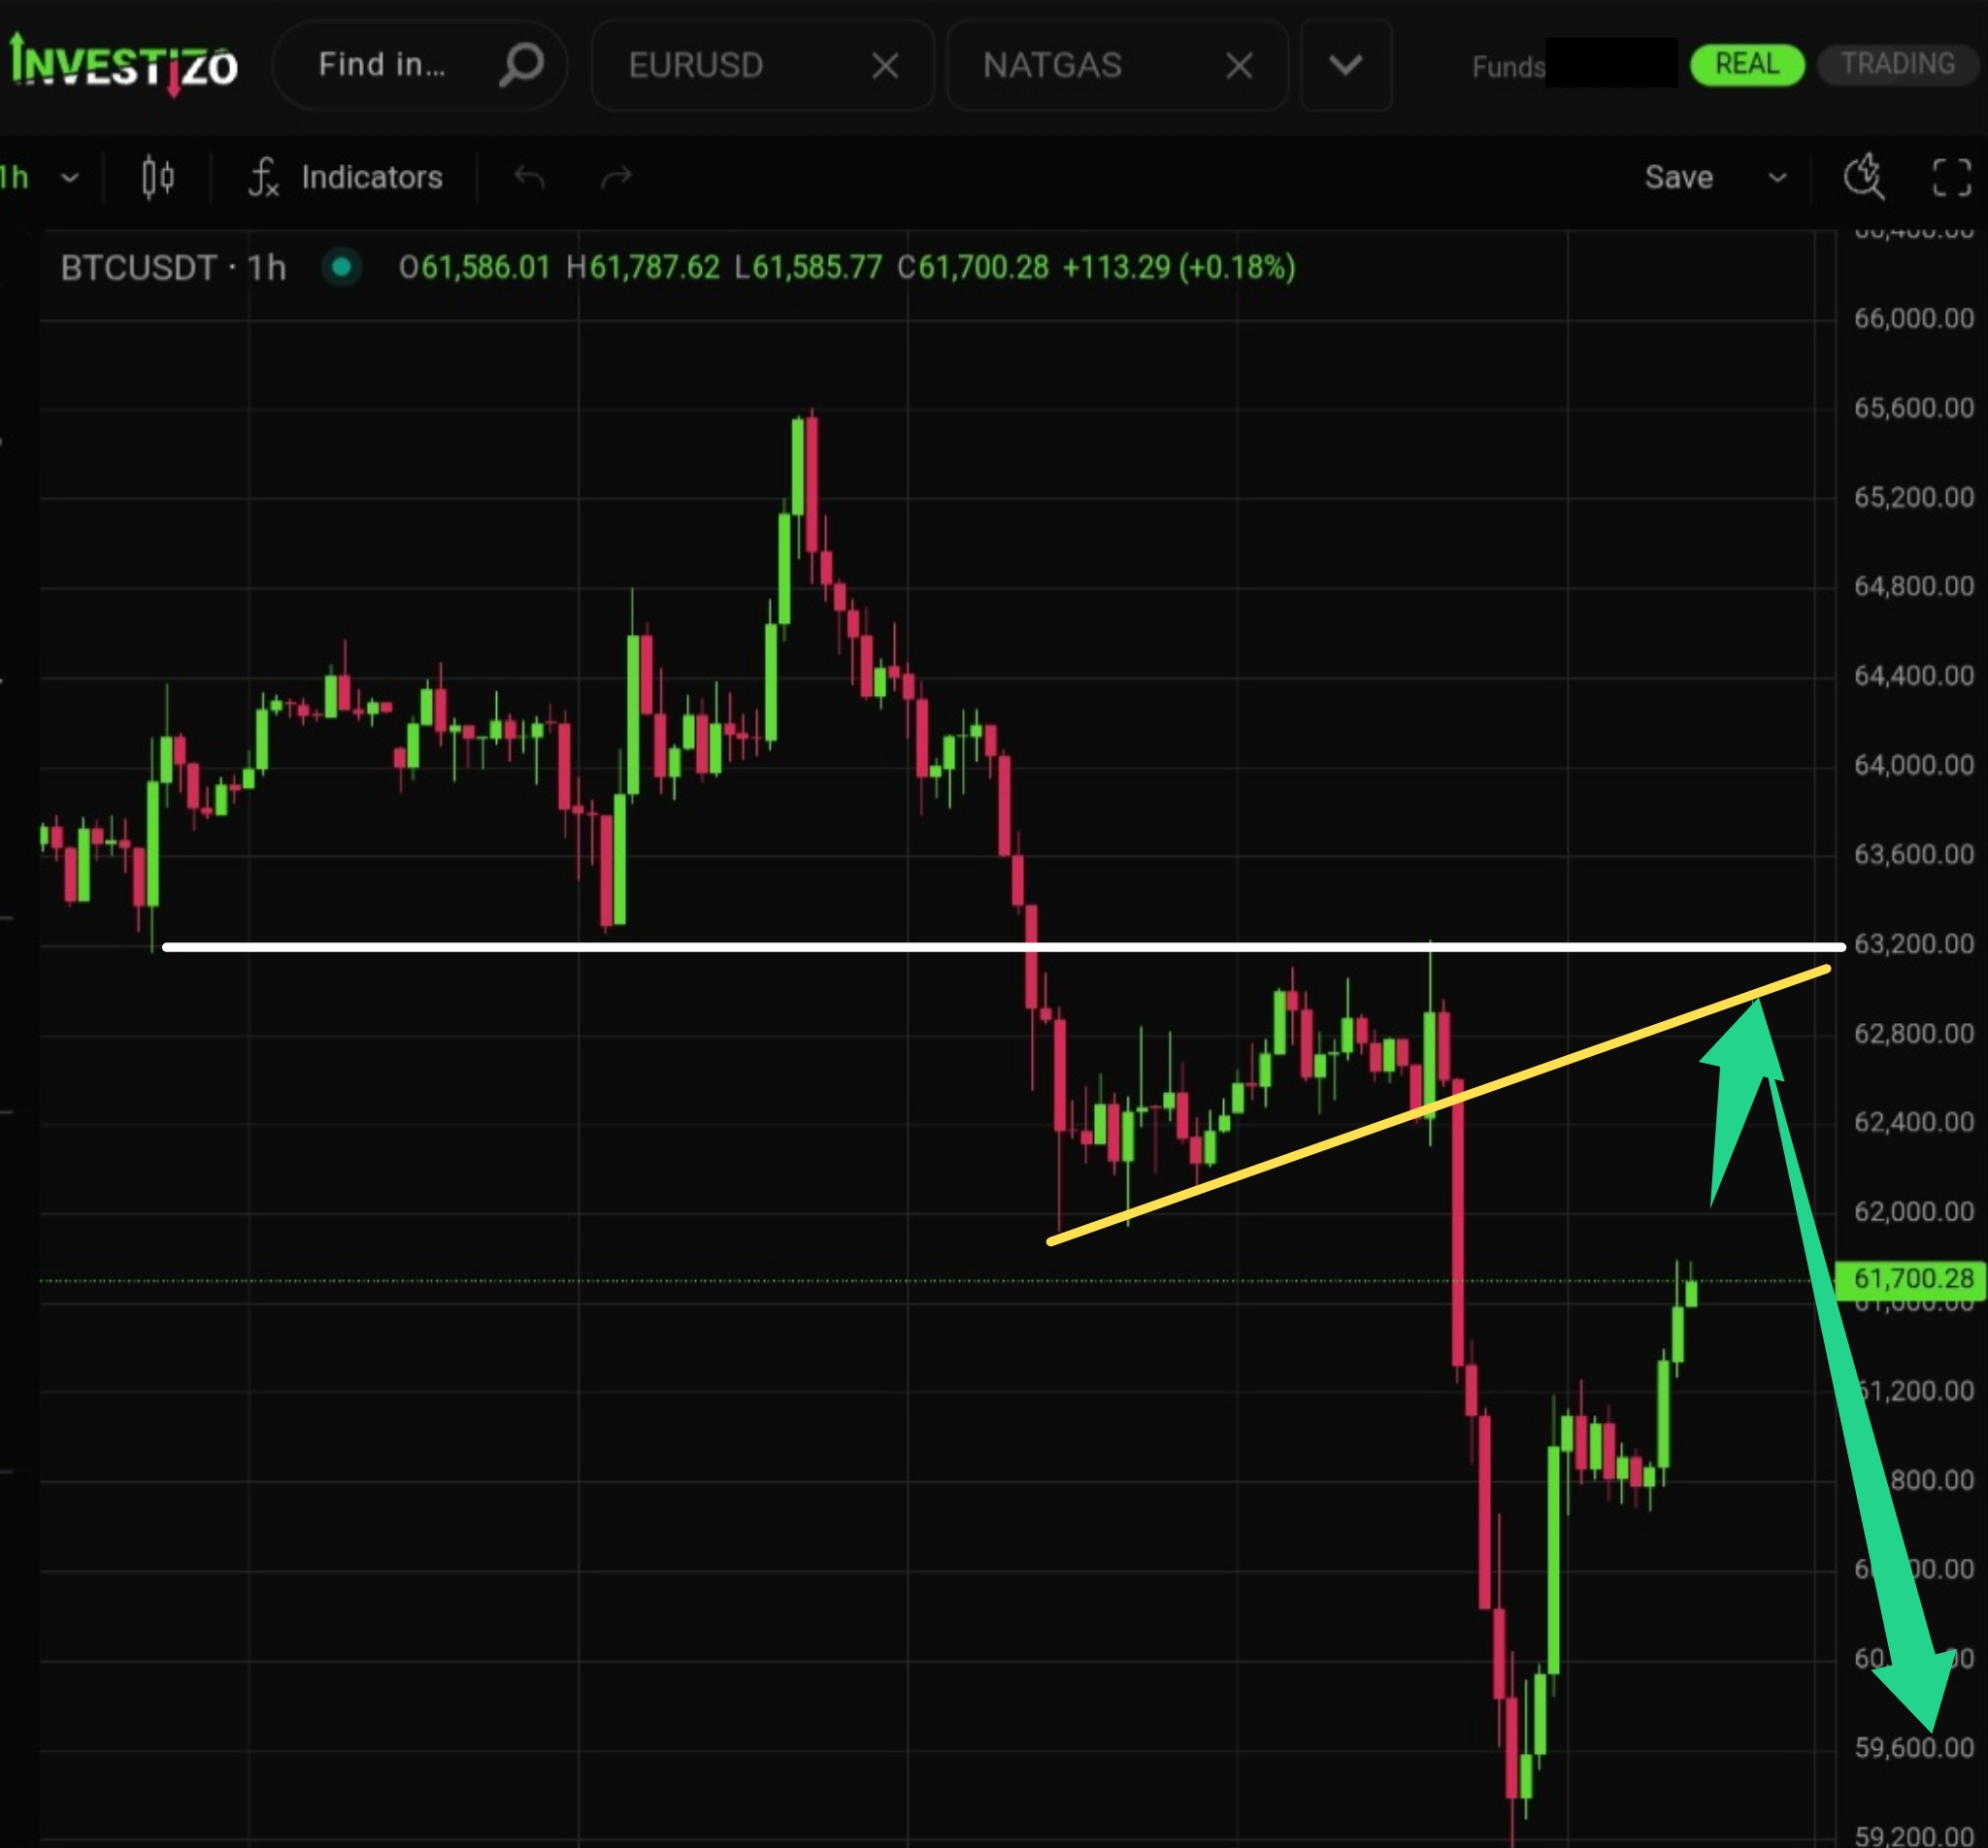
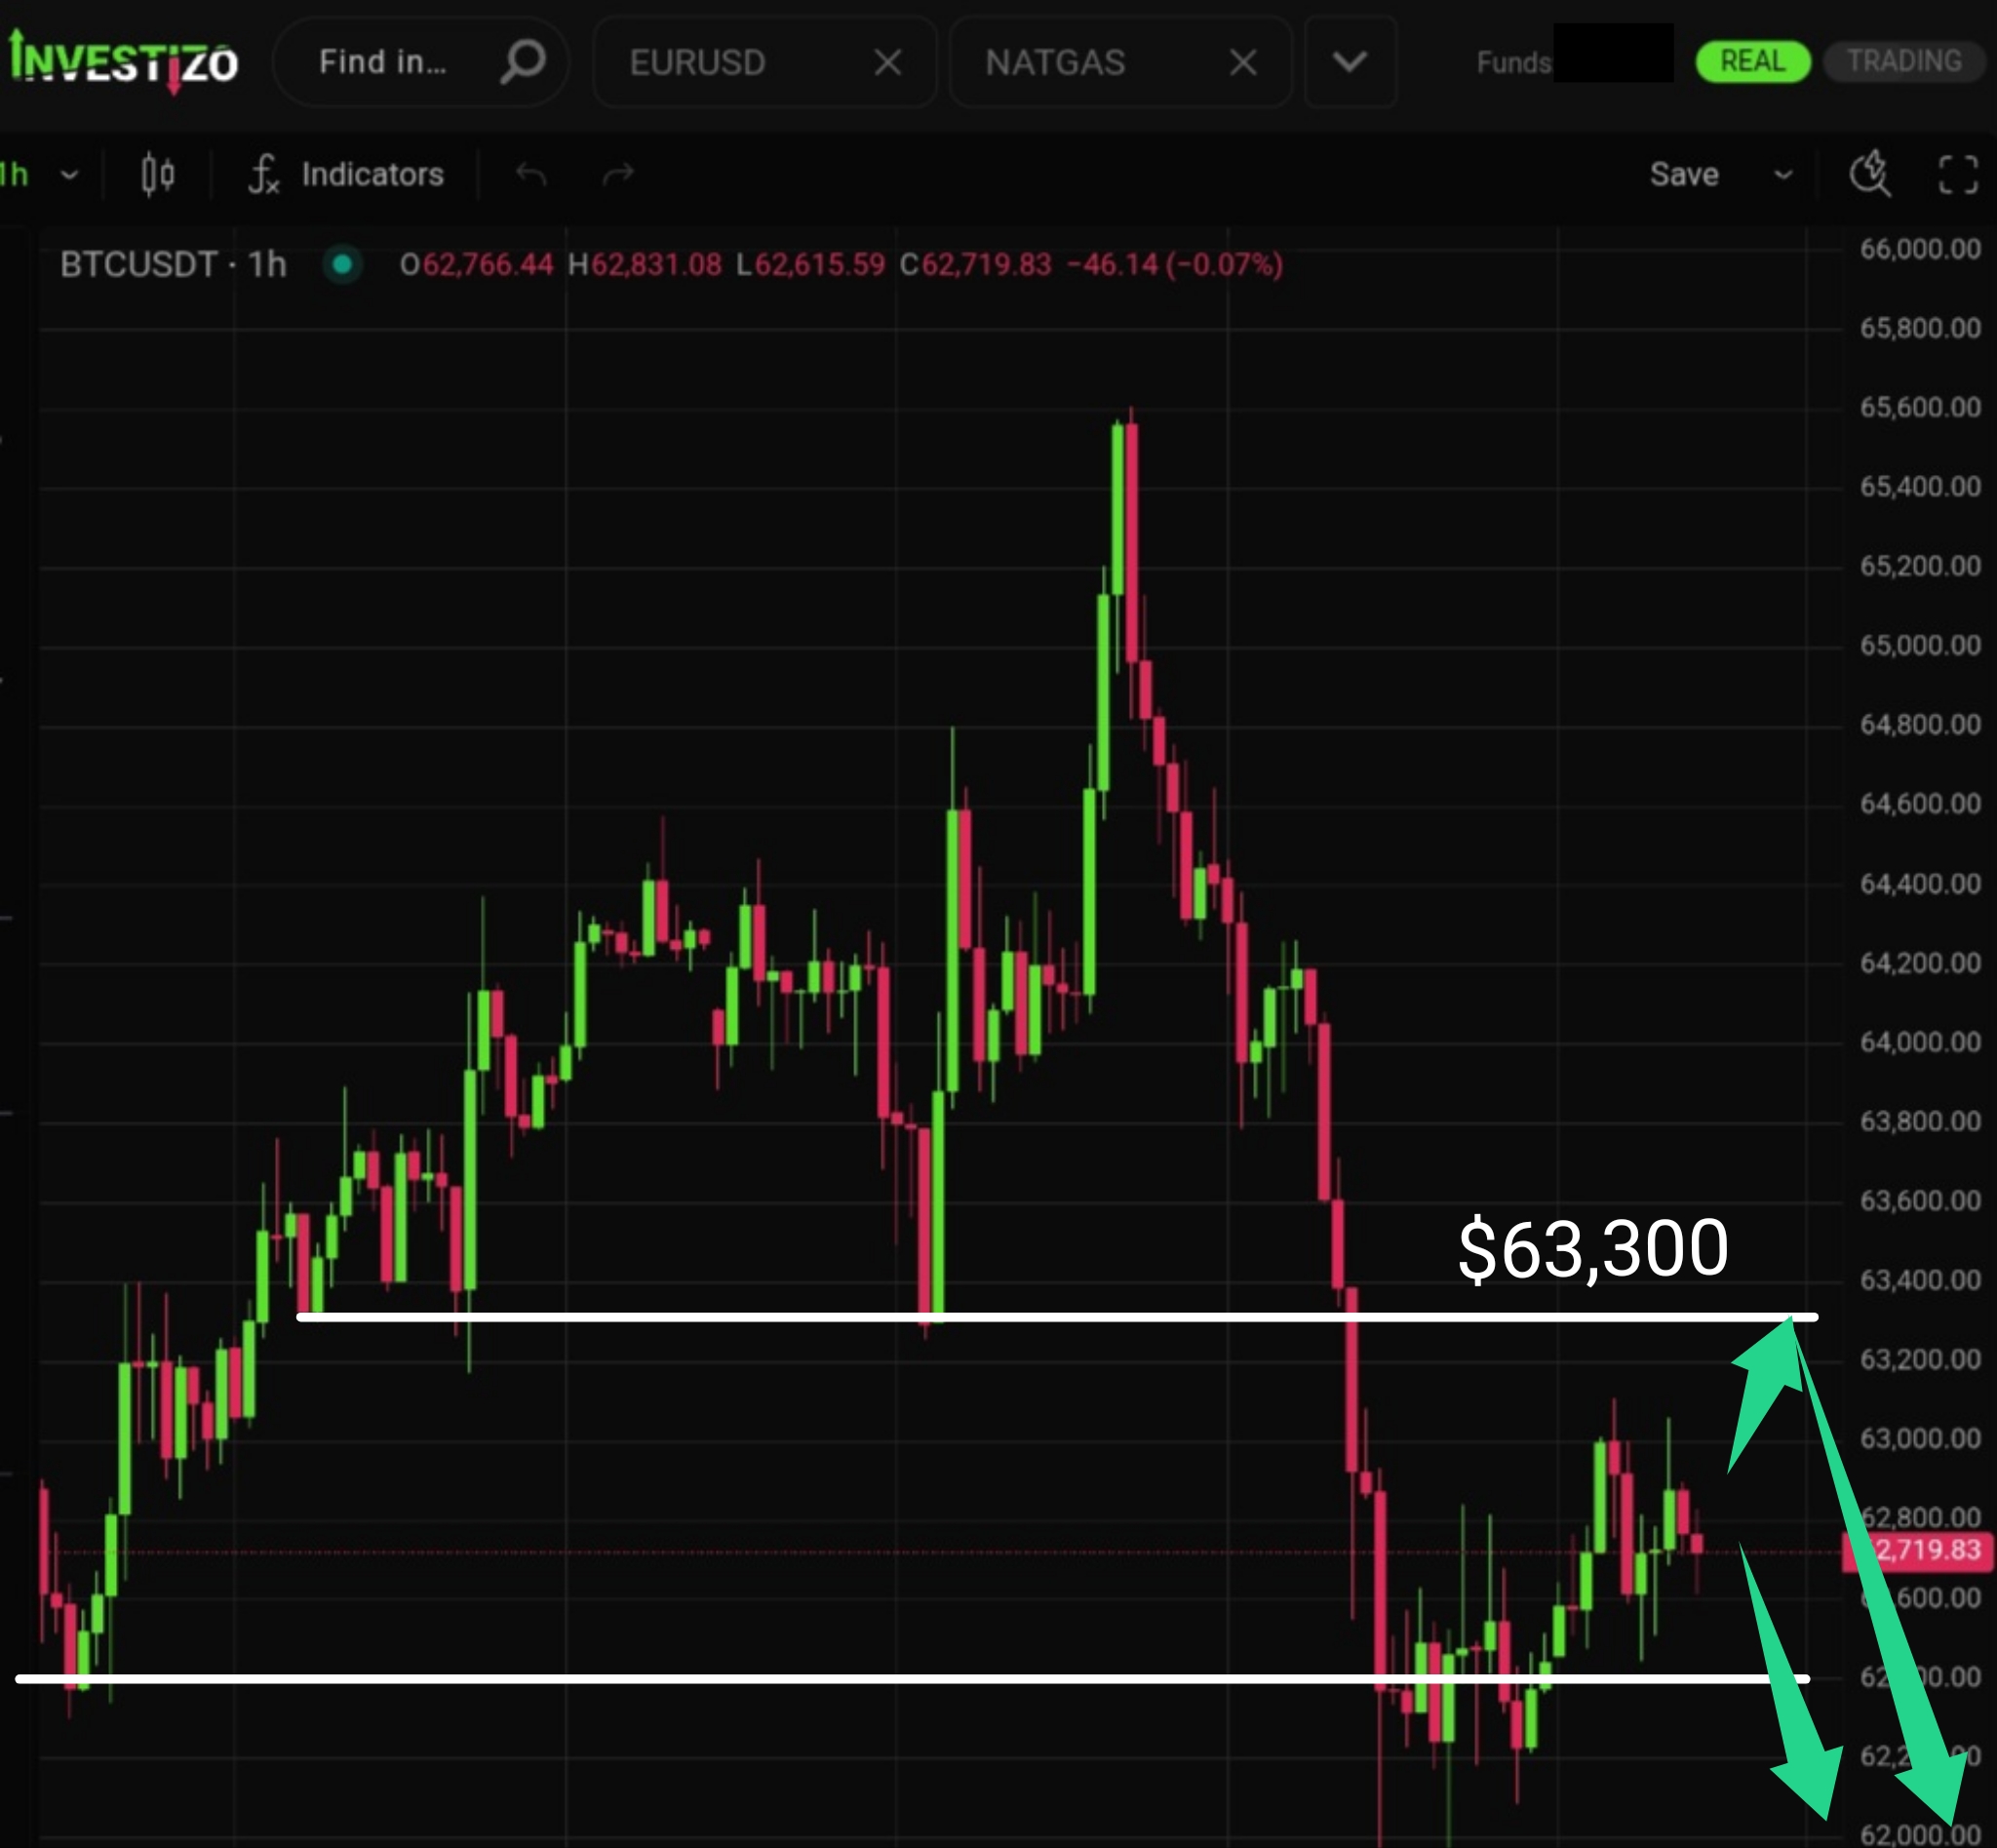
The market has refreshed its local low below the key psychological level of $60,000 and subsequently began the traditional squeeze of late short-sellers.
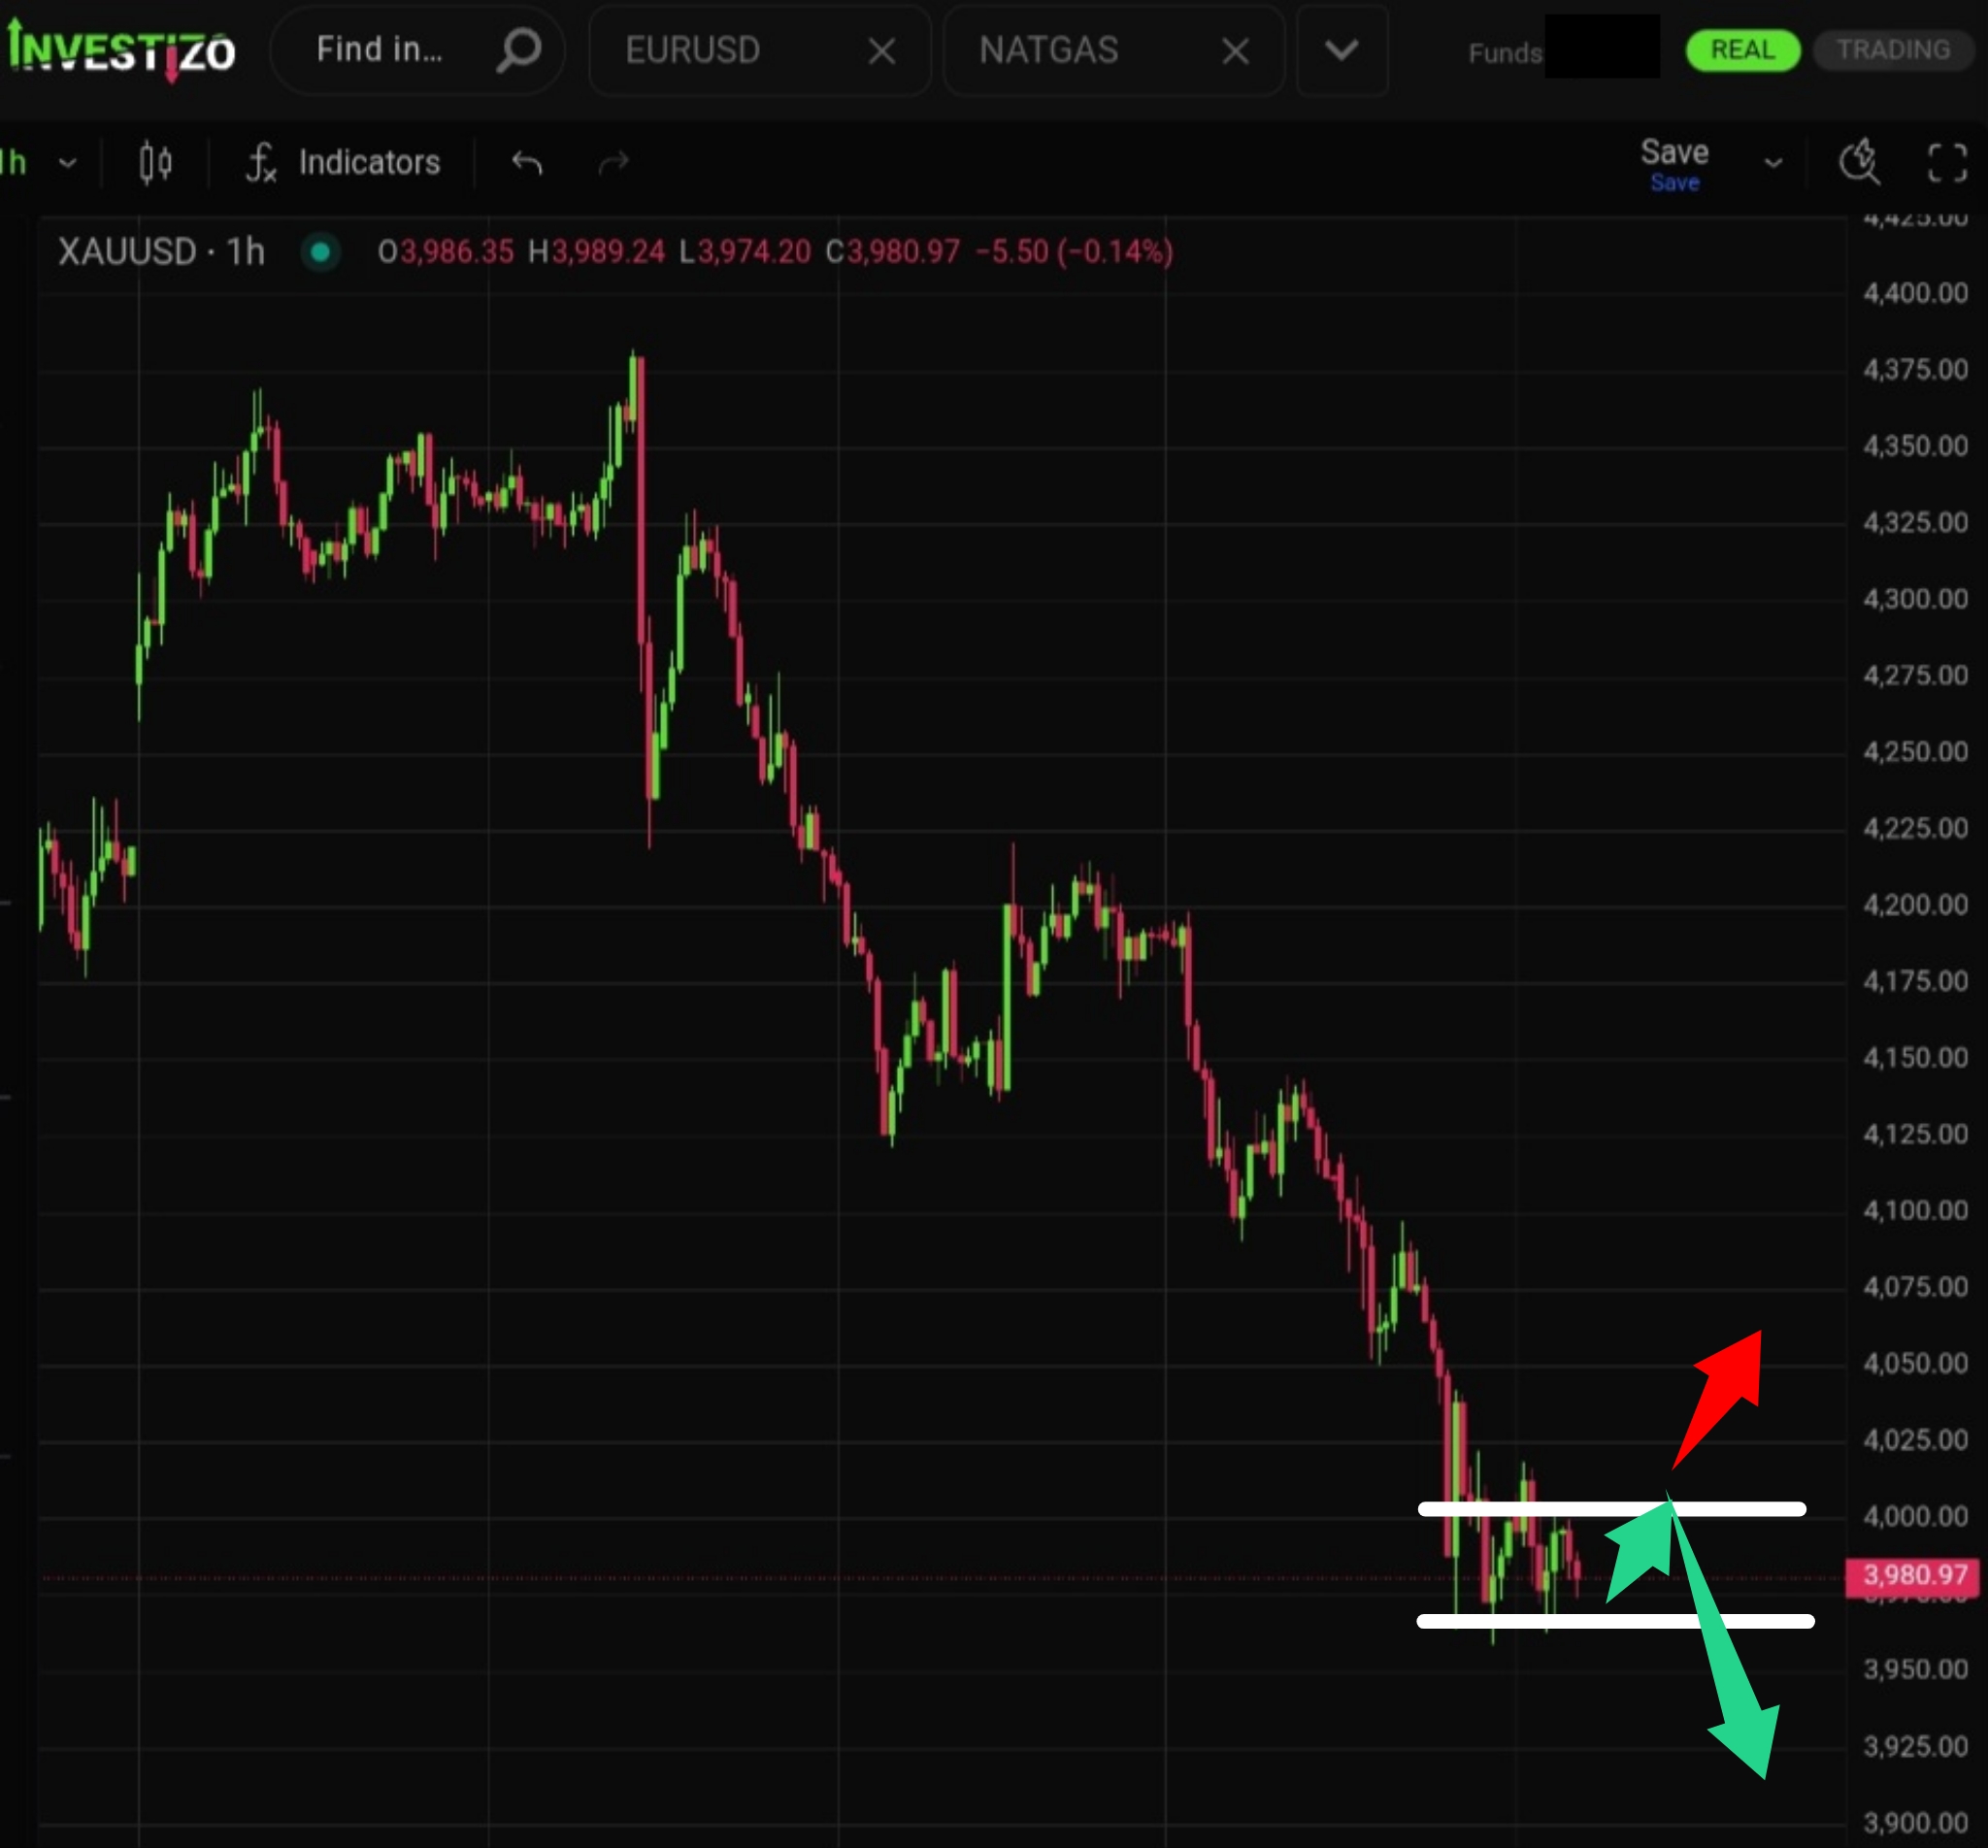
Spot gold has broken below the critical psychological threshold, currently trading down at $3,981 per ounce after a violent 3% liquidation in the previous session.
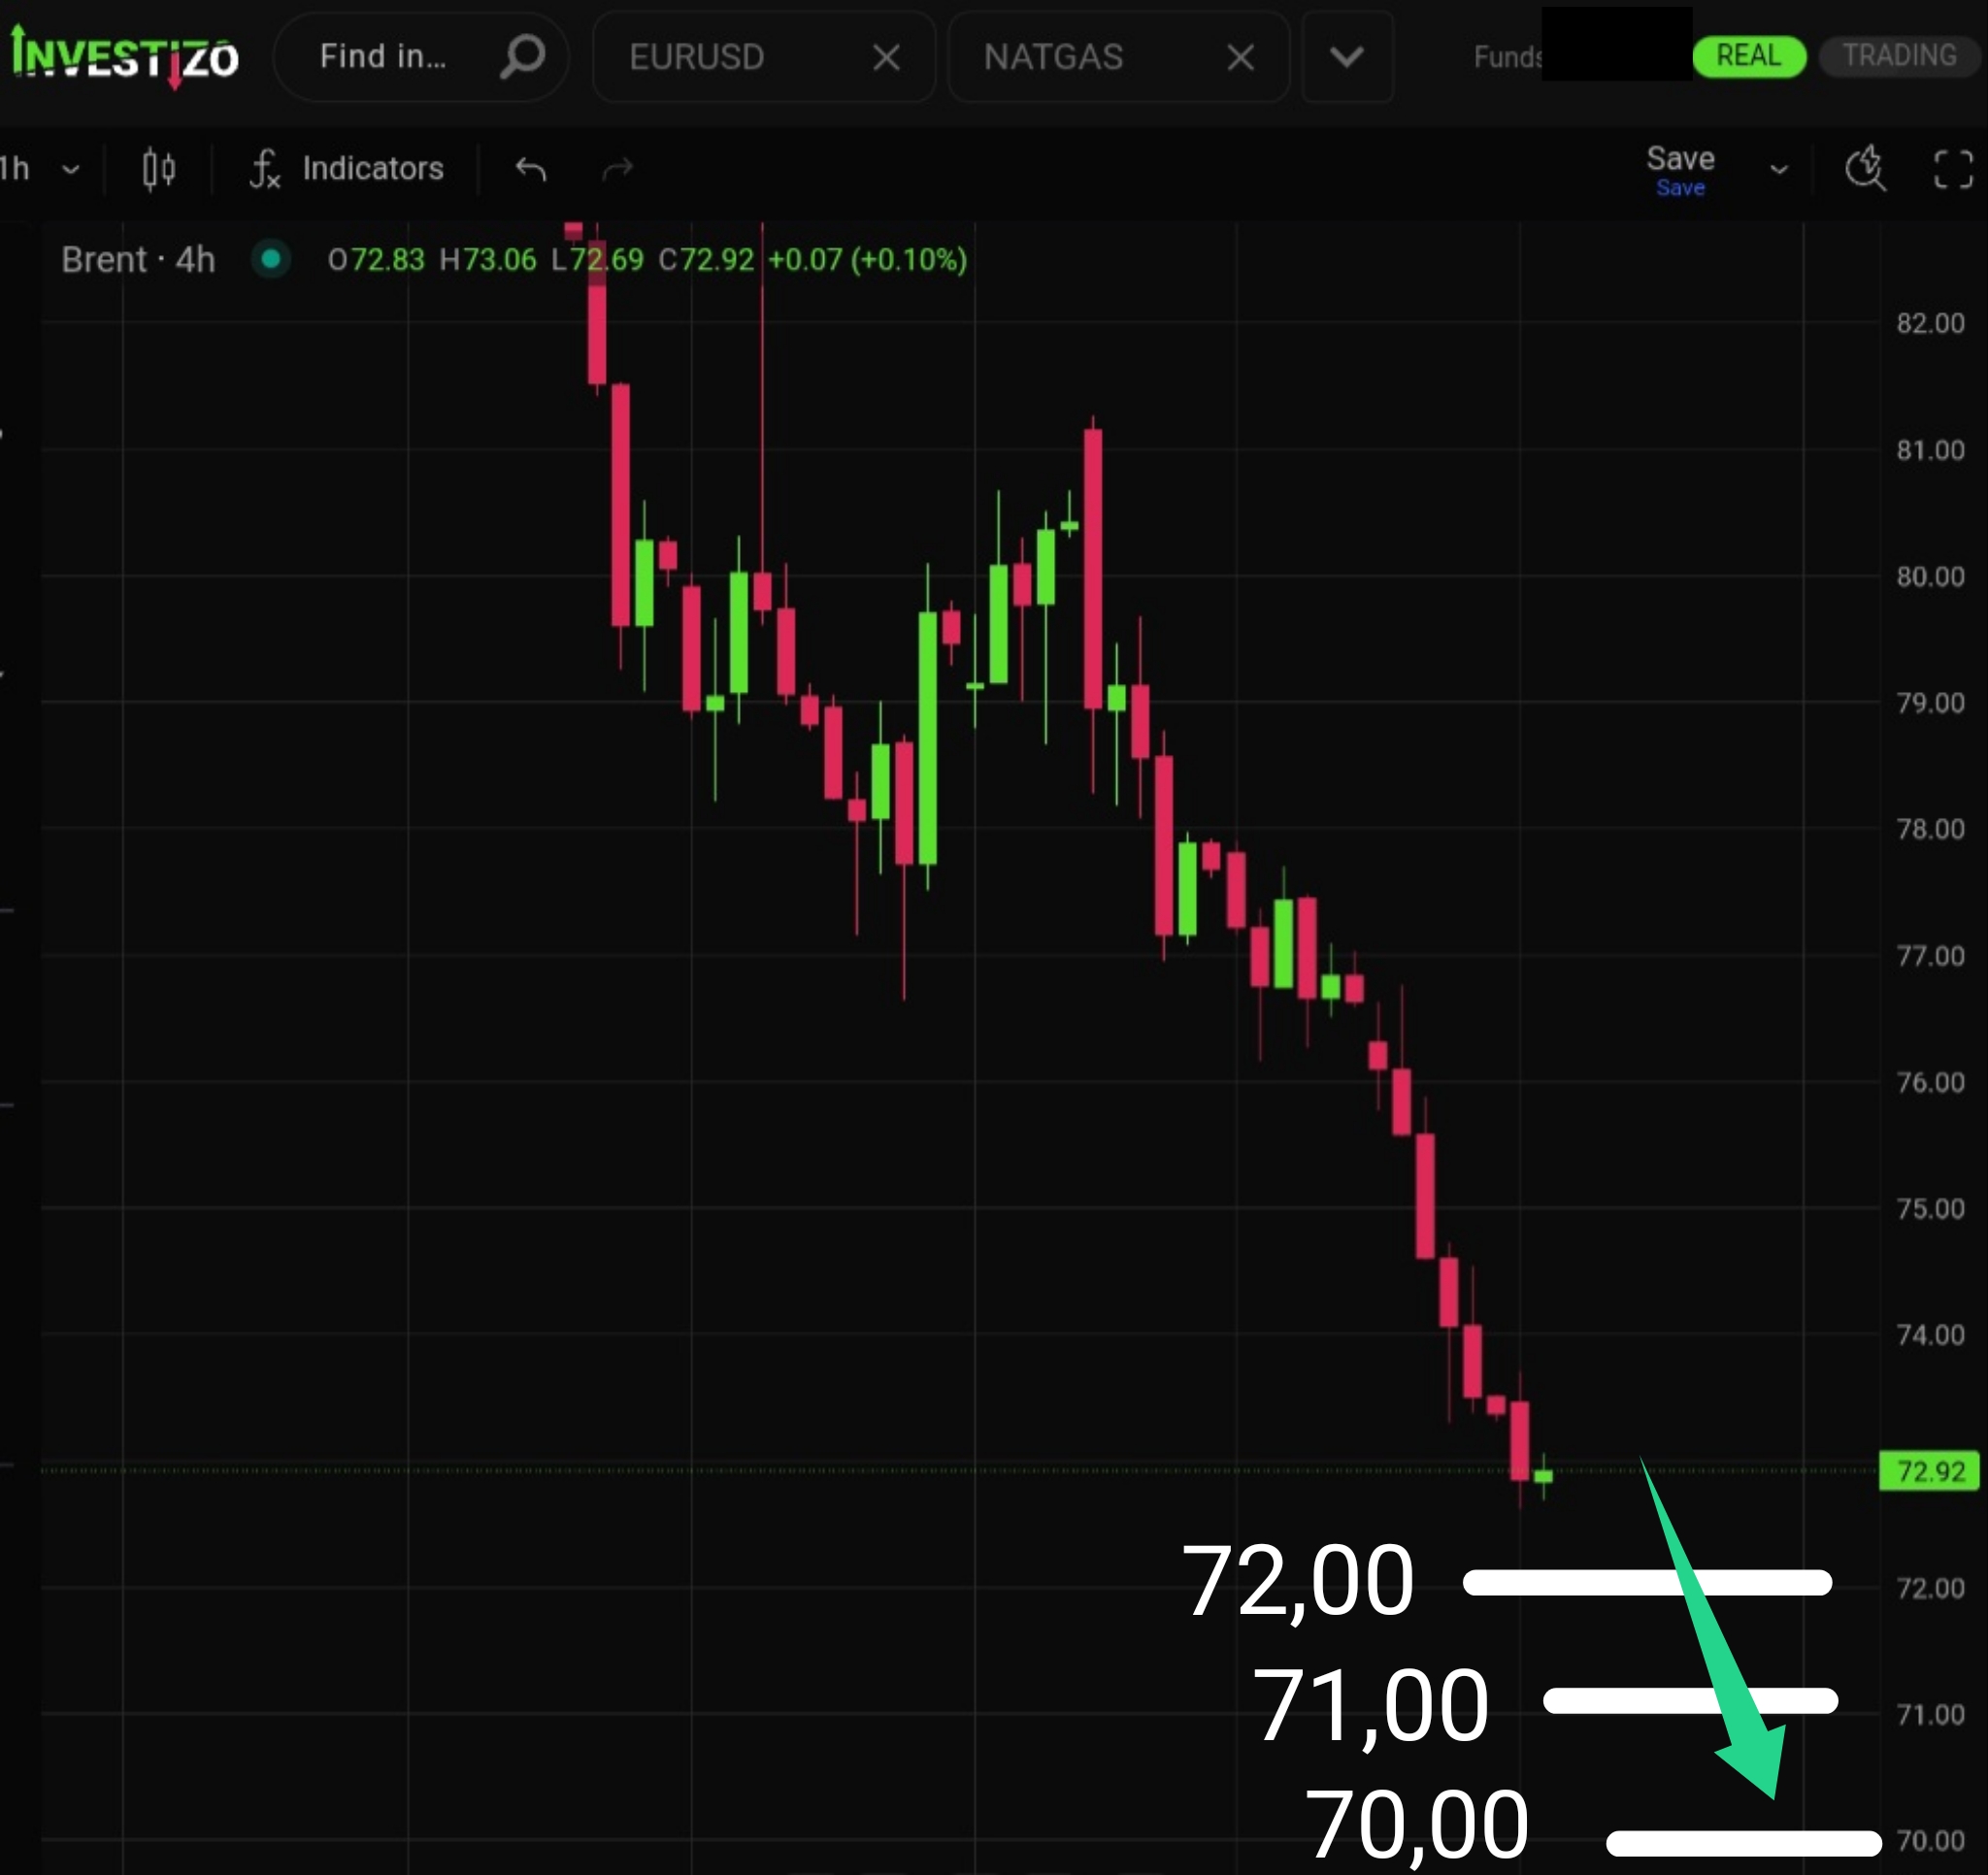
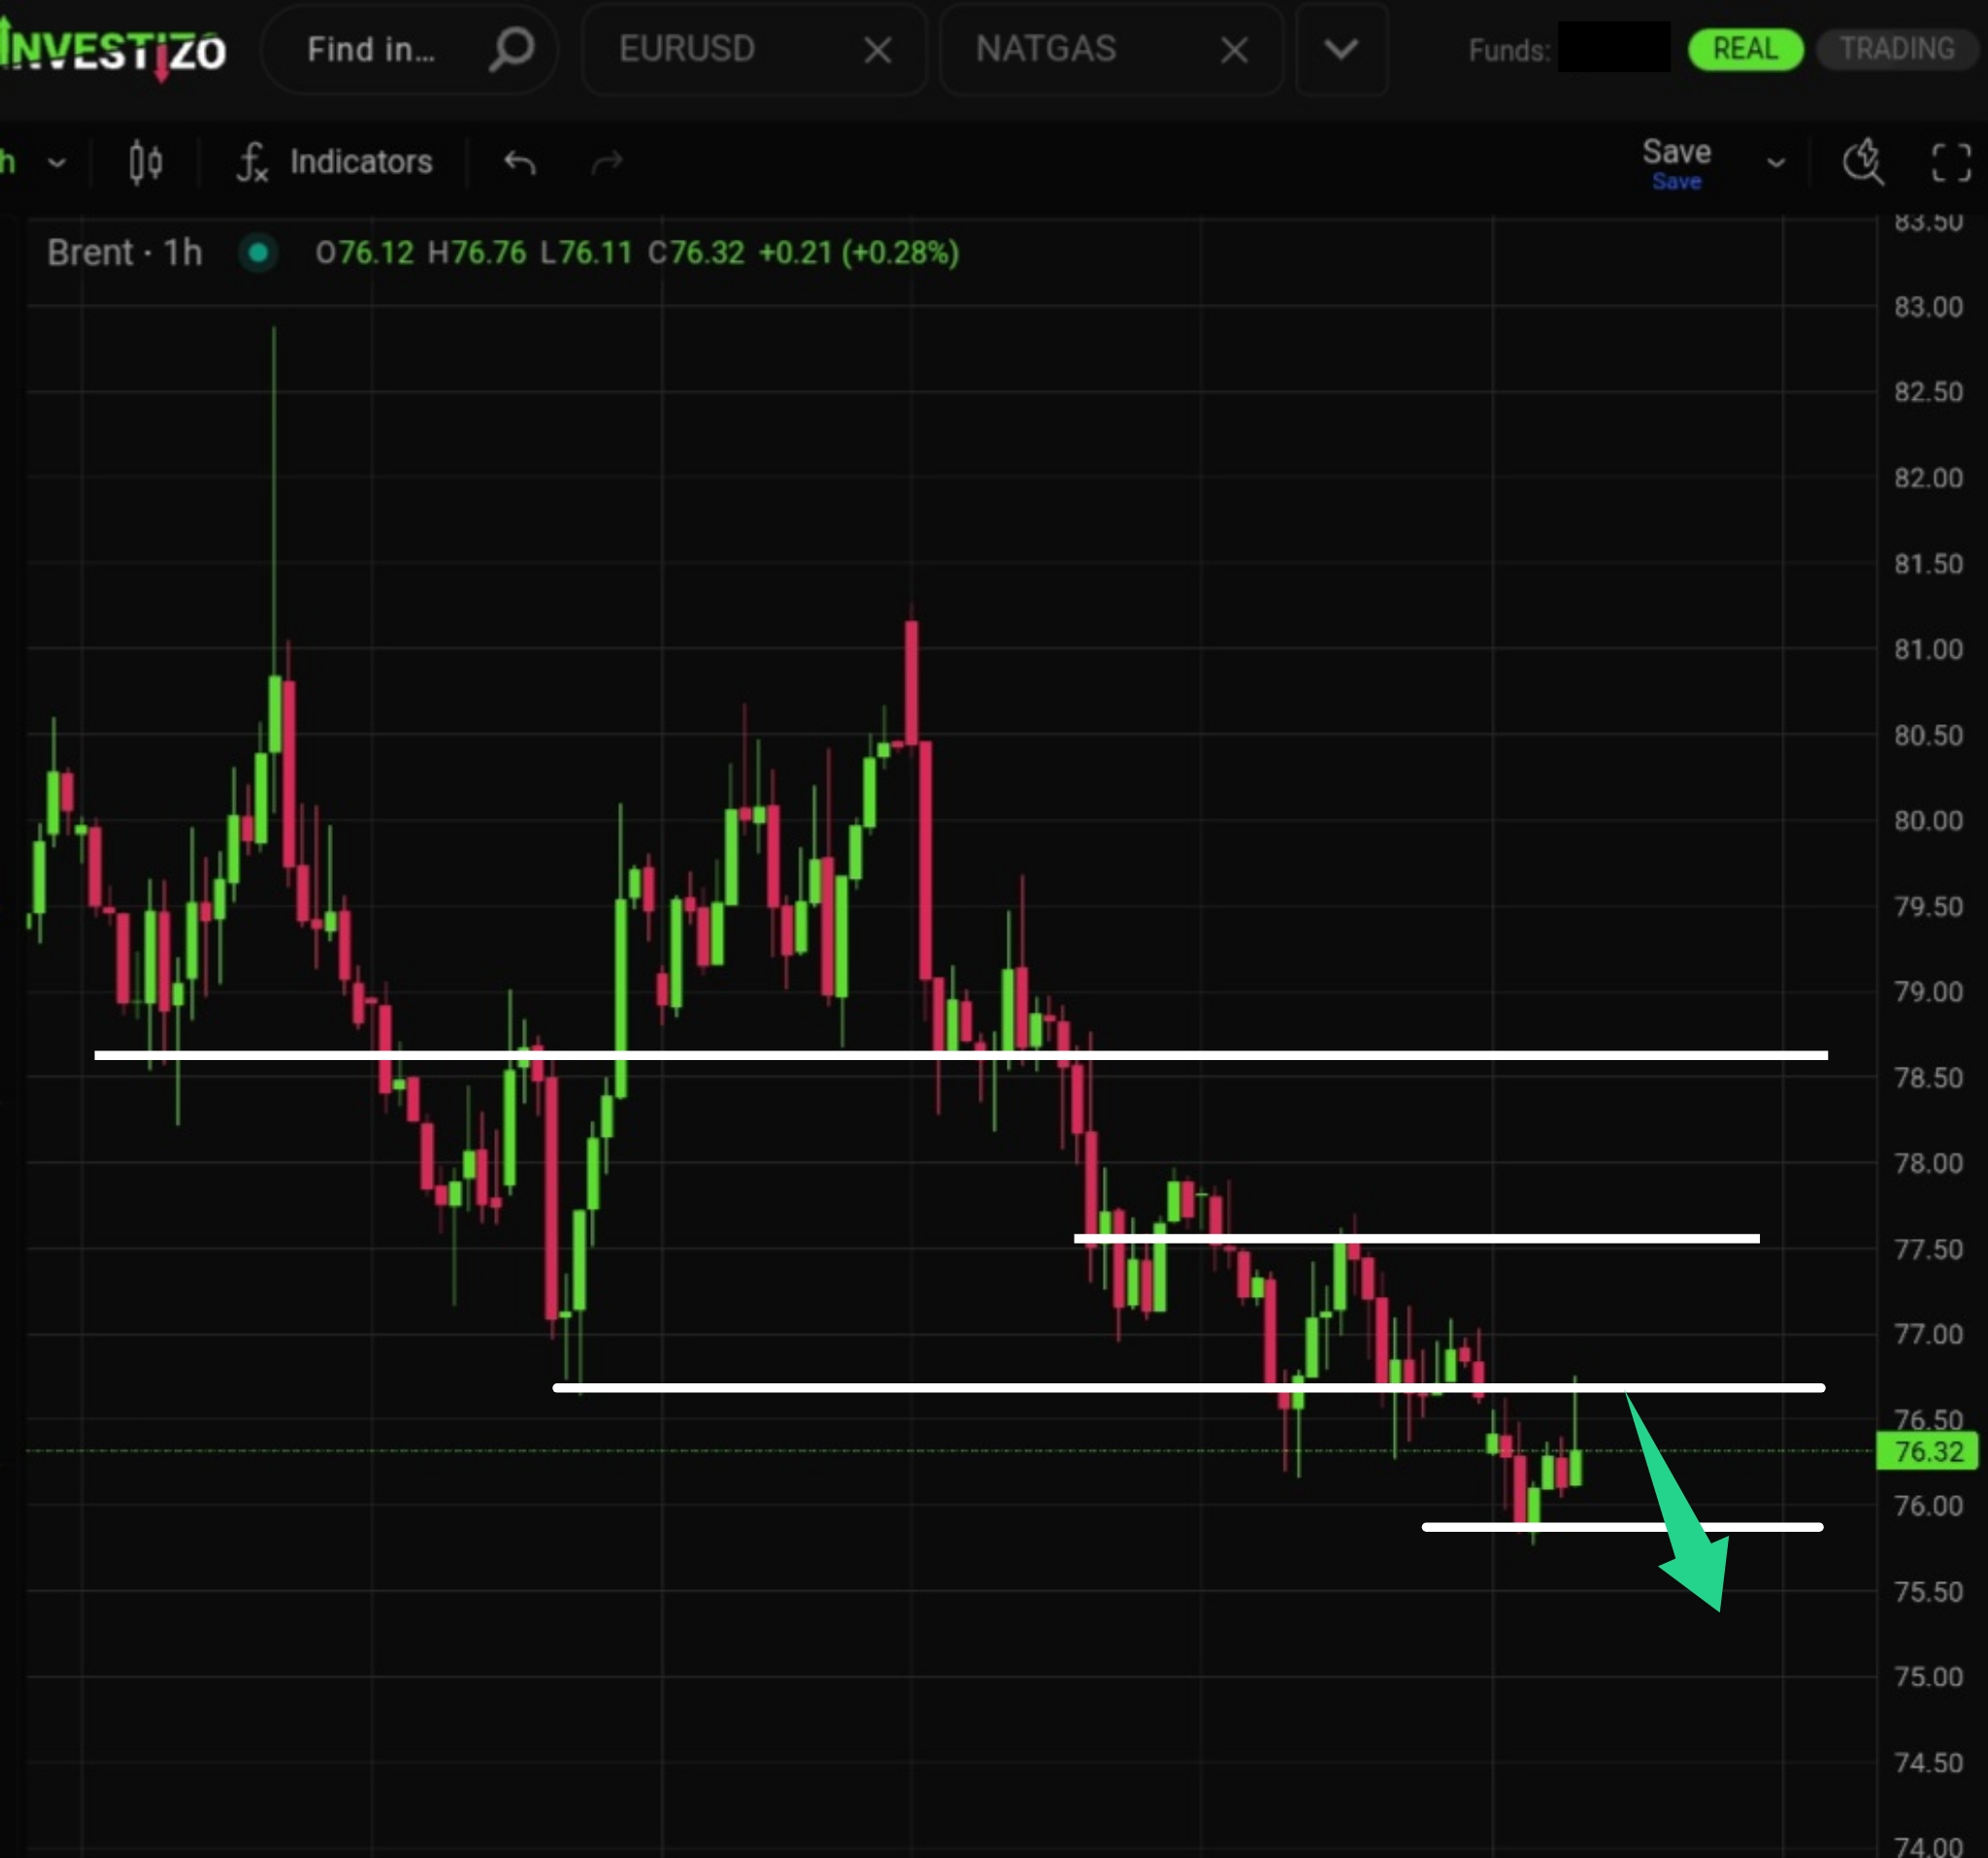
Brent crude has dropped to $72.92 per barrel as the market prices out the last of the Iranian risk premium.
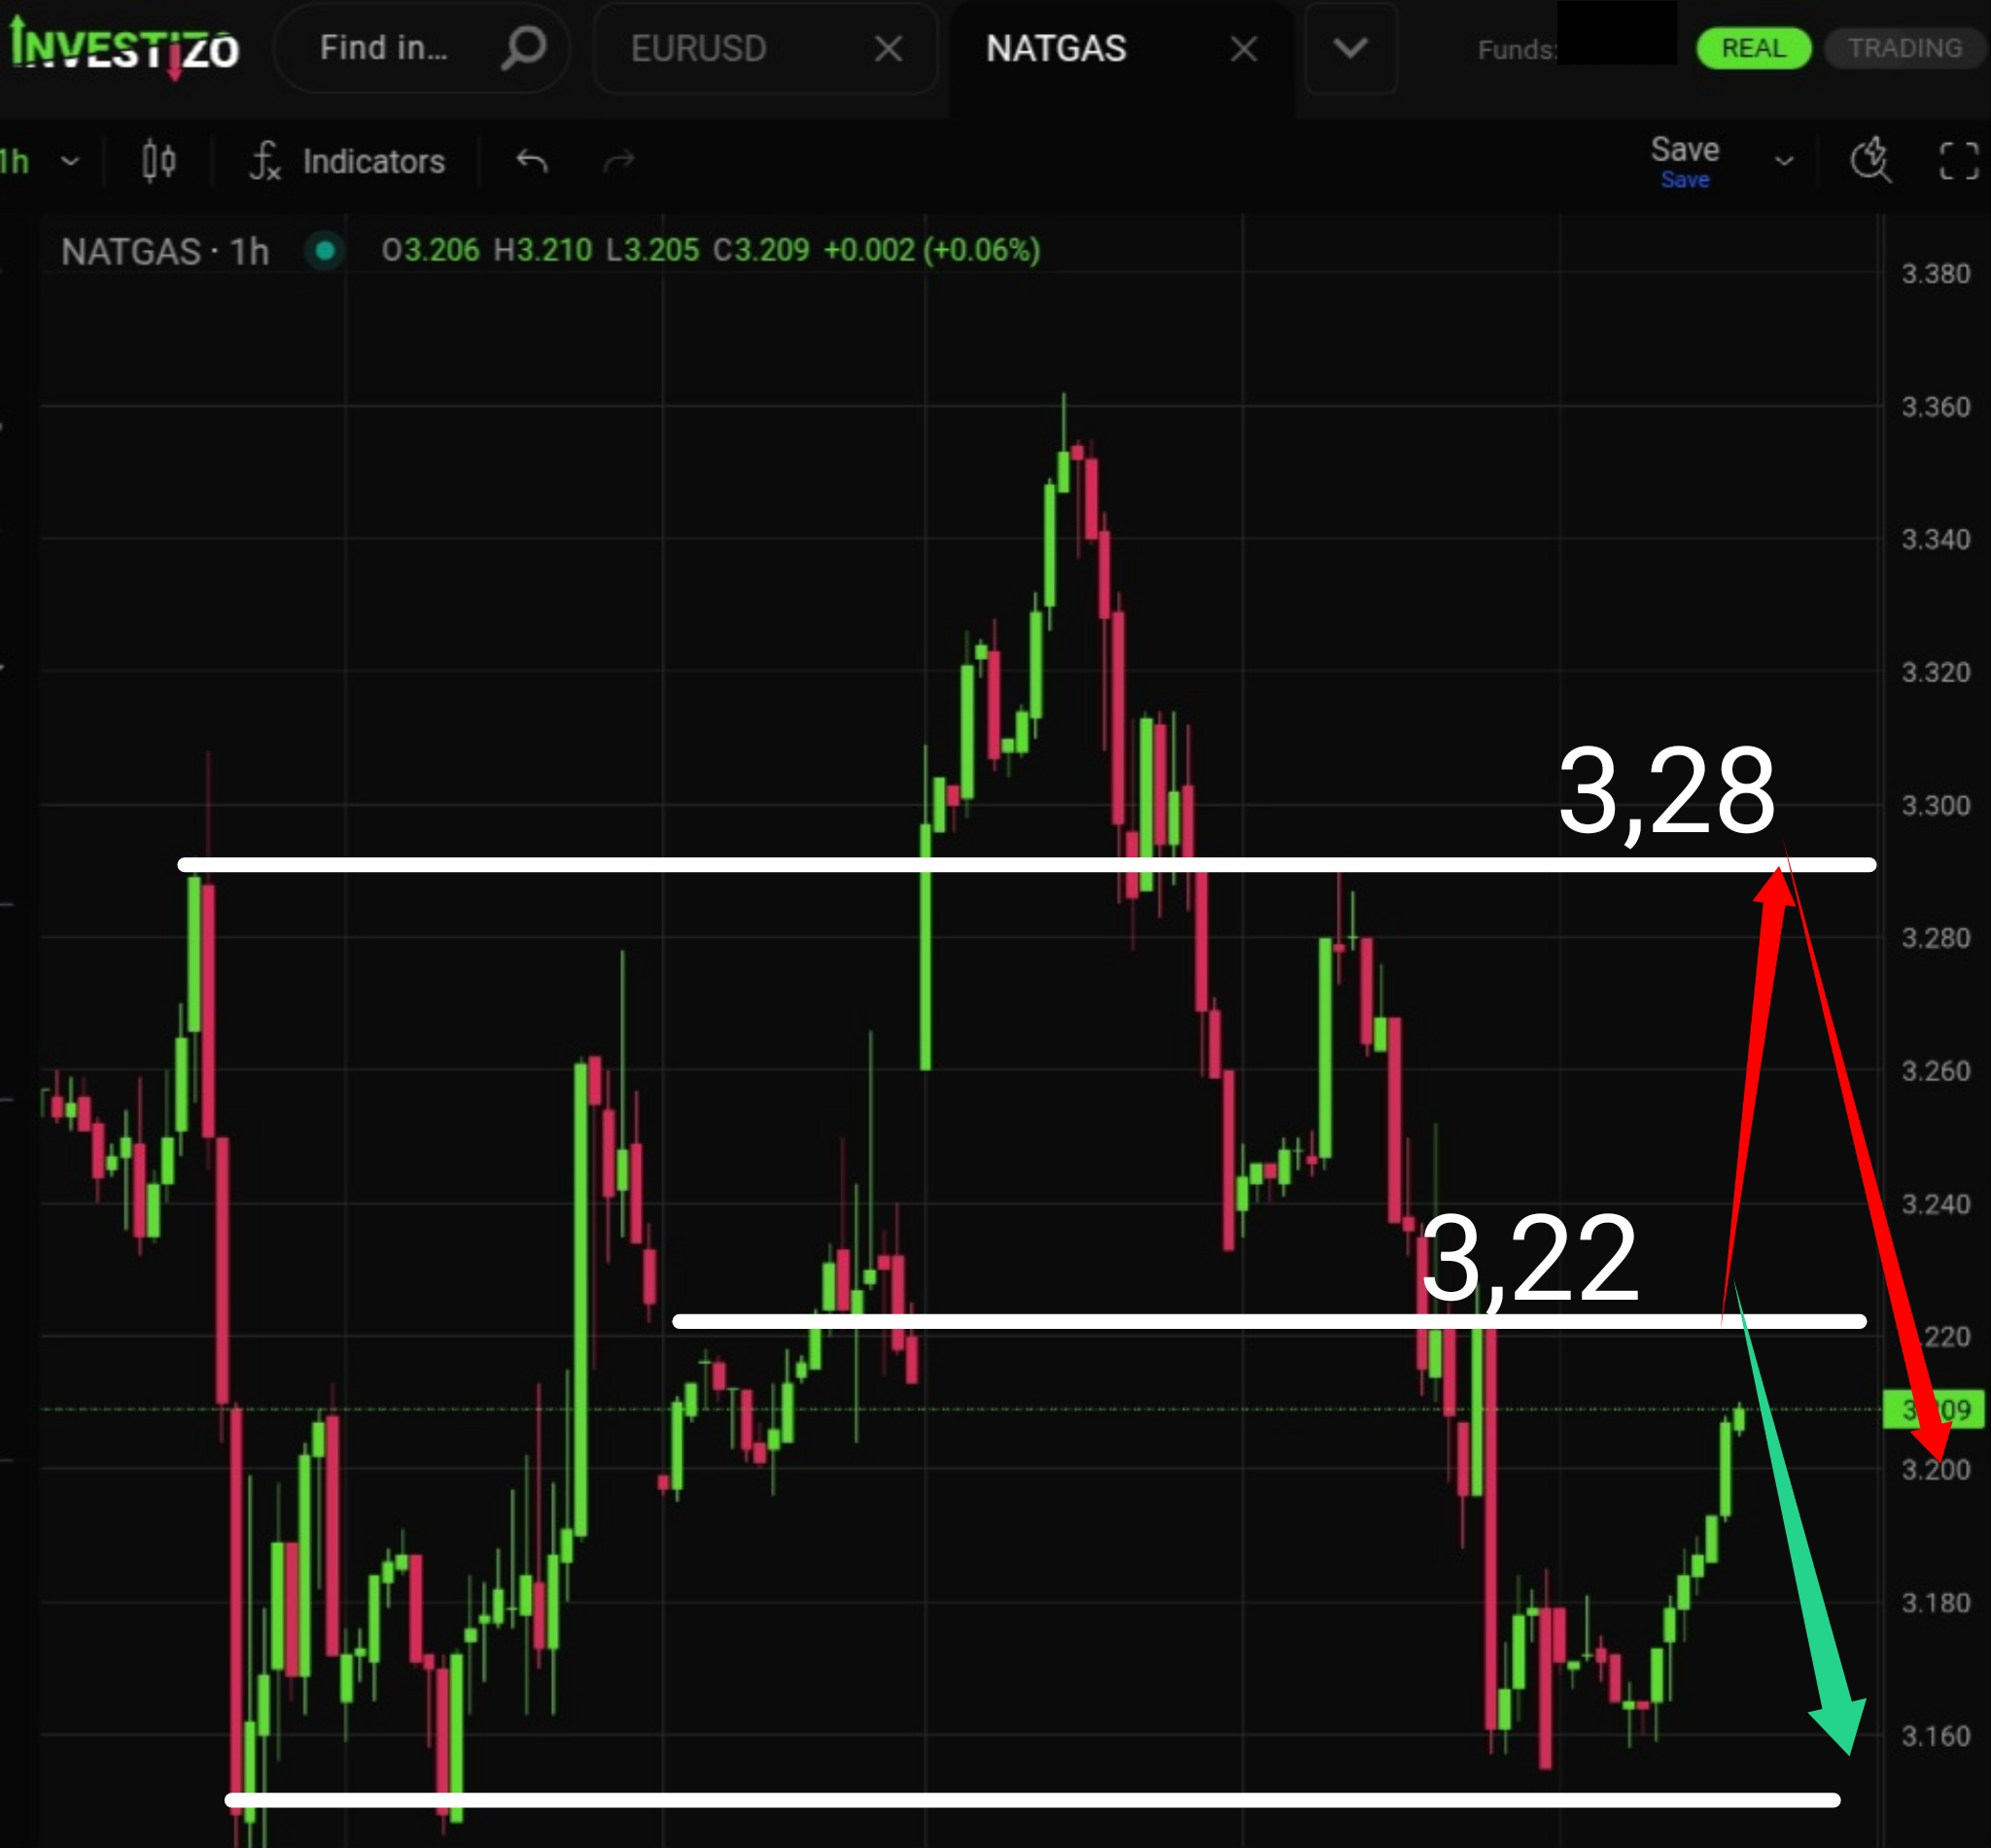
Natural gas has found support near the 3.15 zone and has moved into another corrective rebound.
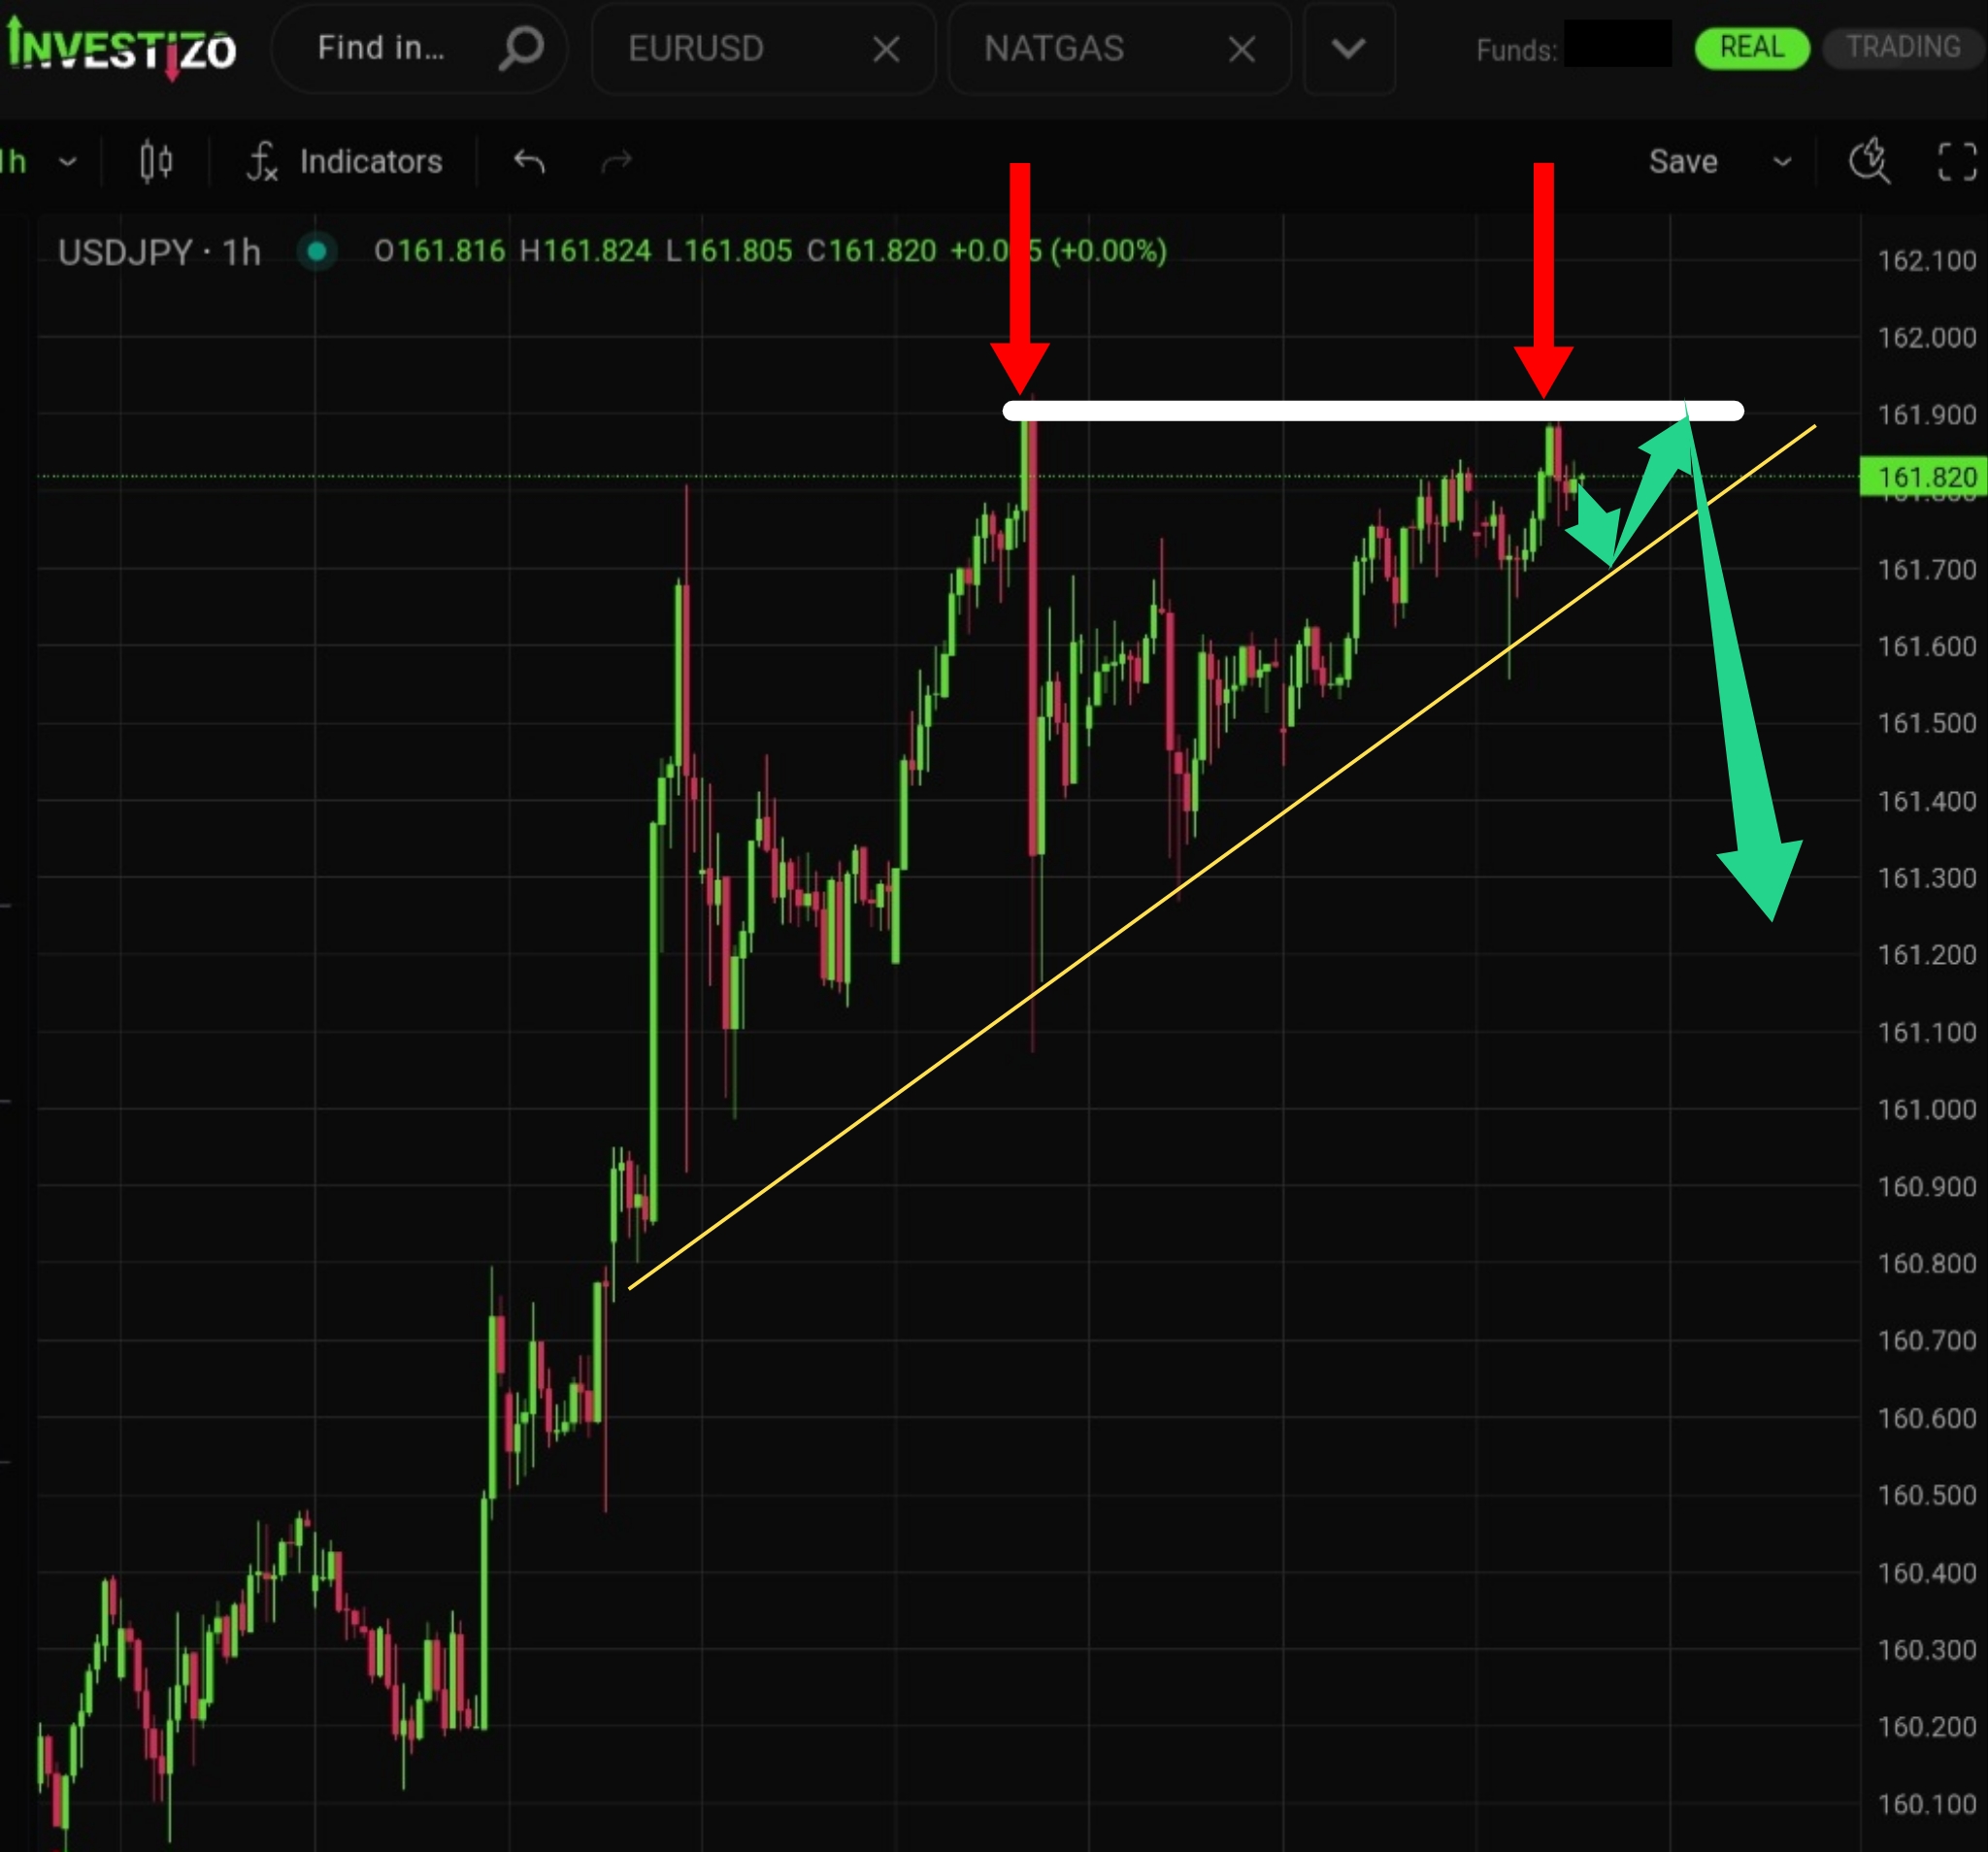
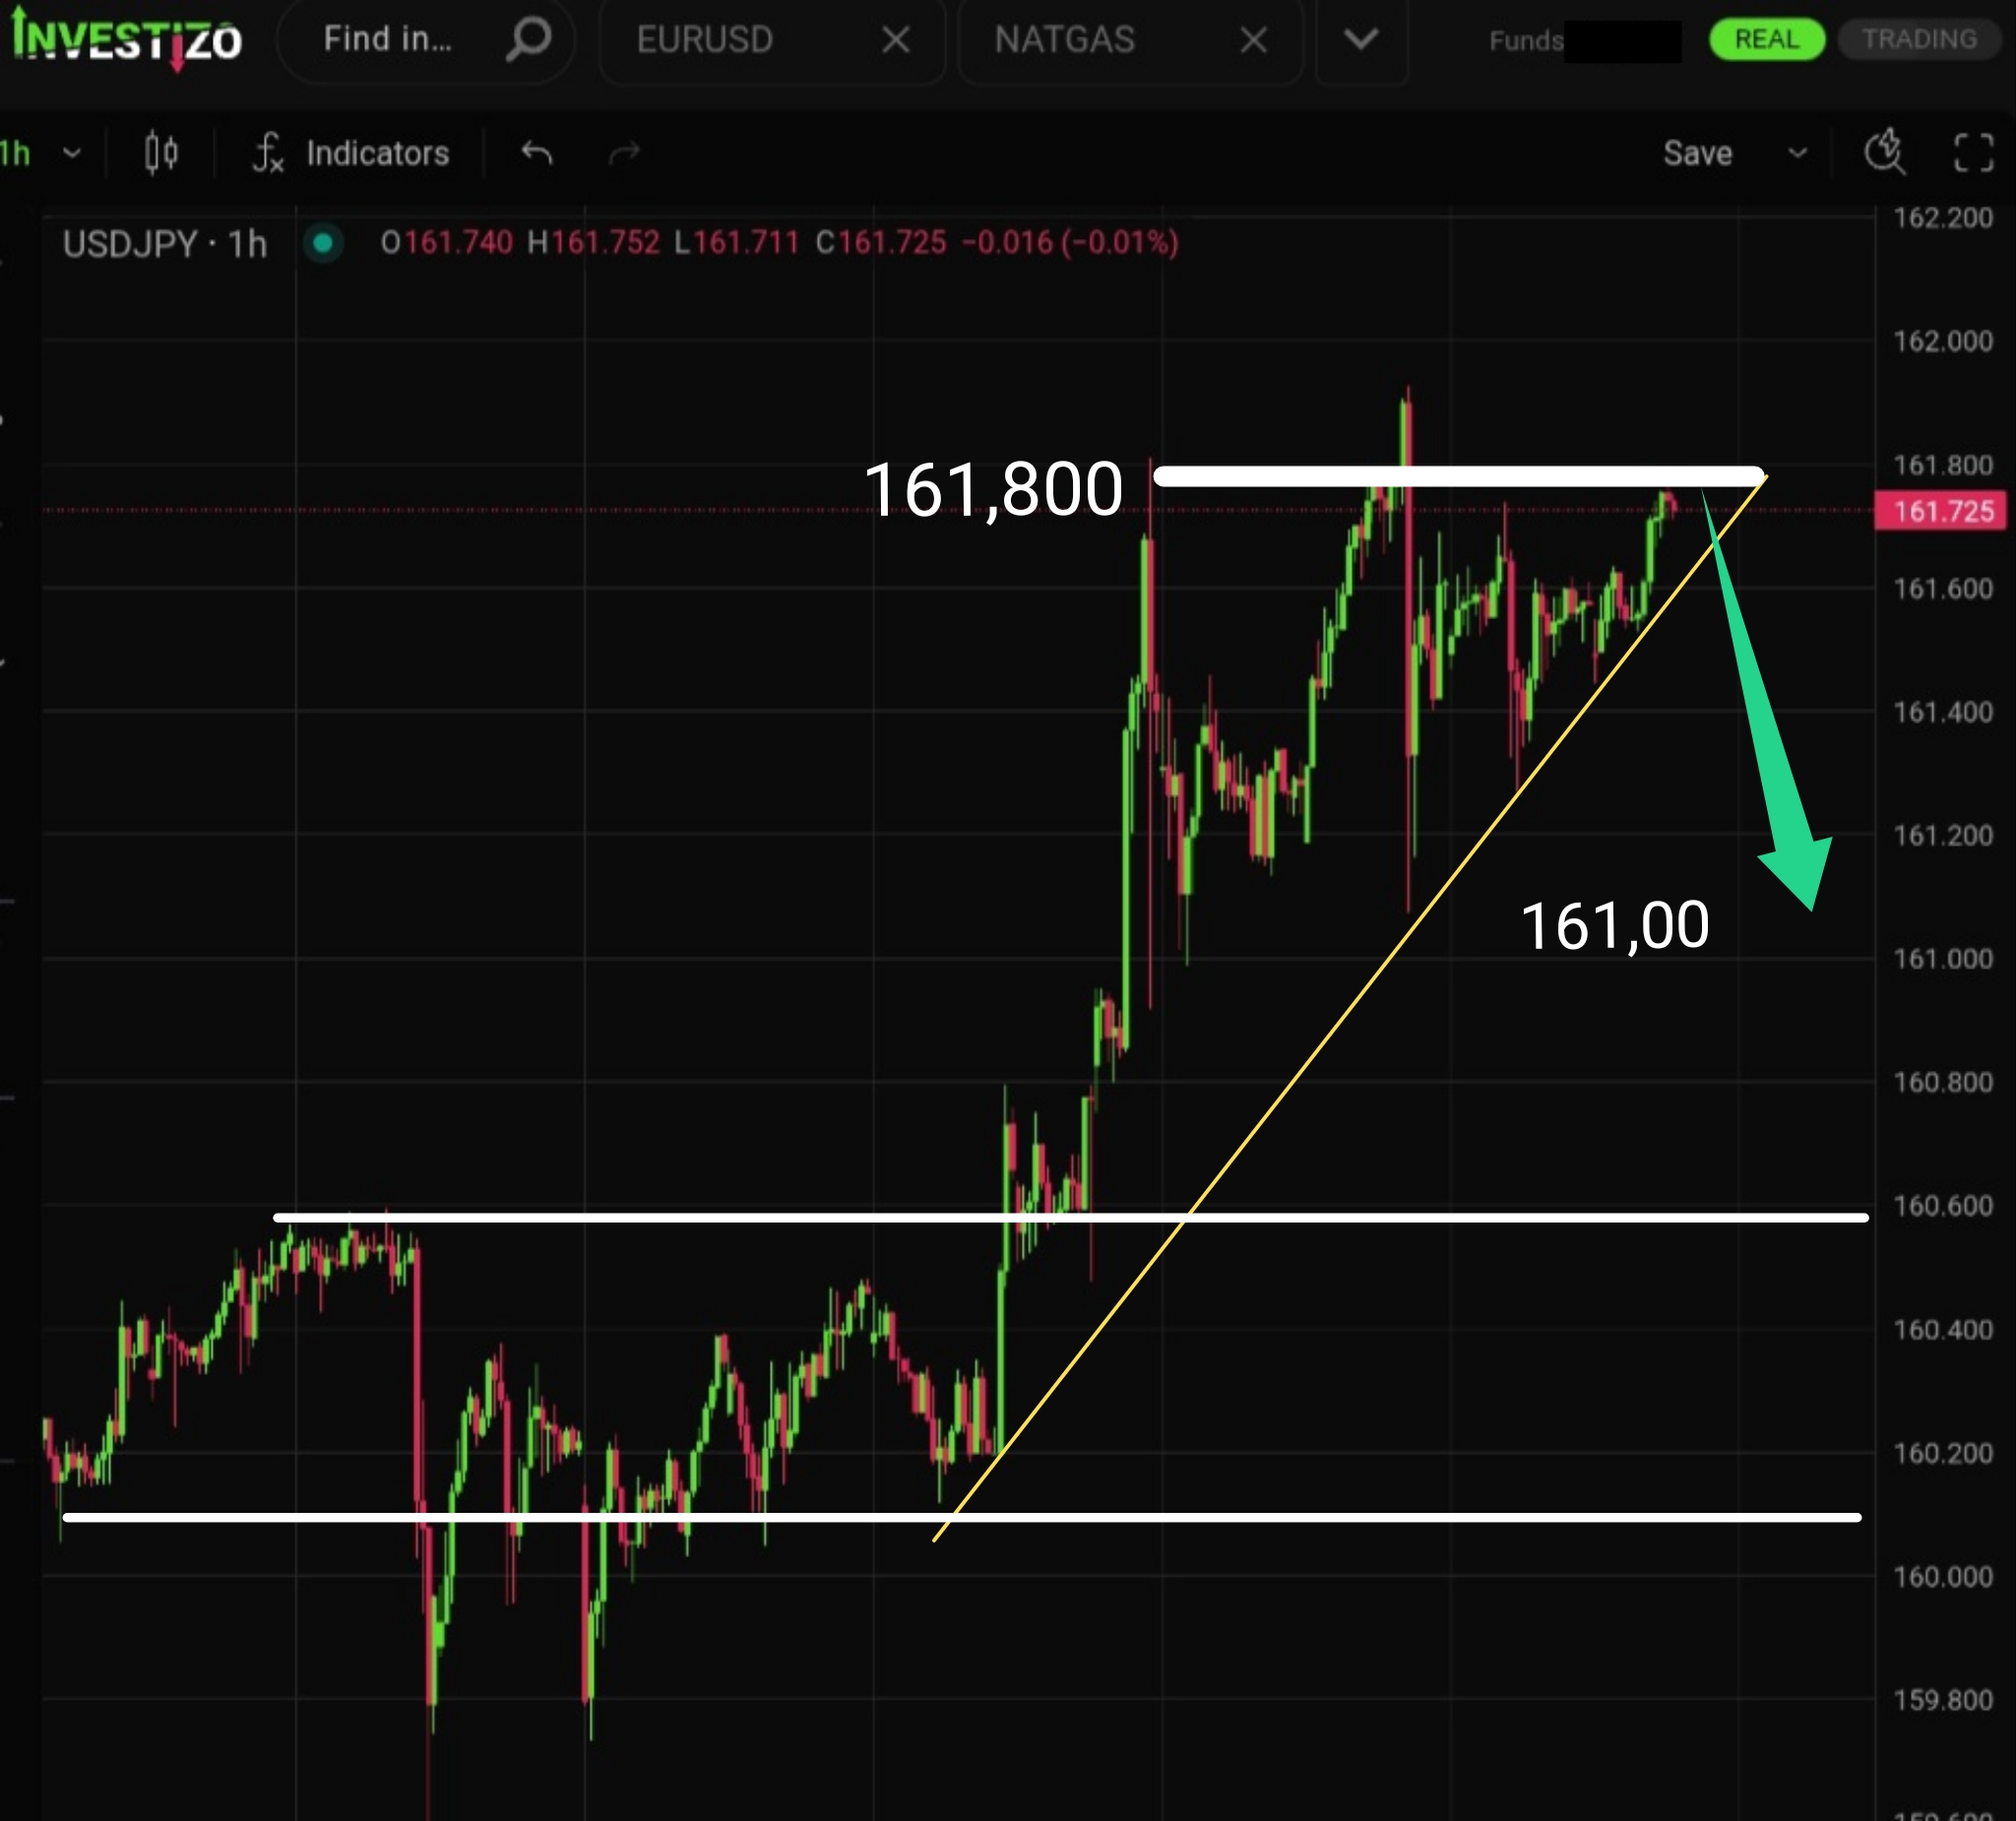
The pair is in an extreme consolidation phase, squeezed between strong resistance at 161.800 above and a steep trendline below.
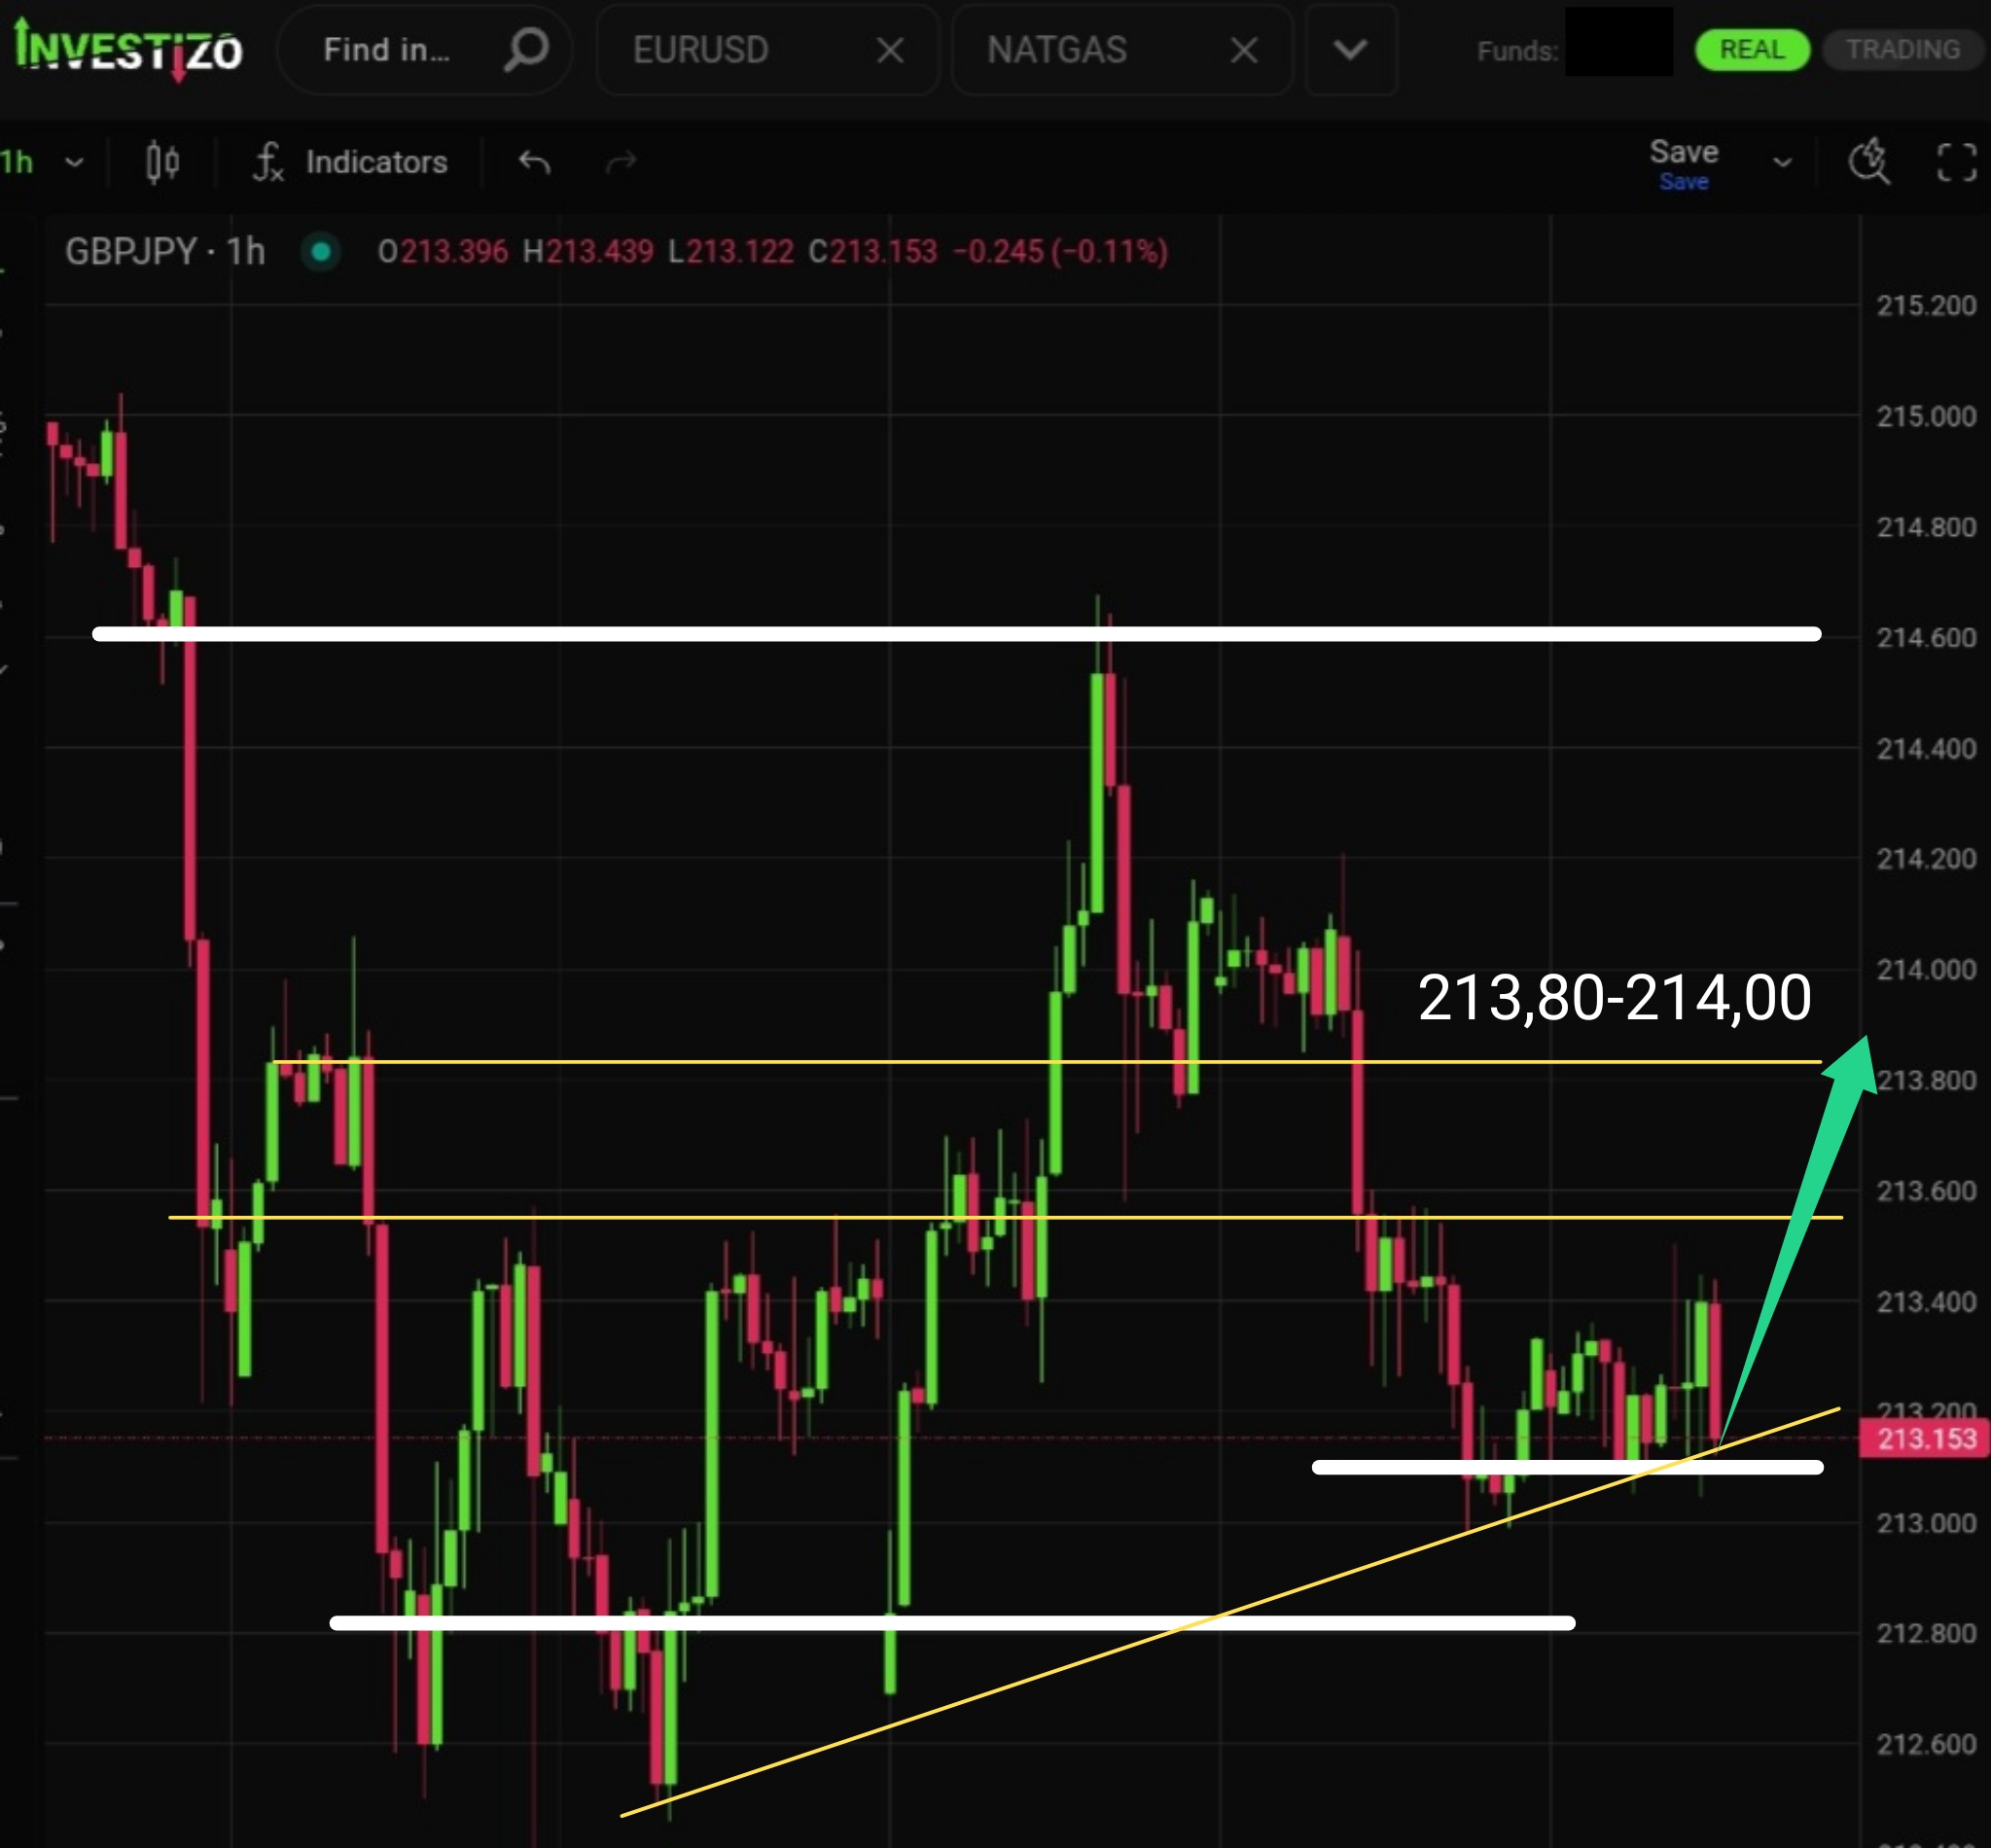
The pair is likely completing its downward correction and is currently testing a new support zone.
The asset remains under the pressure of multiple bearish factors, with prospects of a medium-term decline toward $50,000.
The pair continues to respect the broader downtrend but shows signs of a technical upward correction toward the key pivot at 1.1380.
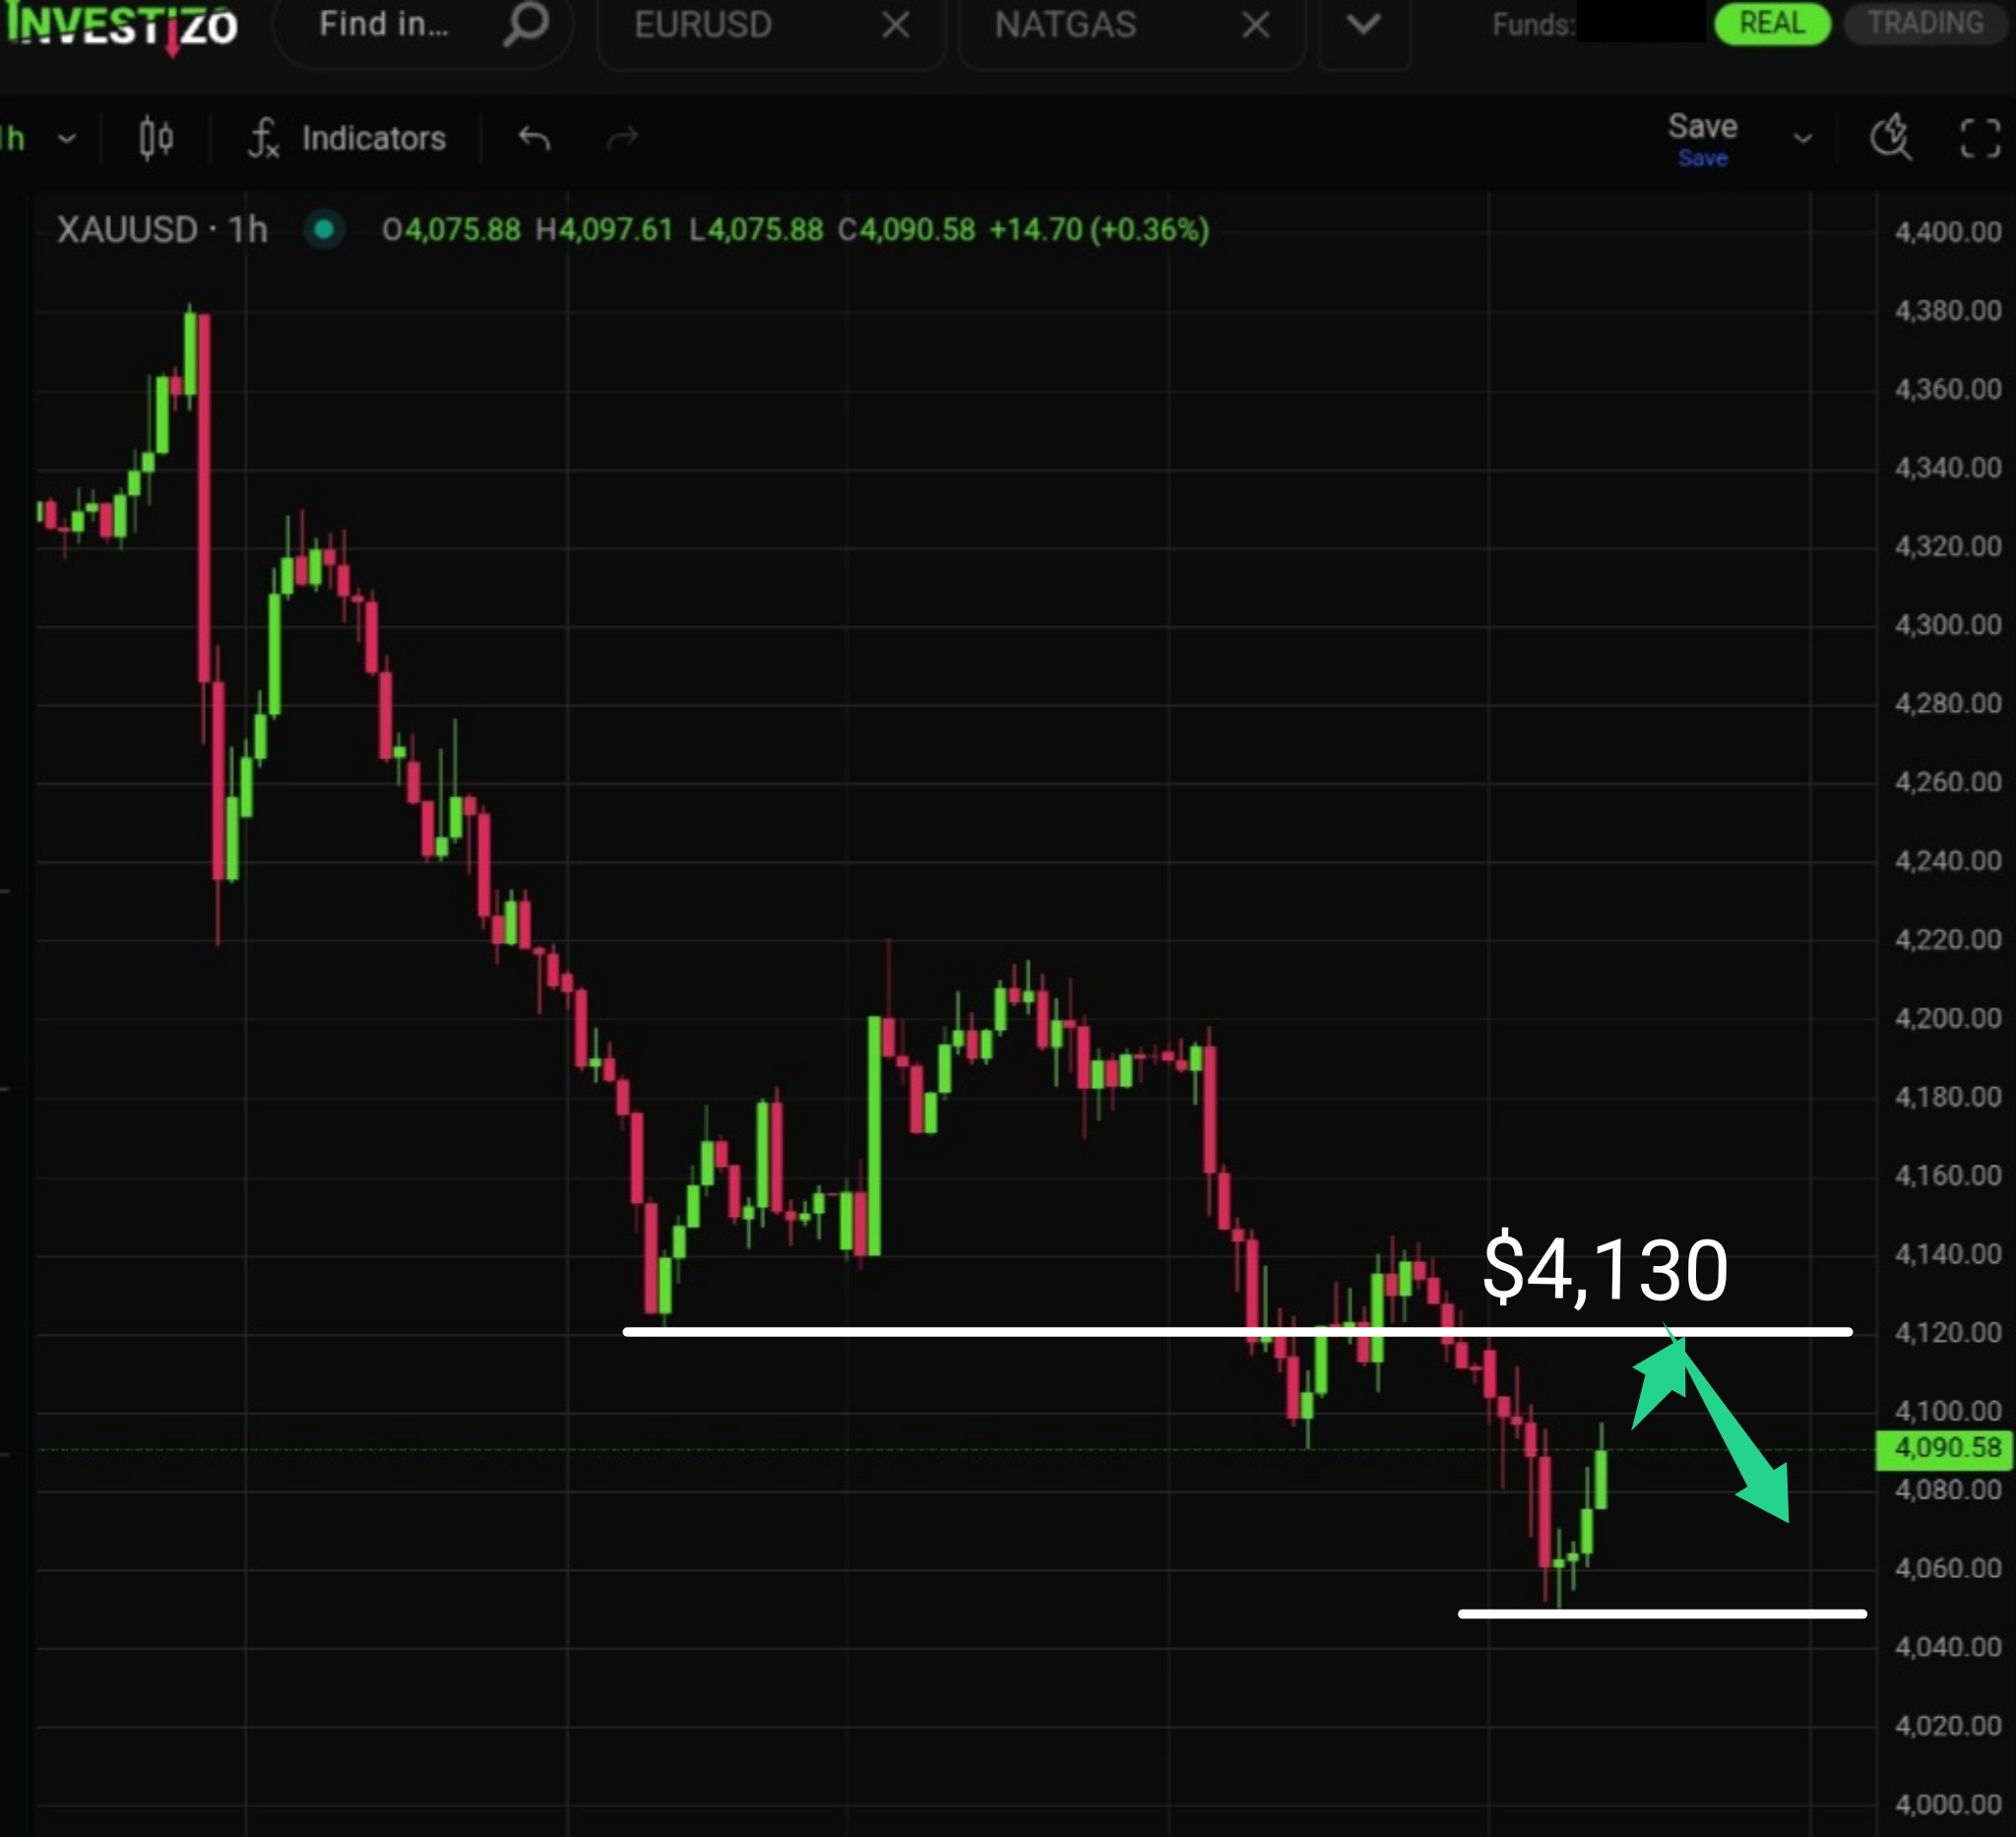
The secular bull case for precious metals is facing an aggressive structural recalibration as Wall Street heavyweights pivot toward a more hawkish Federal Reserve trajectory.
The multi-week unwind in global energy markets has entered a more aggressive phase, driven by record-shattering transit volumes and direct executive pressure from Washington.
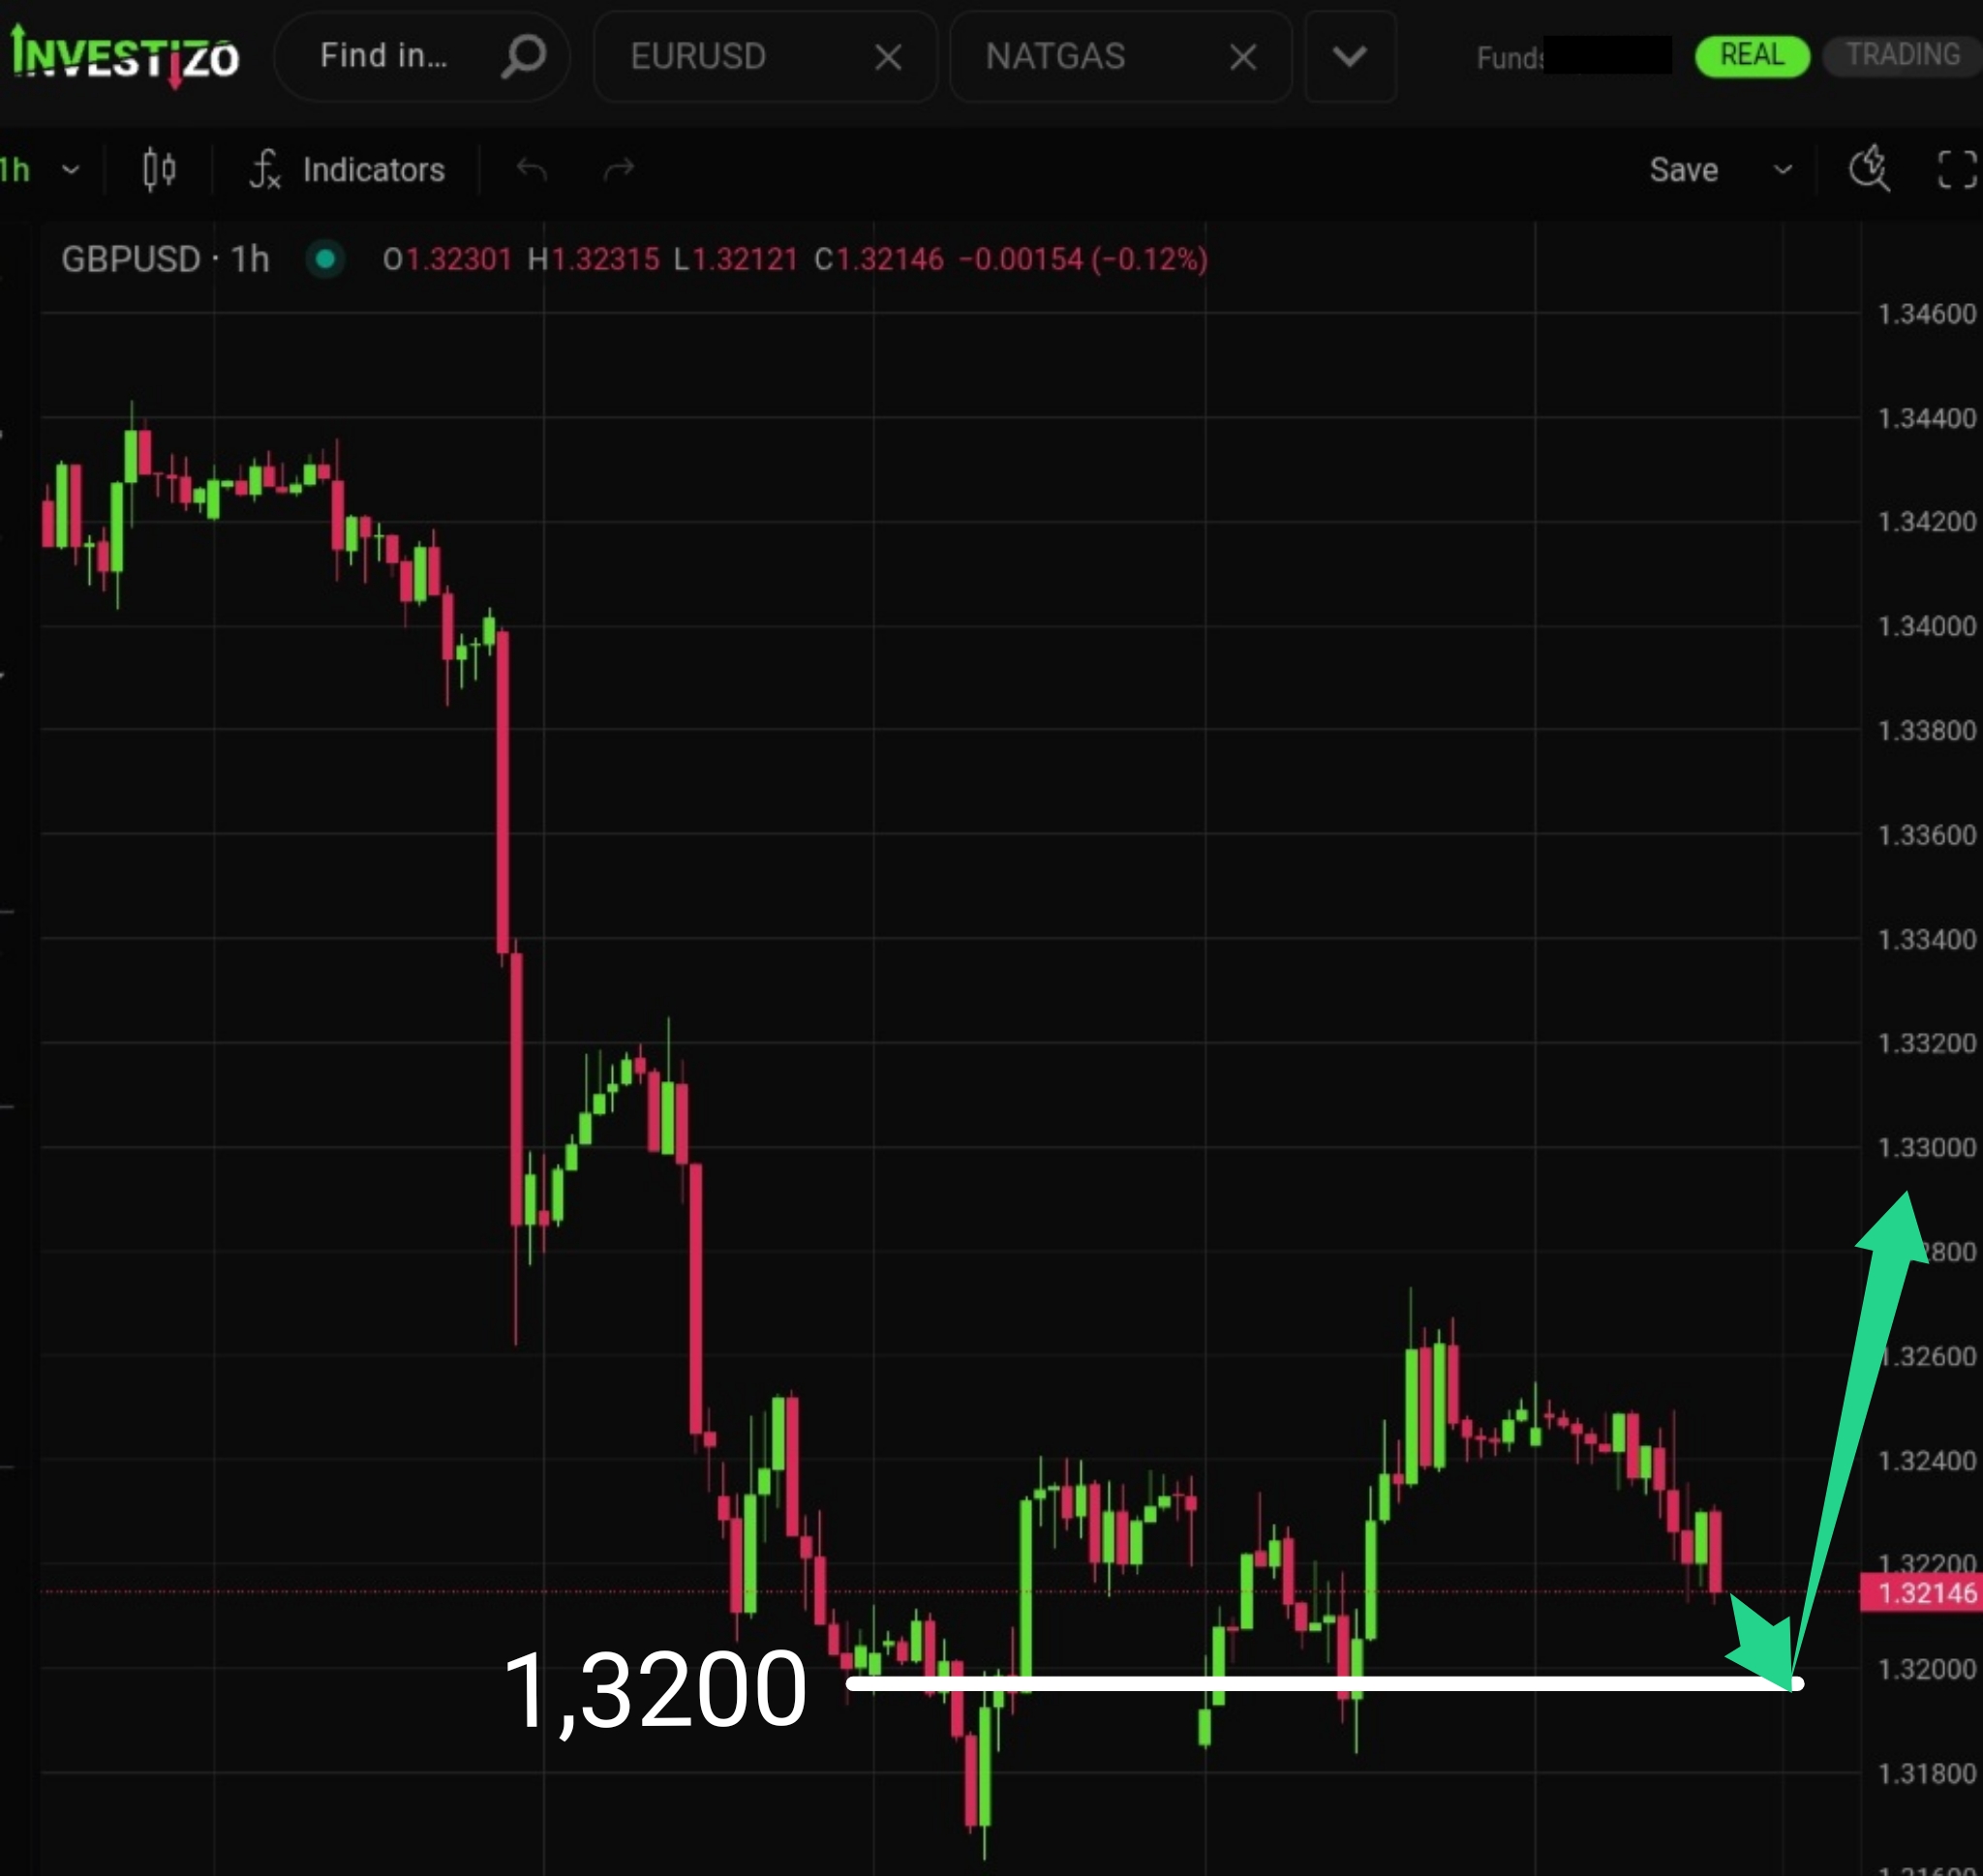
The pair is undergoing a technical pullback toward the demand zone at 1.3200, where a bullish reversal signal was previously formed.