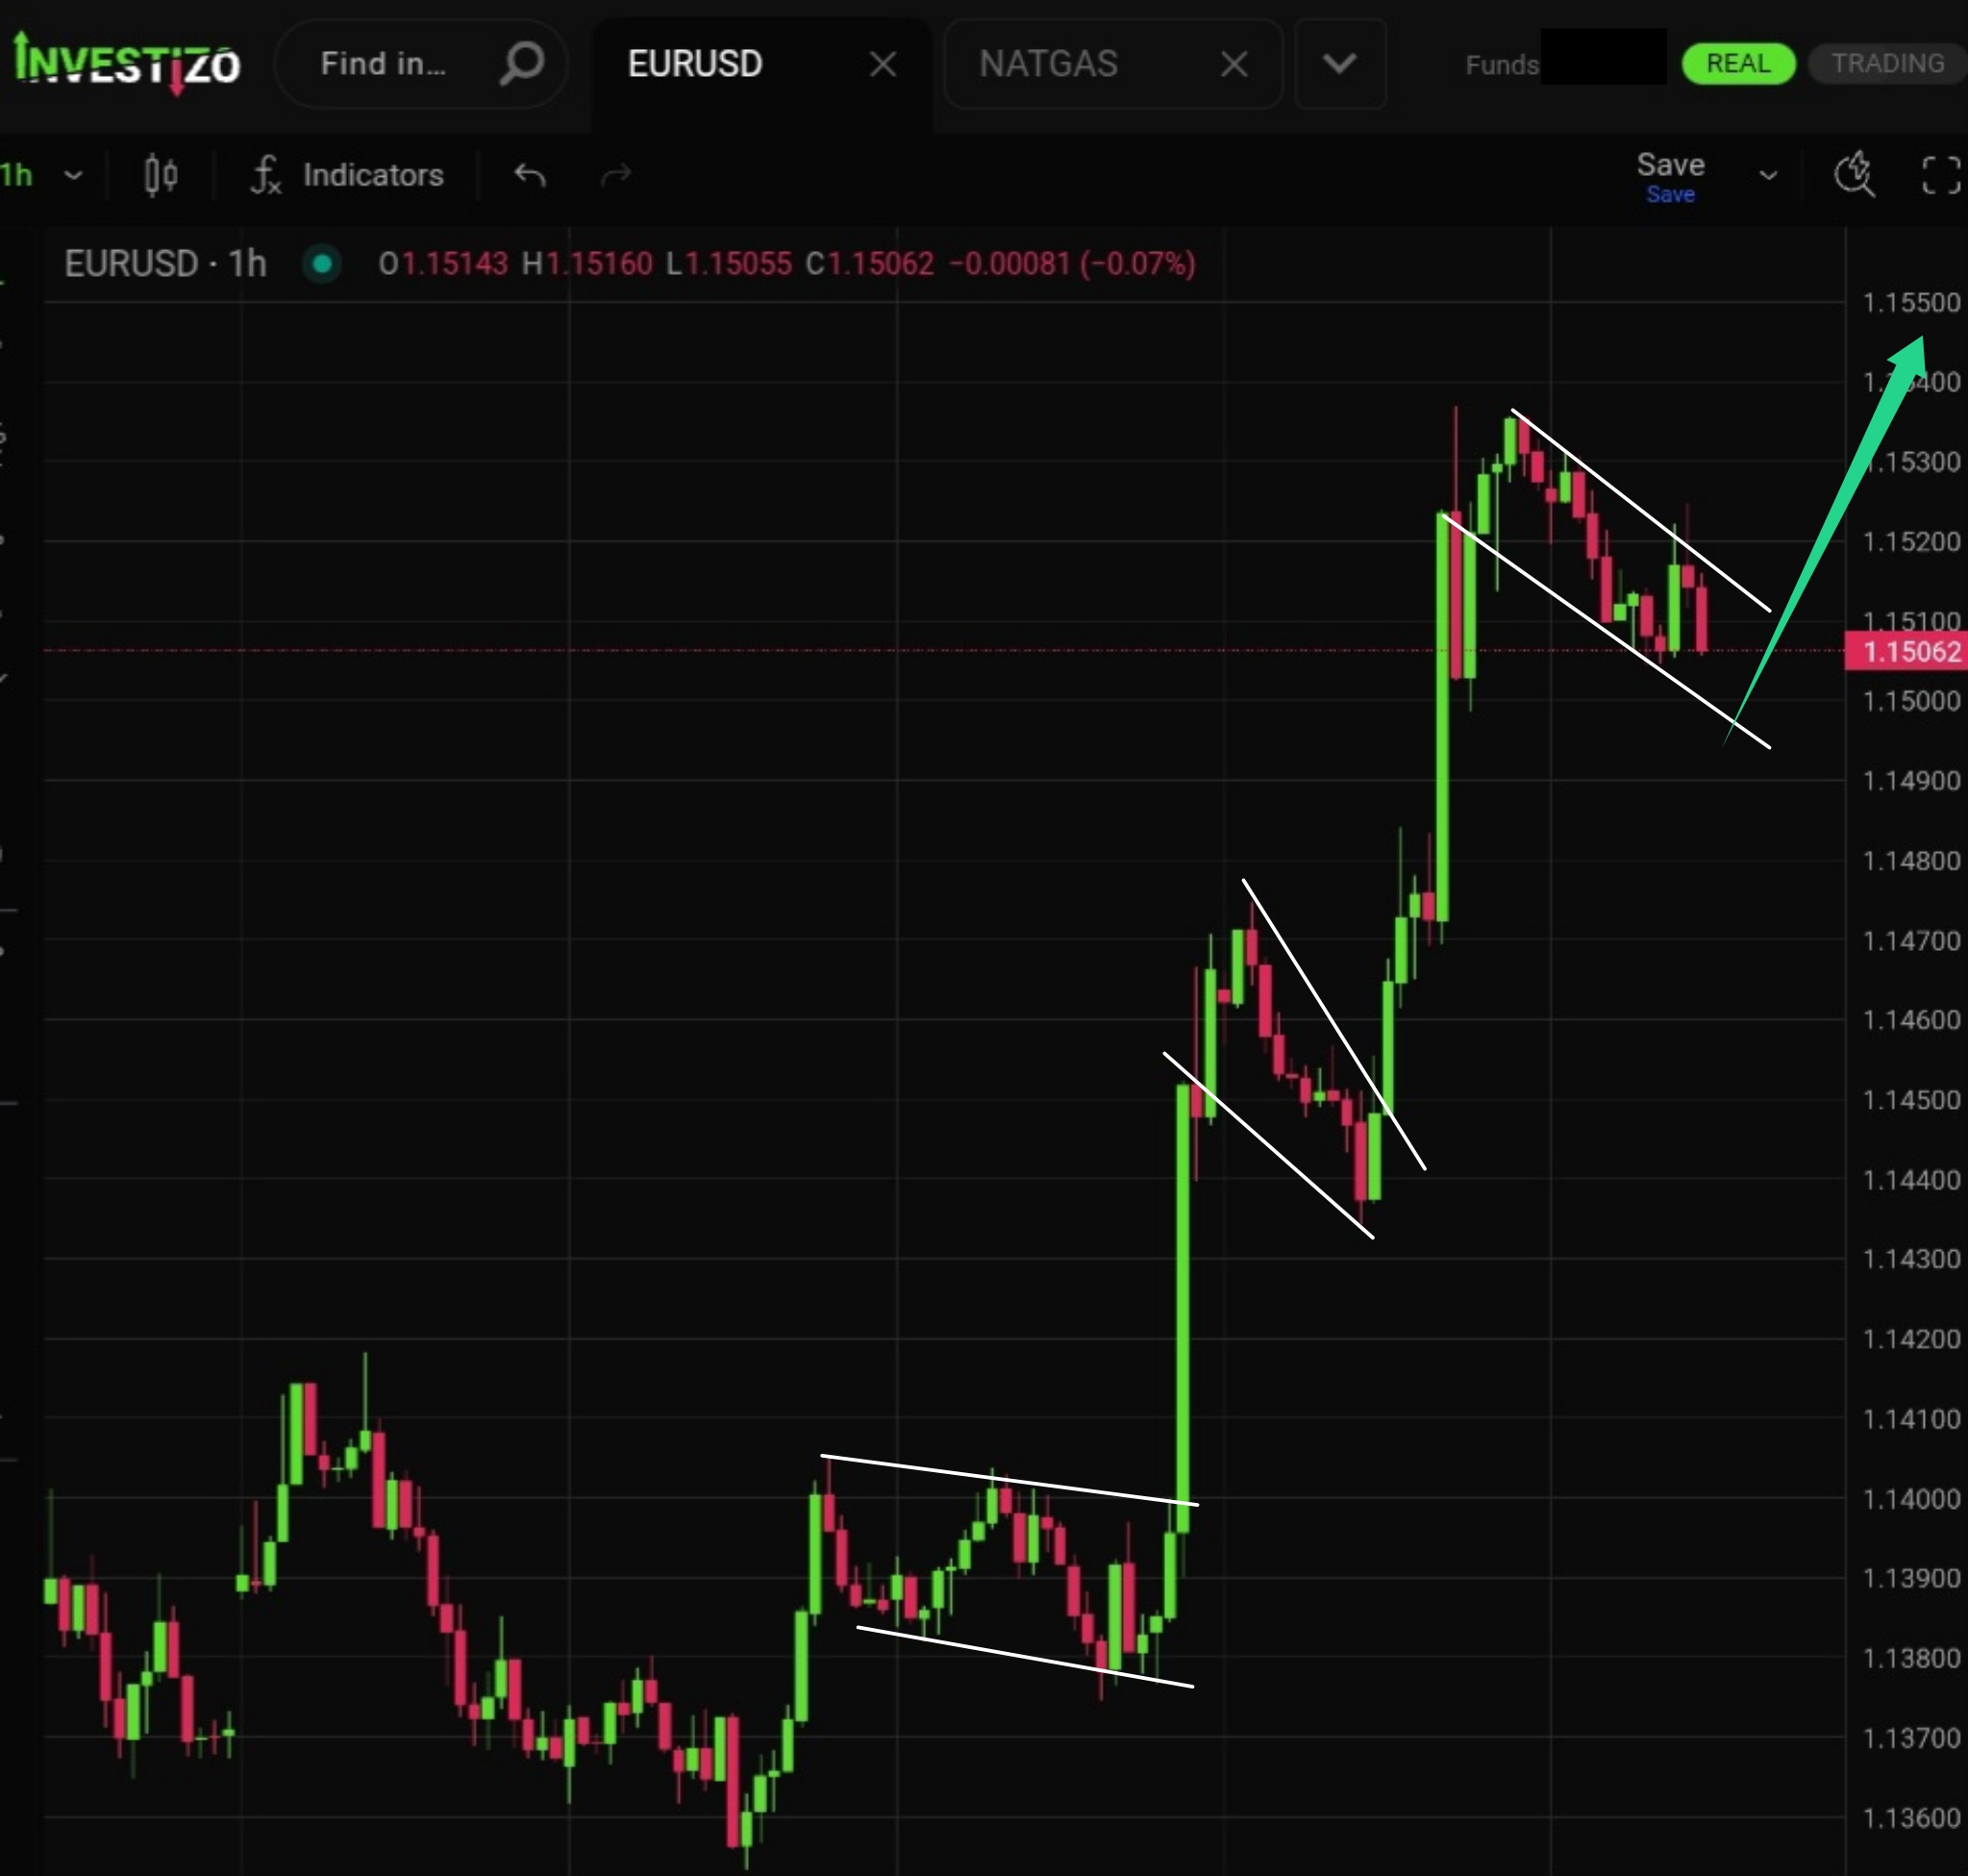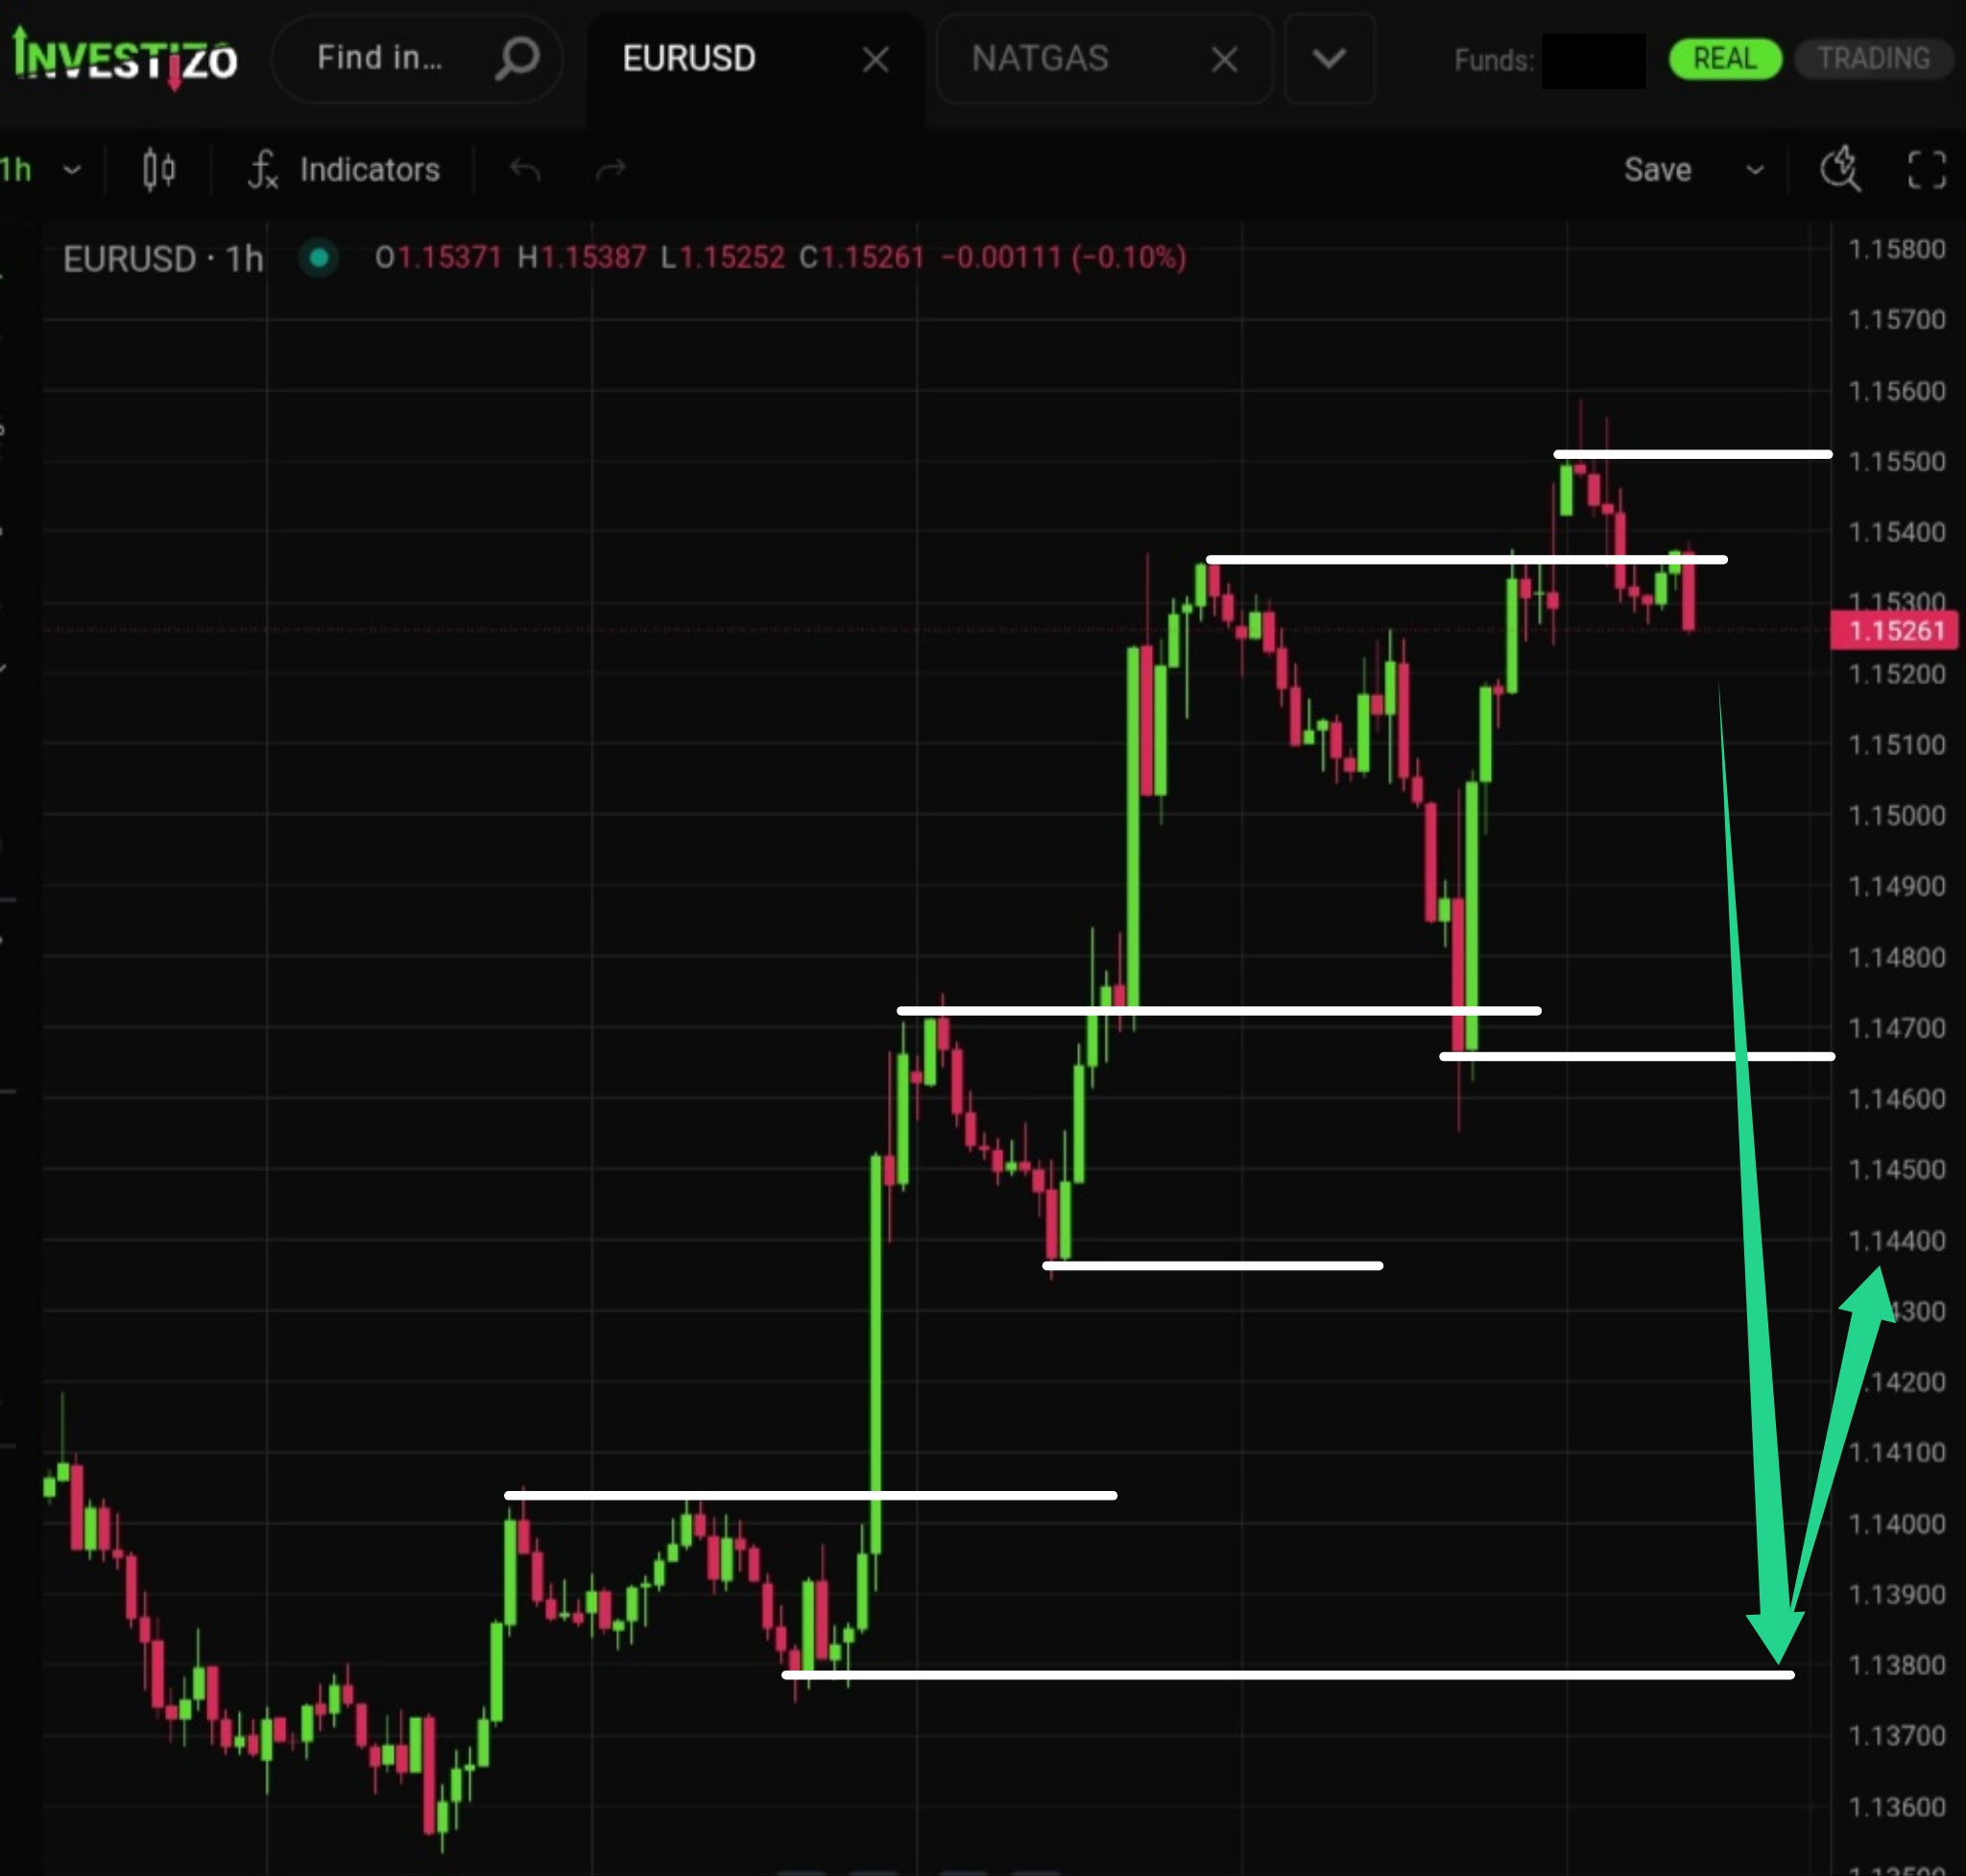
EUR/USD, Technical Analysis – H1
The medium-term bullish trend has already completed a full 7-wave structure — an unusually extended sequence for current market conditions.
Investizo LTD. Business company number 25432 BC 2019
Suite 305, Griffith Corporate Centre,
P.O. Box 1510, Beachmont, Kingstown,
St. Vincent and the Grenadines
DUNS 817053497
Phone:+996312610515
E-mail: [email protected]
© 2019-2026 Investizo 18+ Hak cipta terpelihara
Amaran Risiko: CFD adalah produk kewangan kompleks yang diperdagangkan berdasarkan margin. Perdagangan CFD berisiko dan mungkin tidak sesuai untuk sebilangan pelabur. Pastikan anda memahami risiko yang dihadapi kerana anda mungkin kehilangan semua modal yang anda laburkan.
The medium-term bullish trend has already completed a full 7-wave structure — an unusually extended sequence for current market conditions.
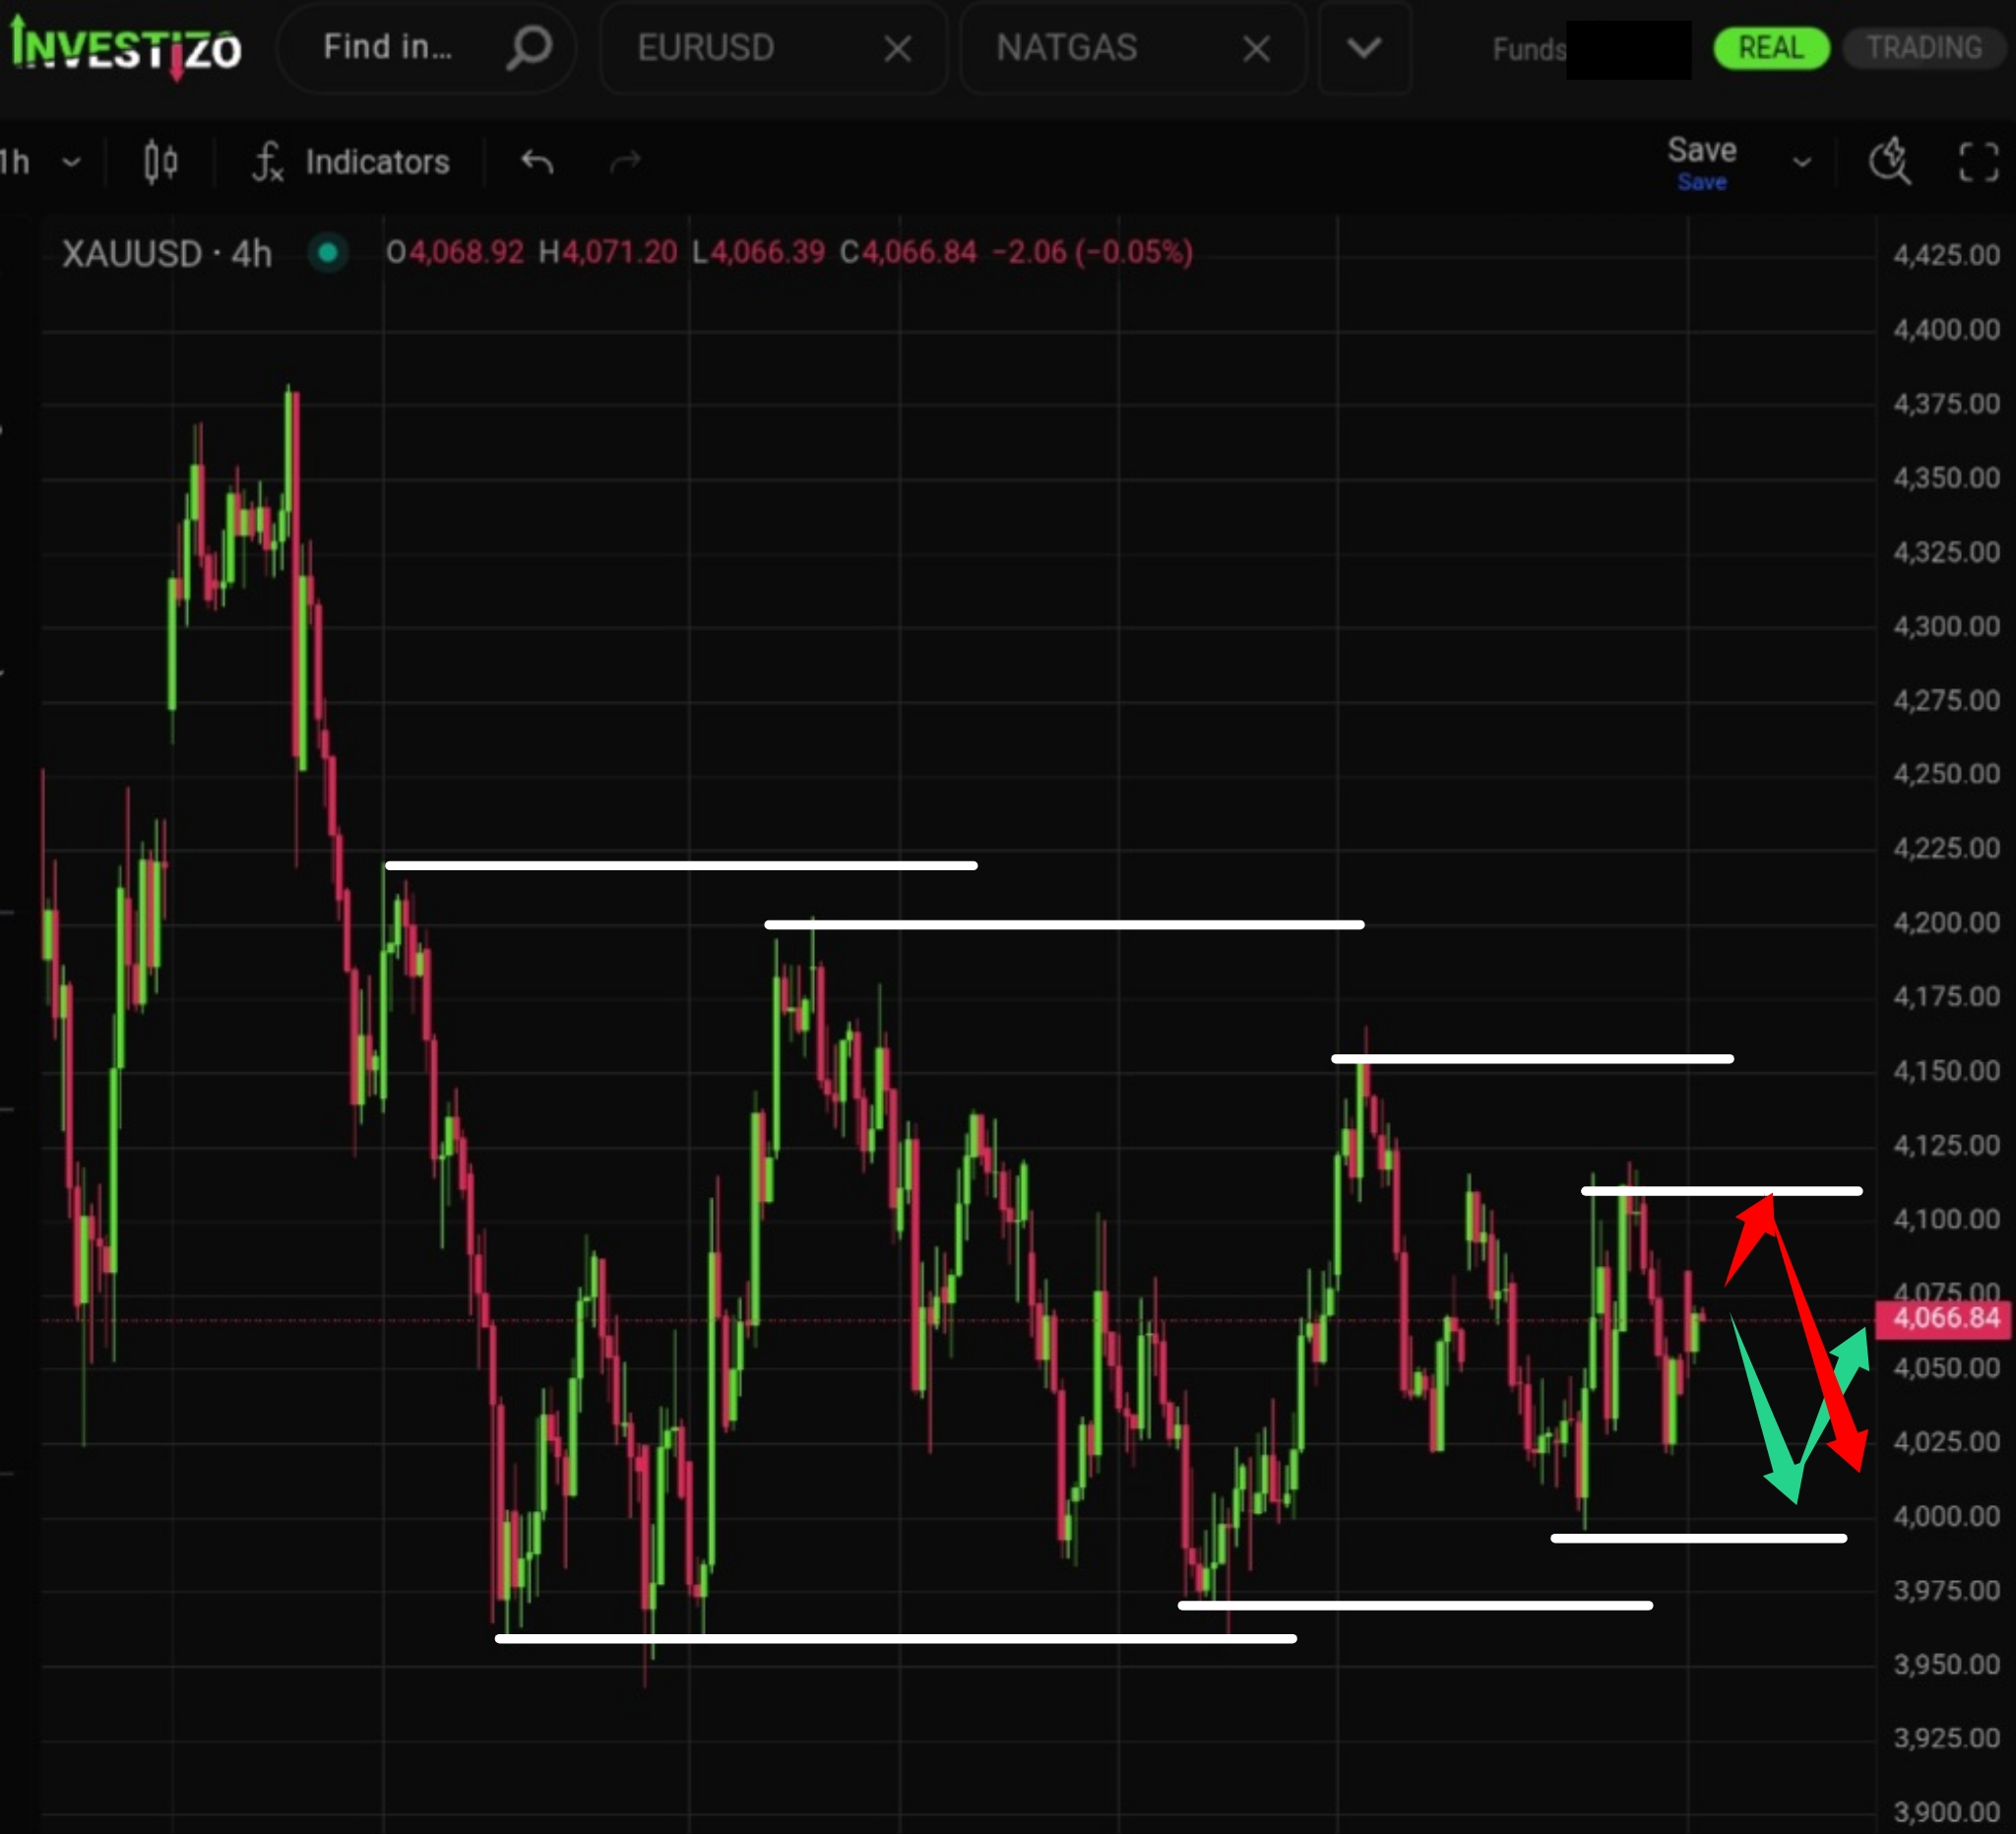
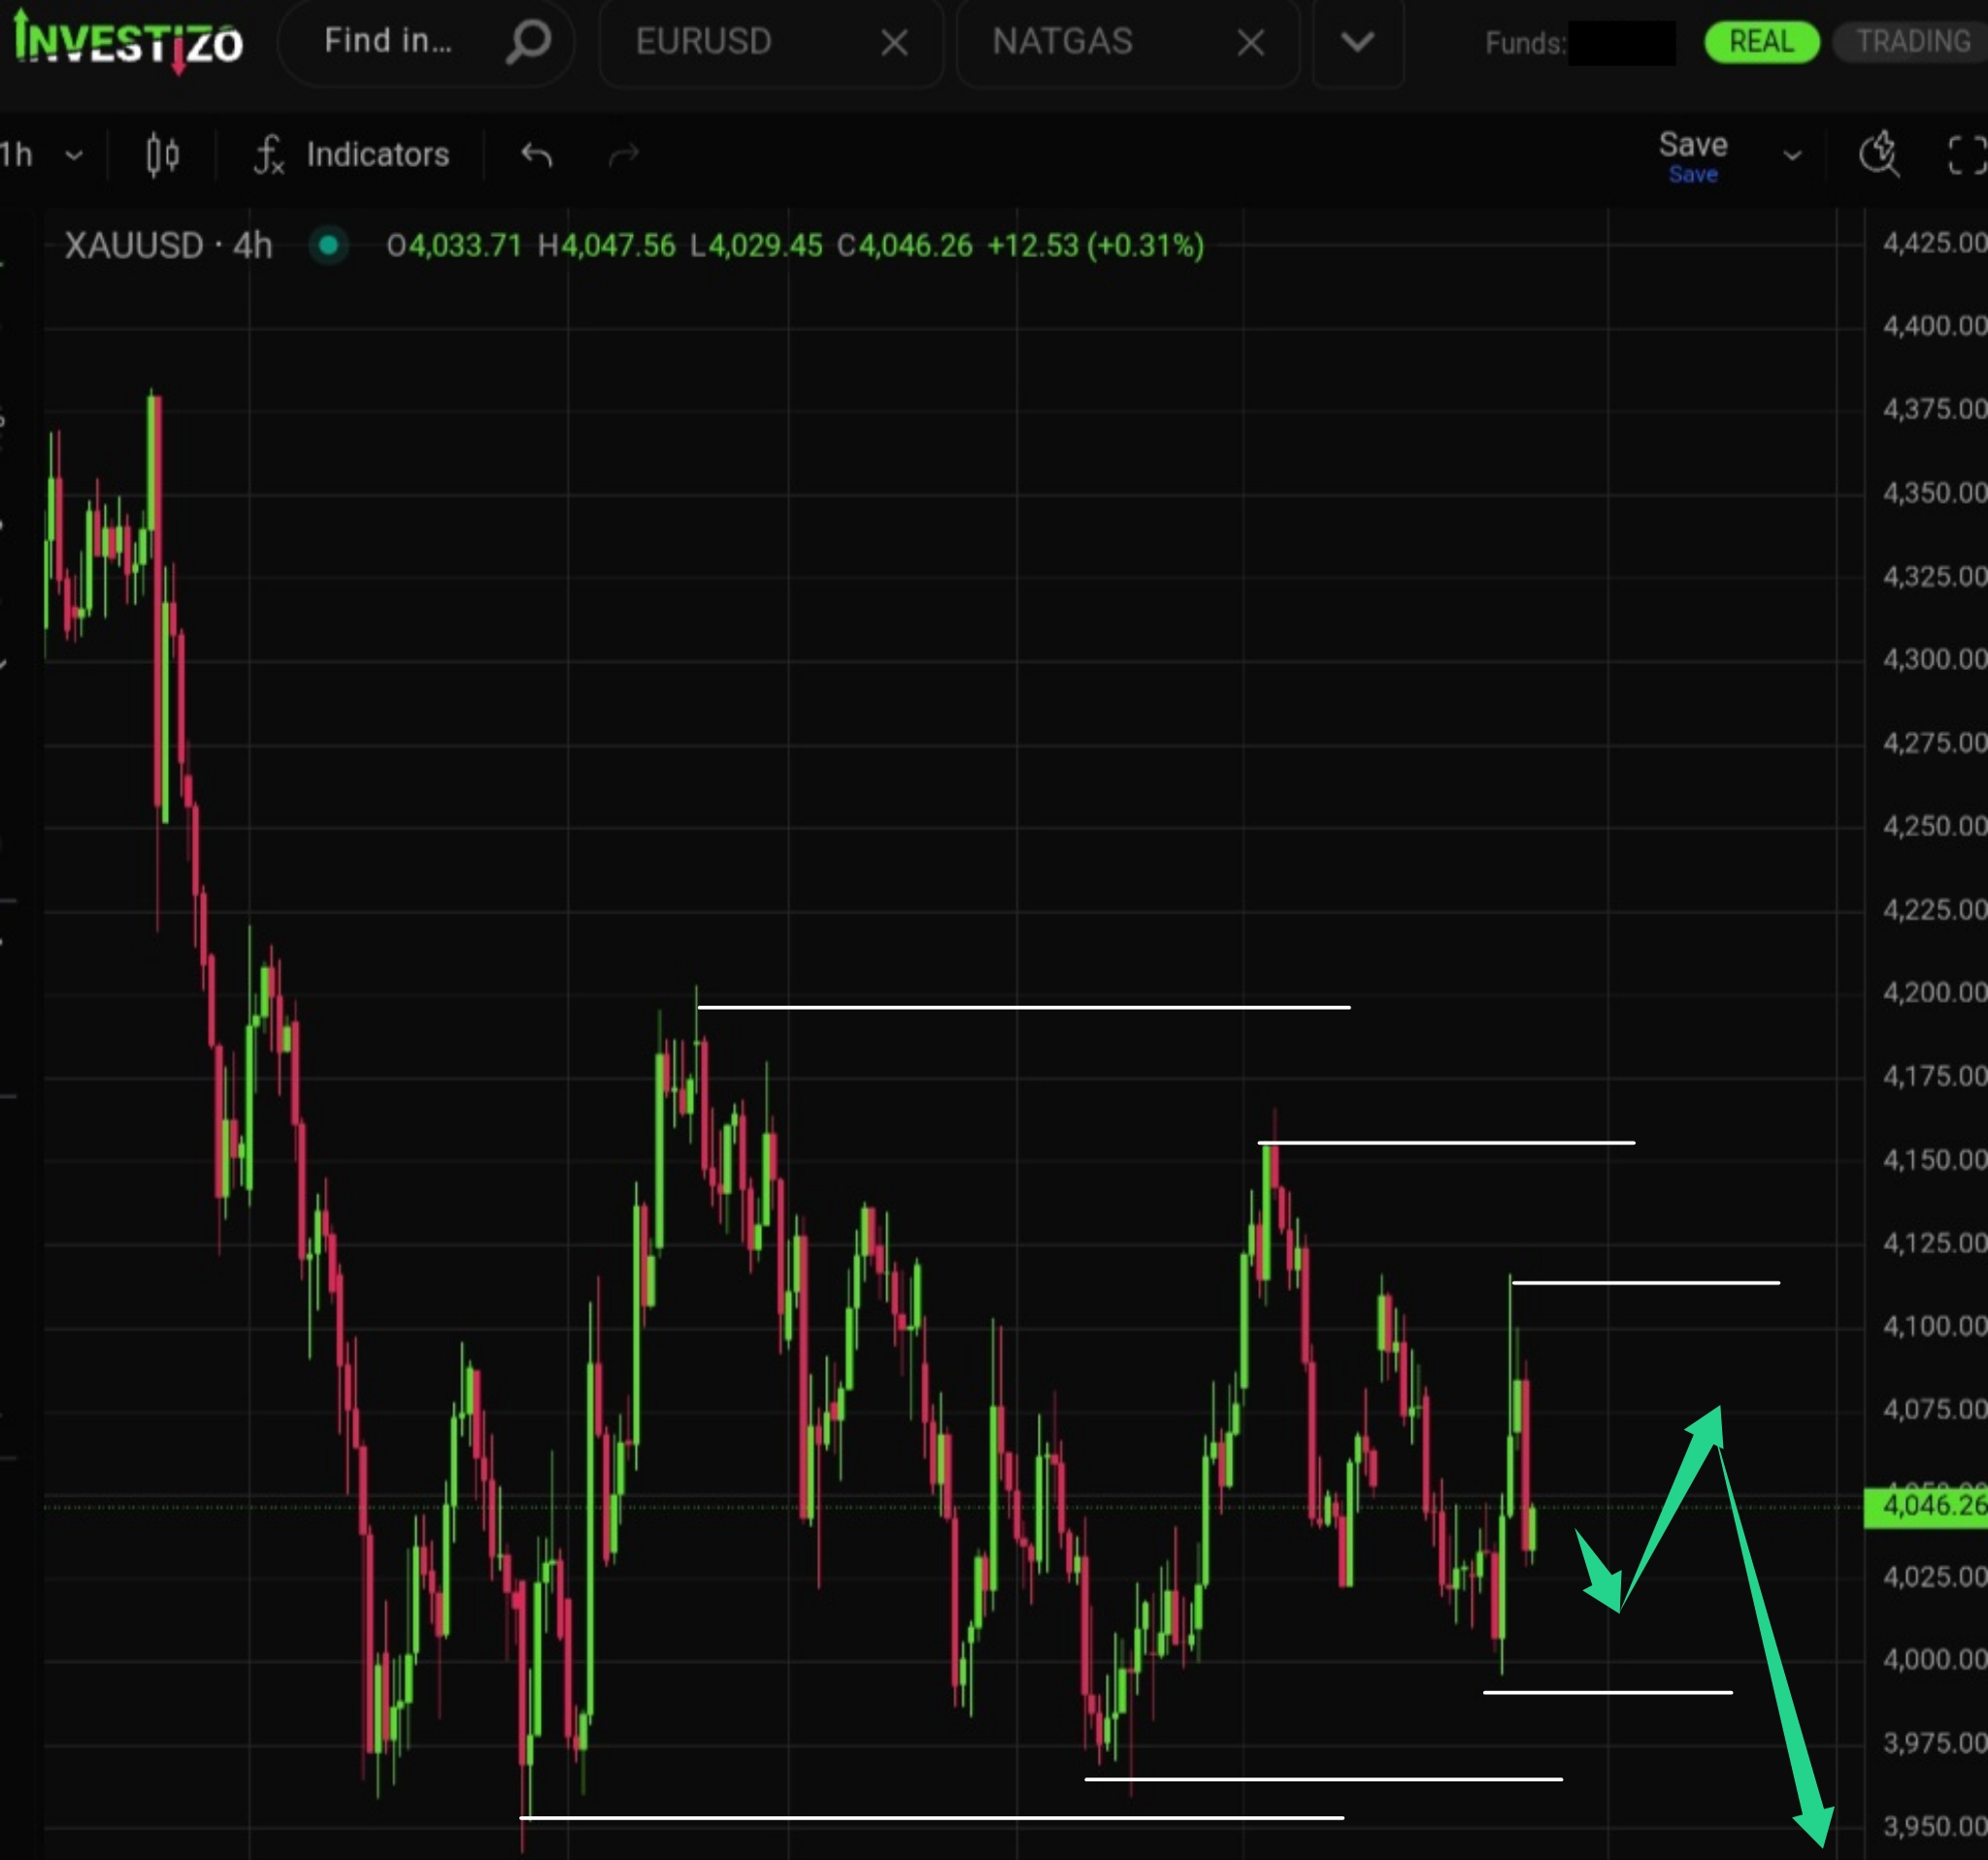
XAU/USD trades near $4,066 per ounce as bullion continues to construct a local price floor following its worst quarterly contraction since 2013, which saw spot prices drop -14%.
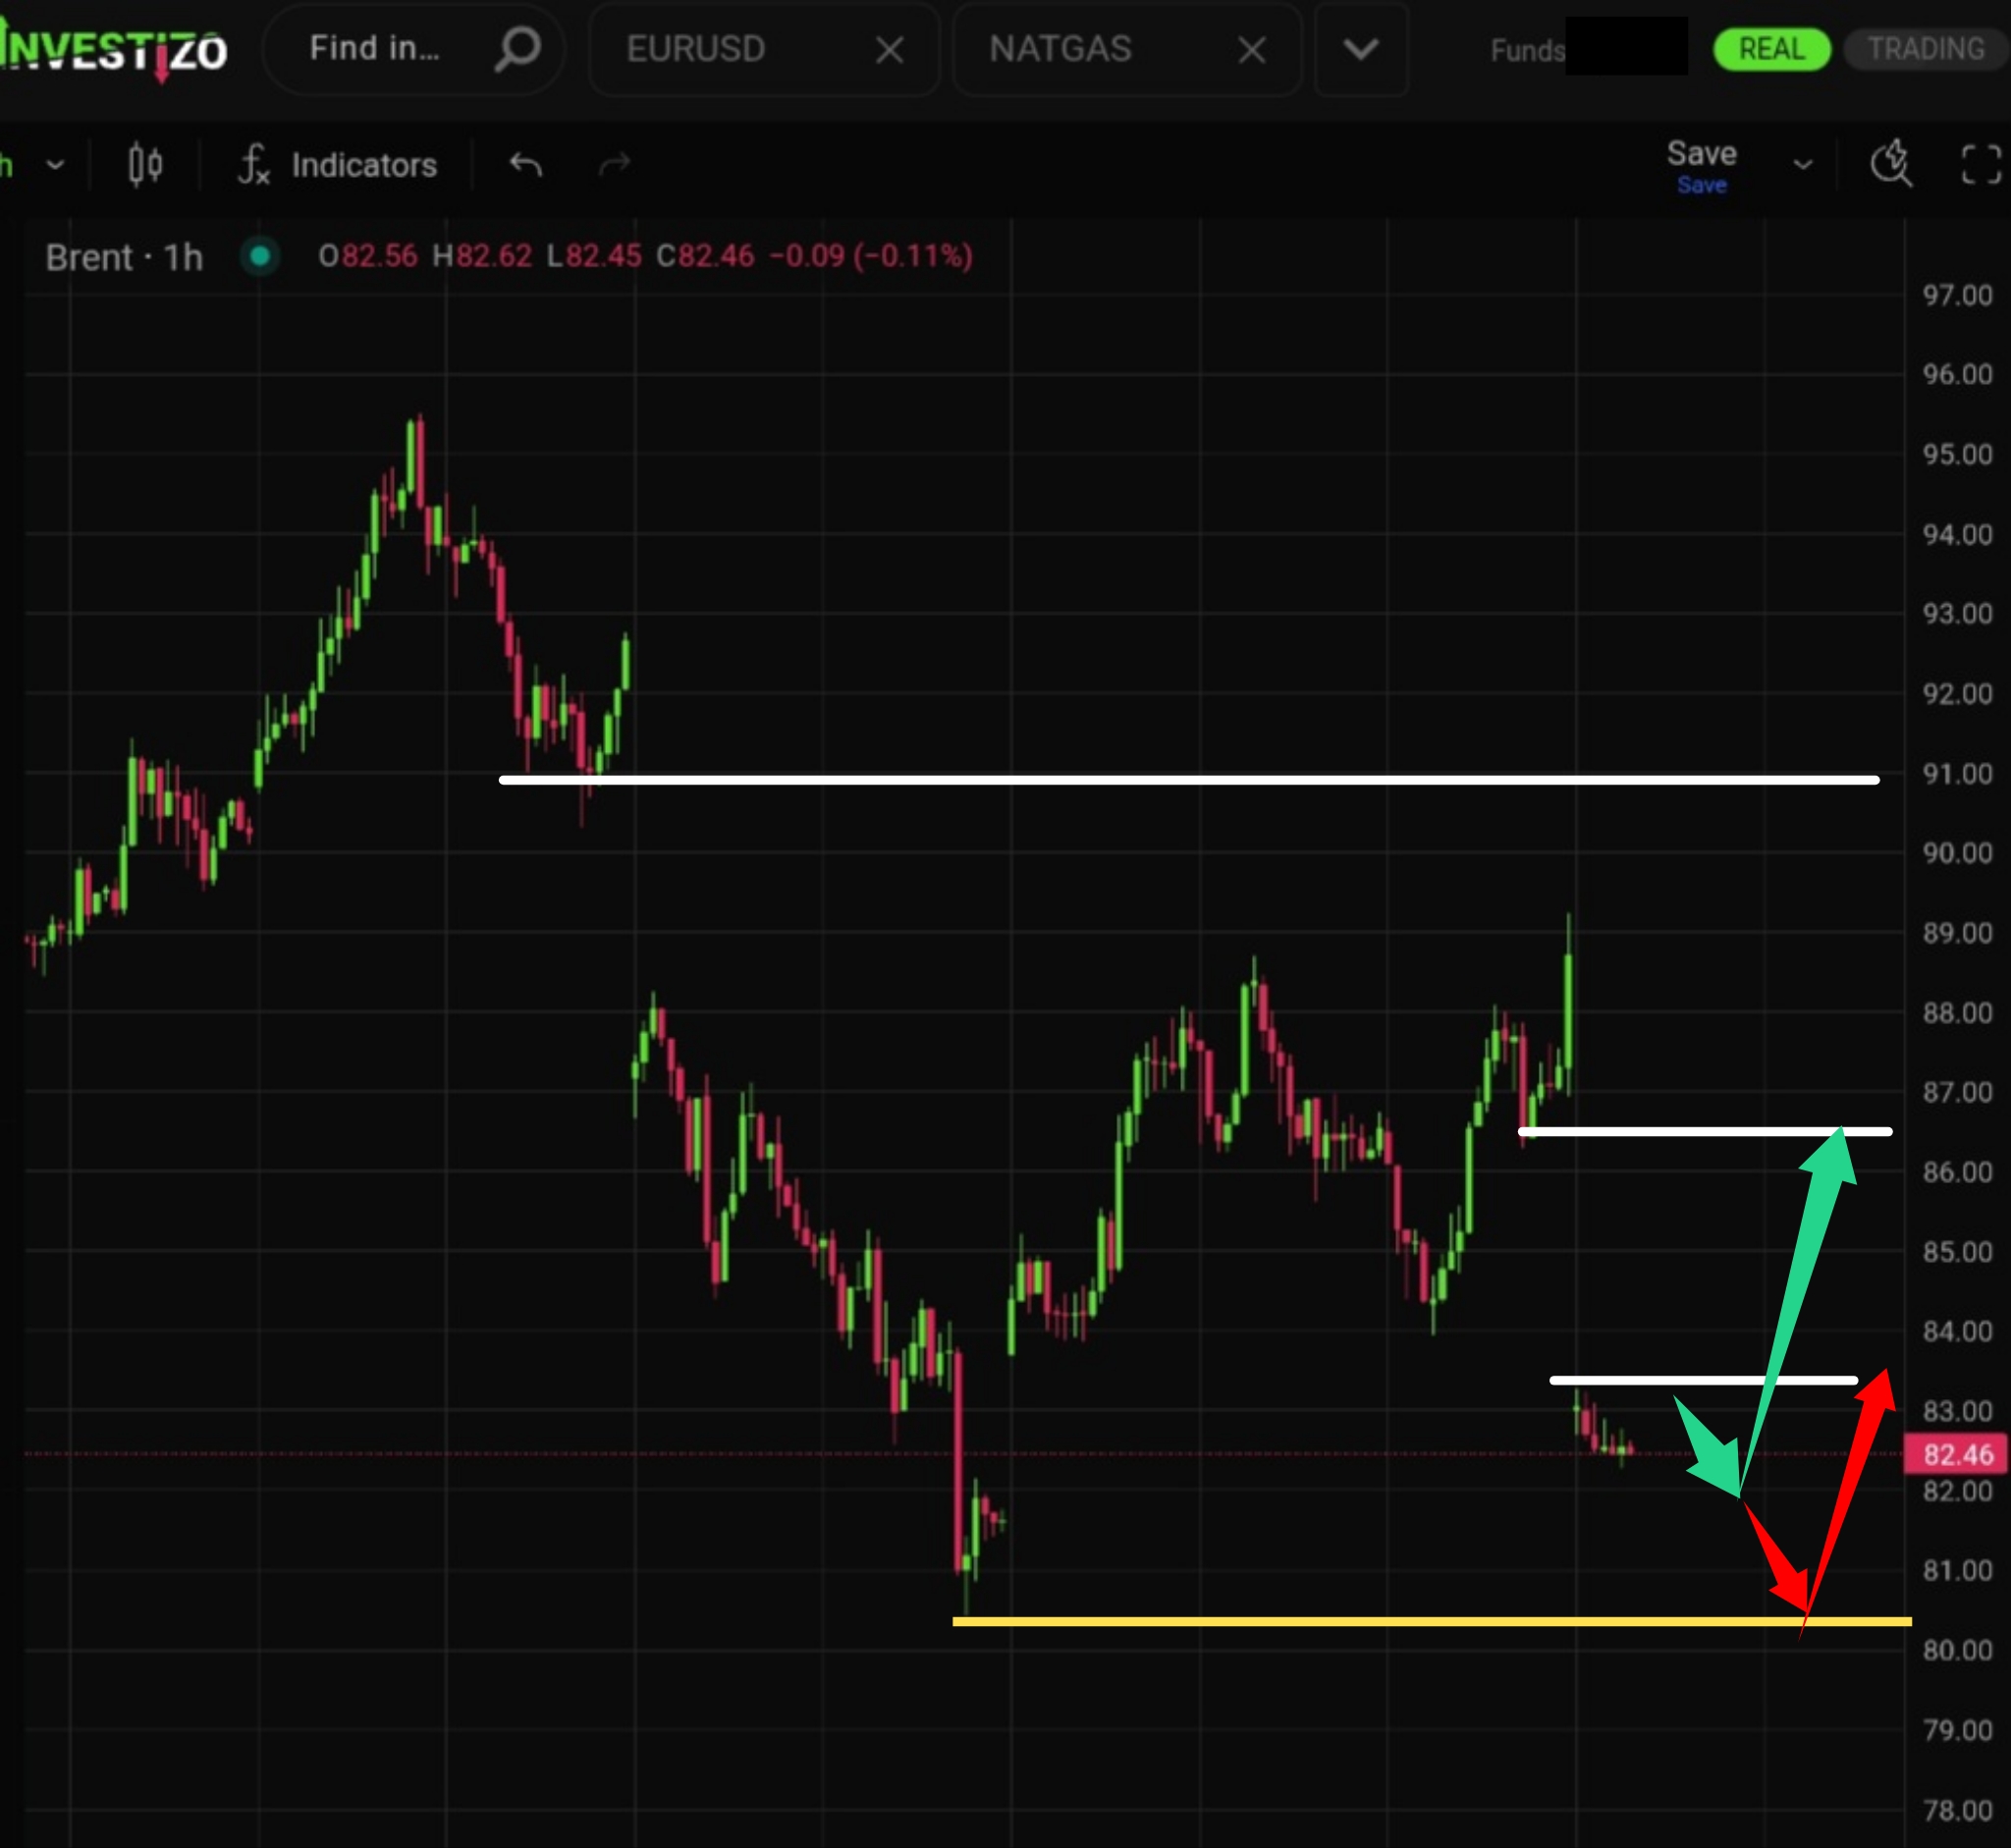
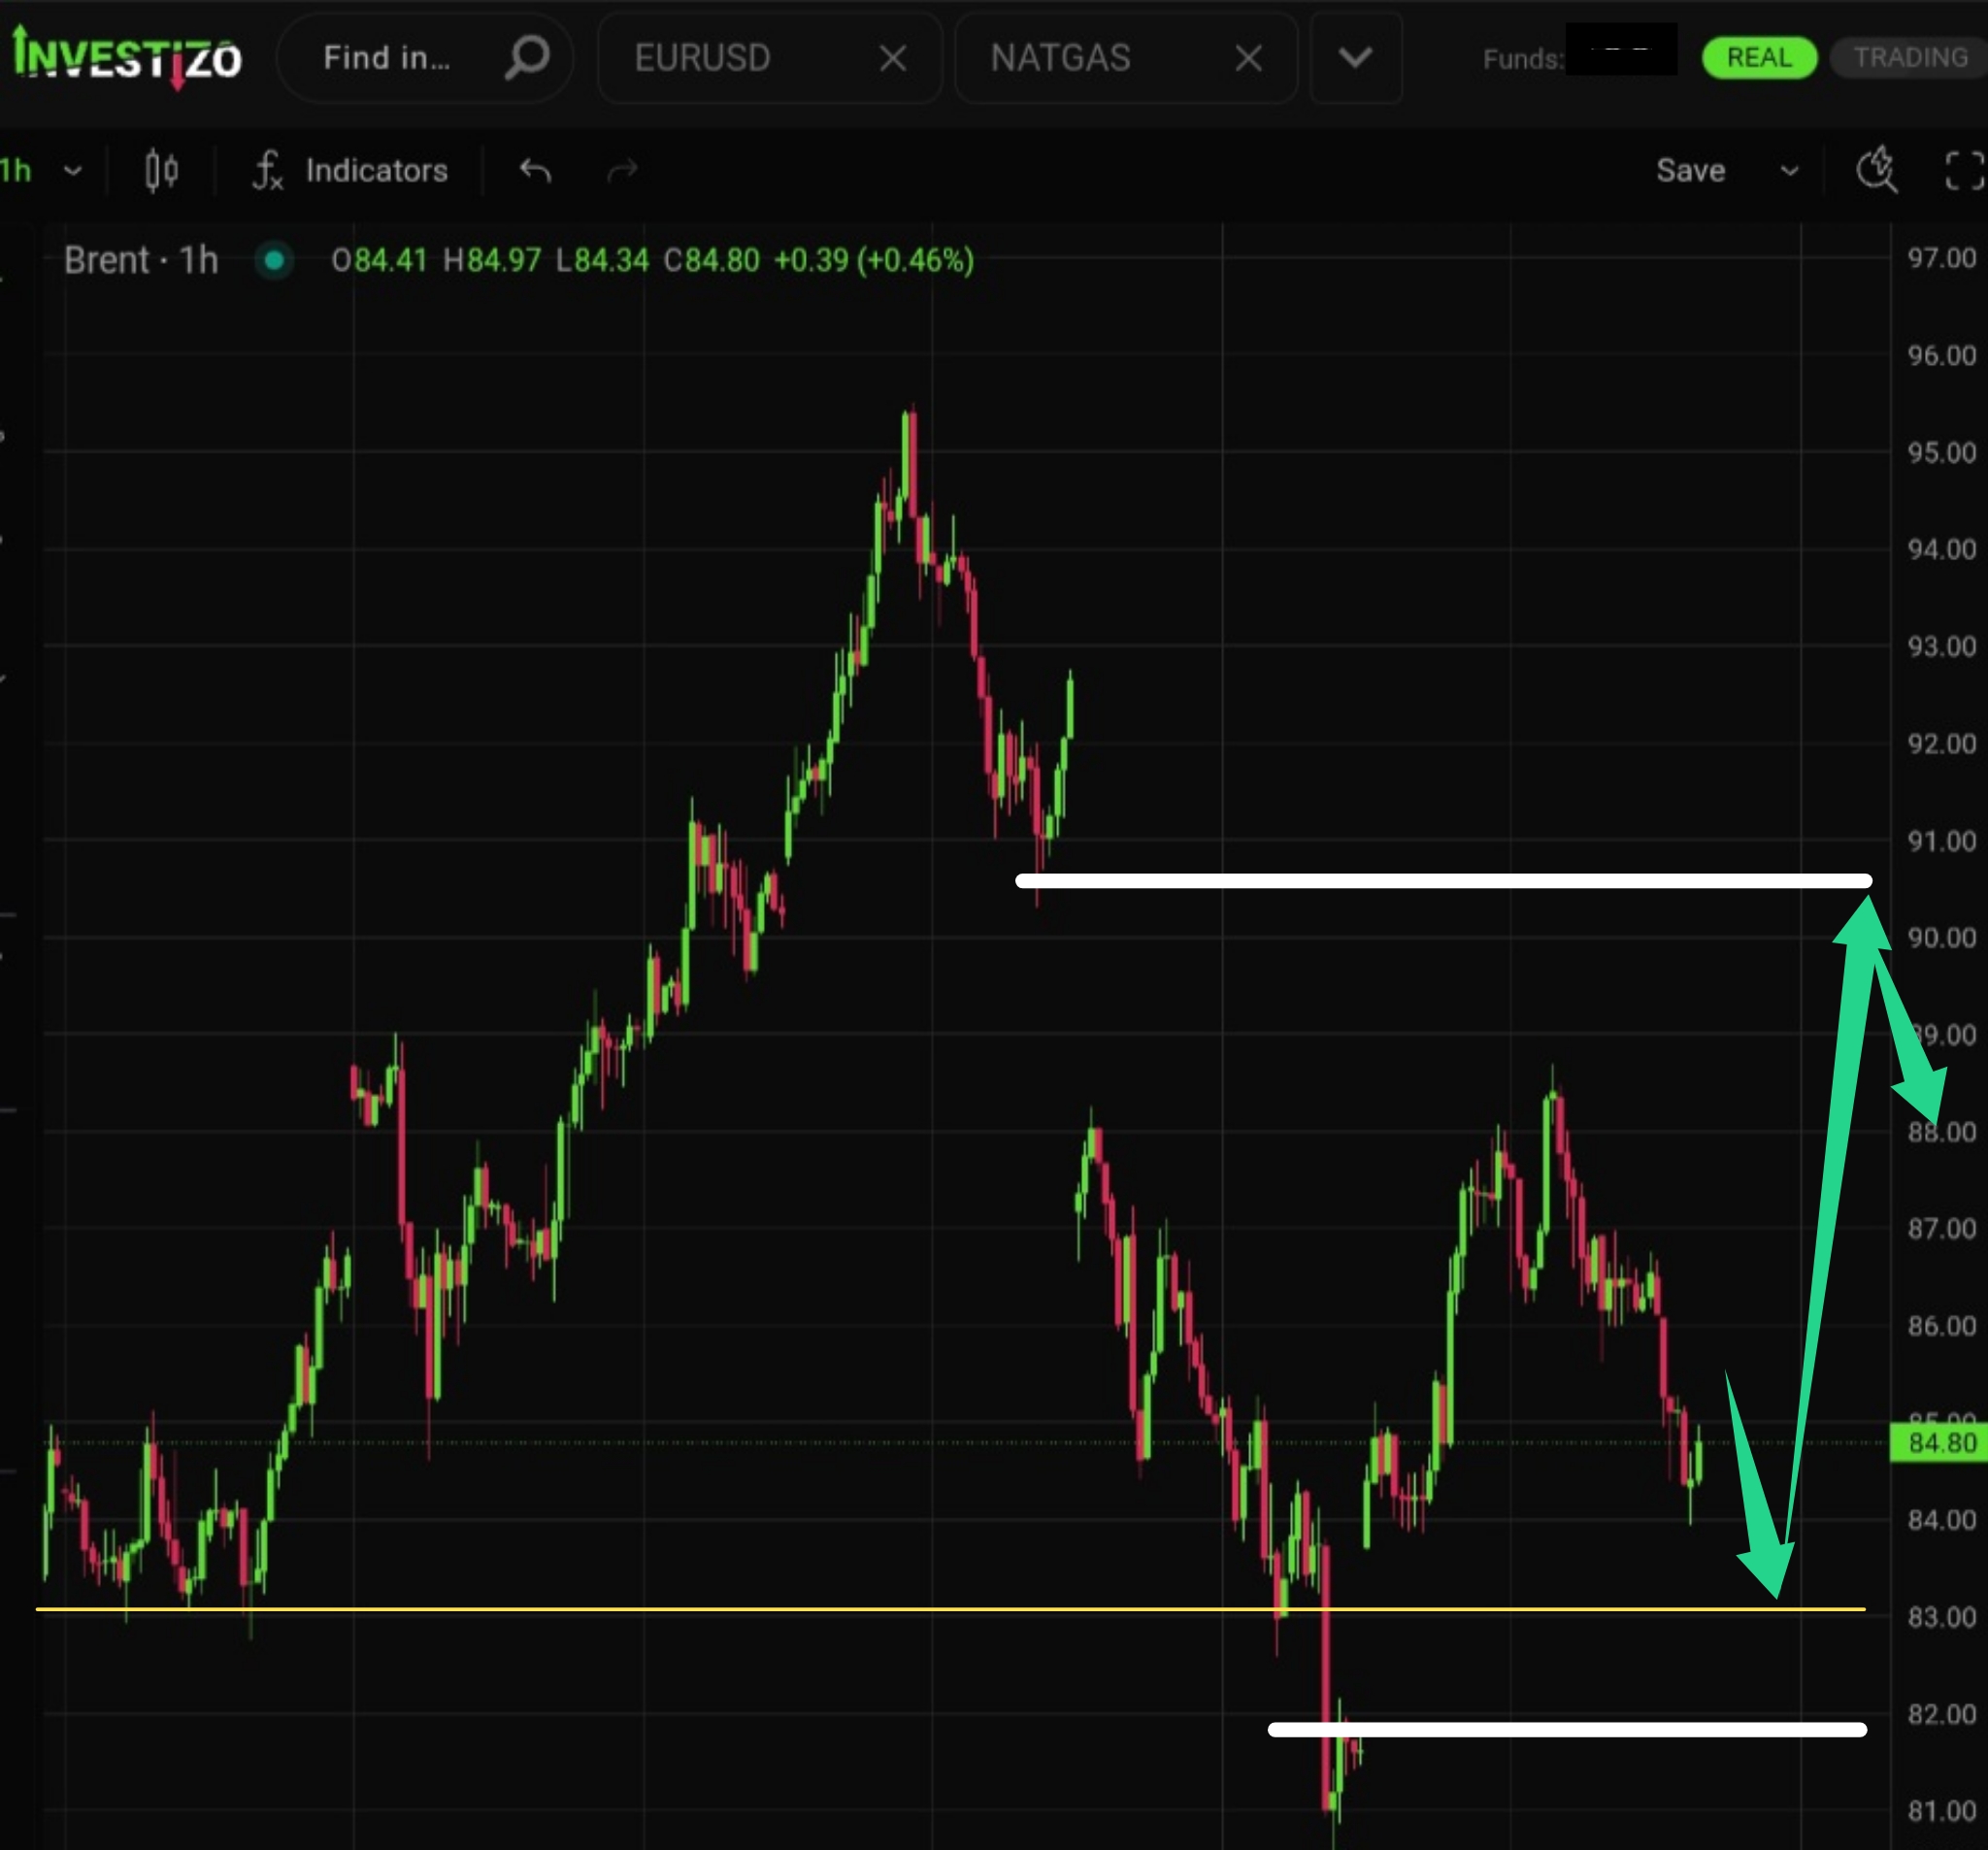
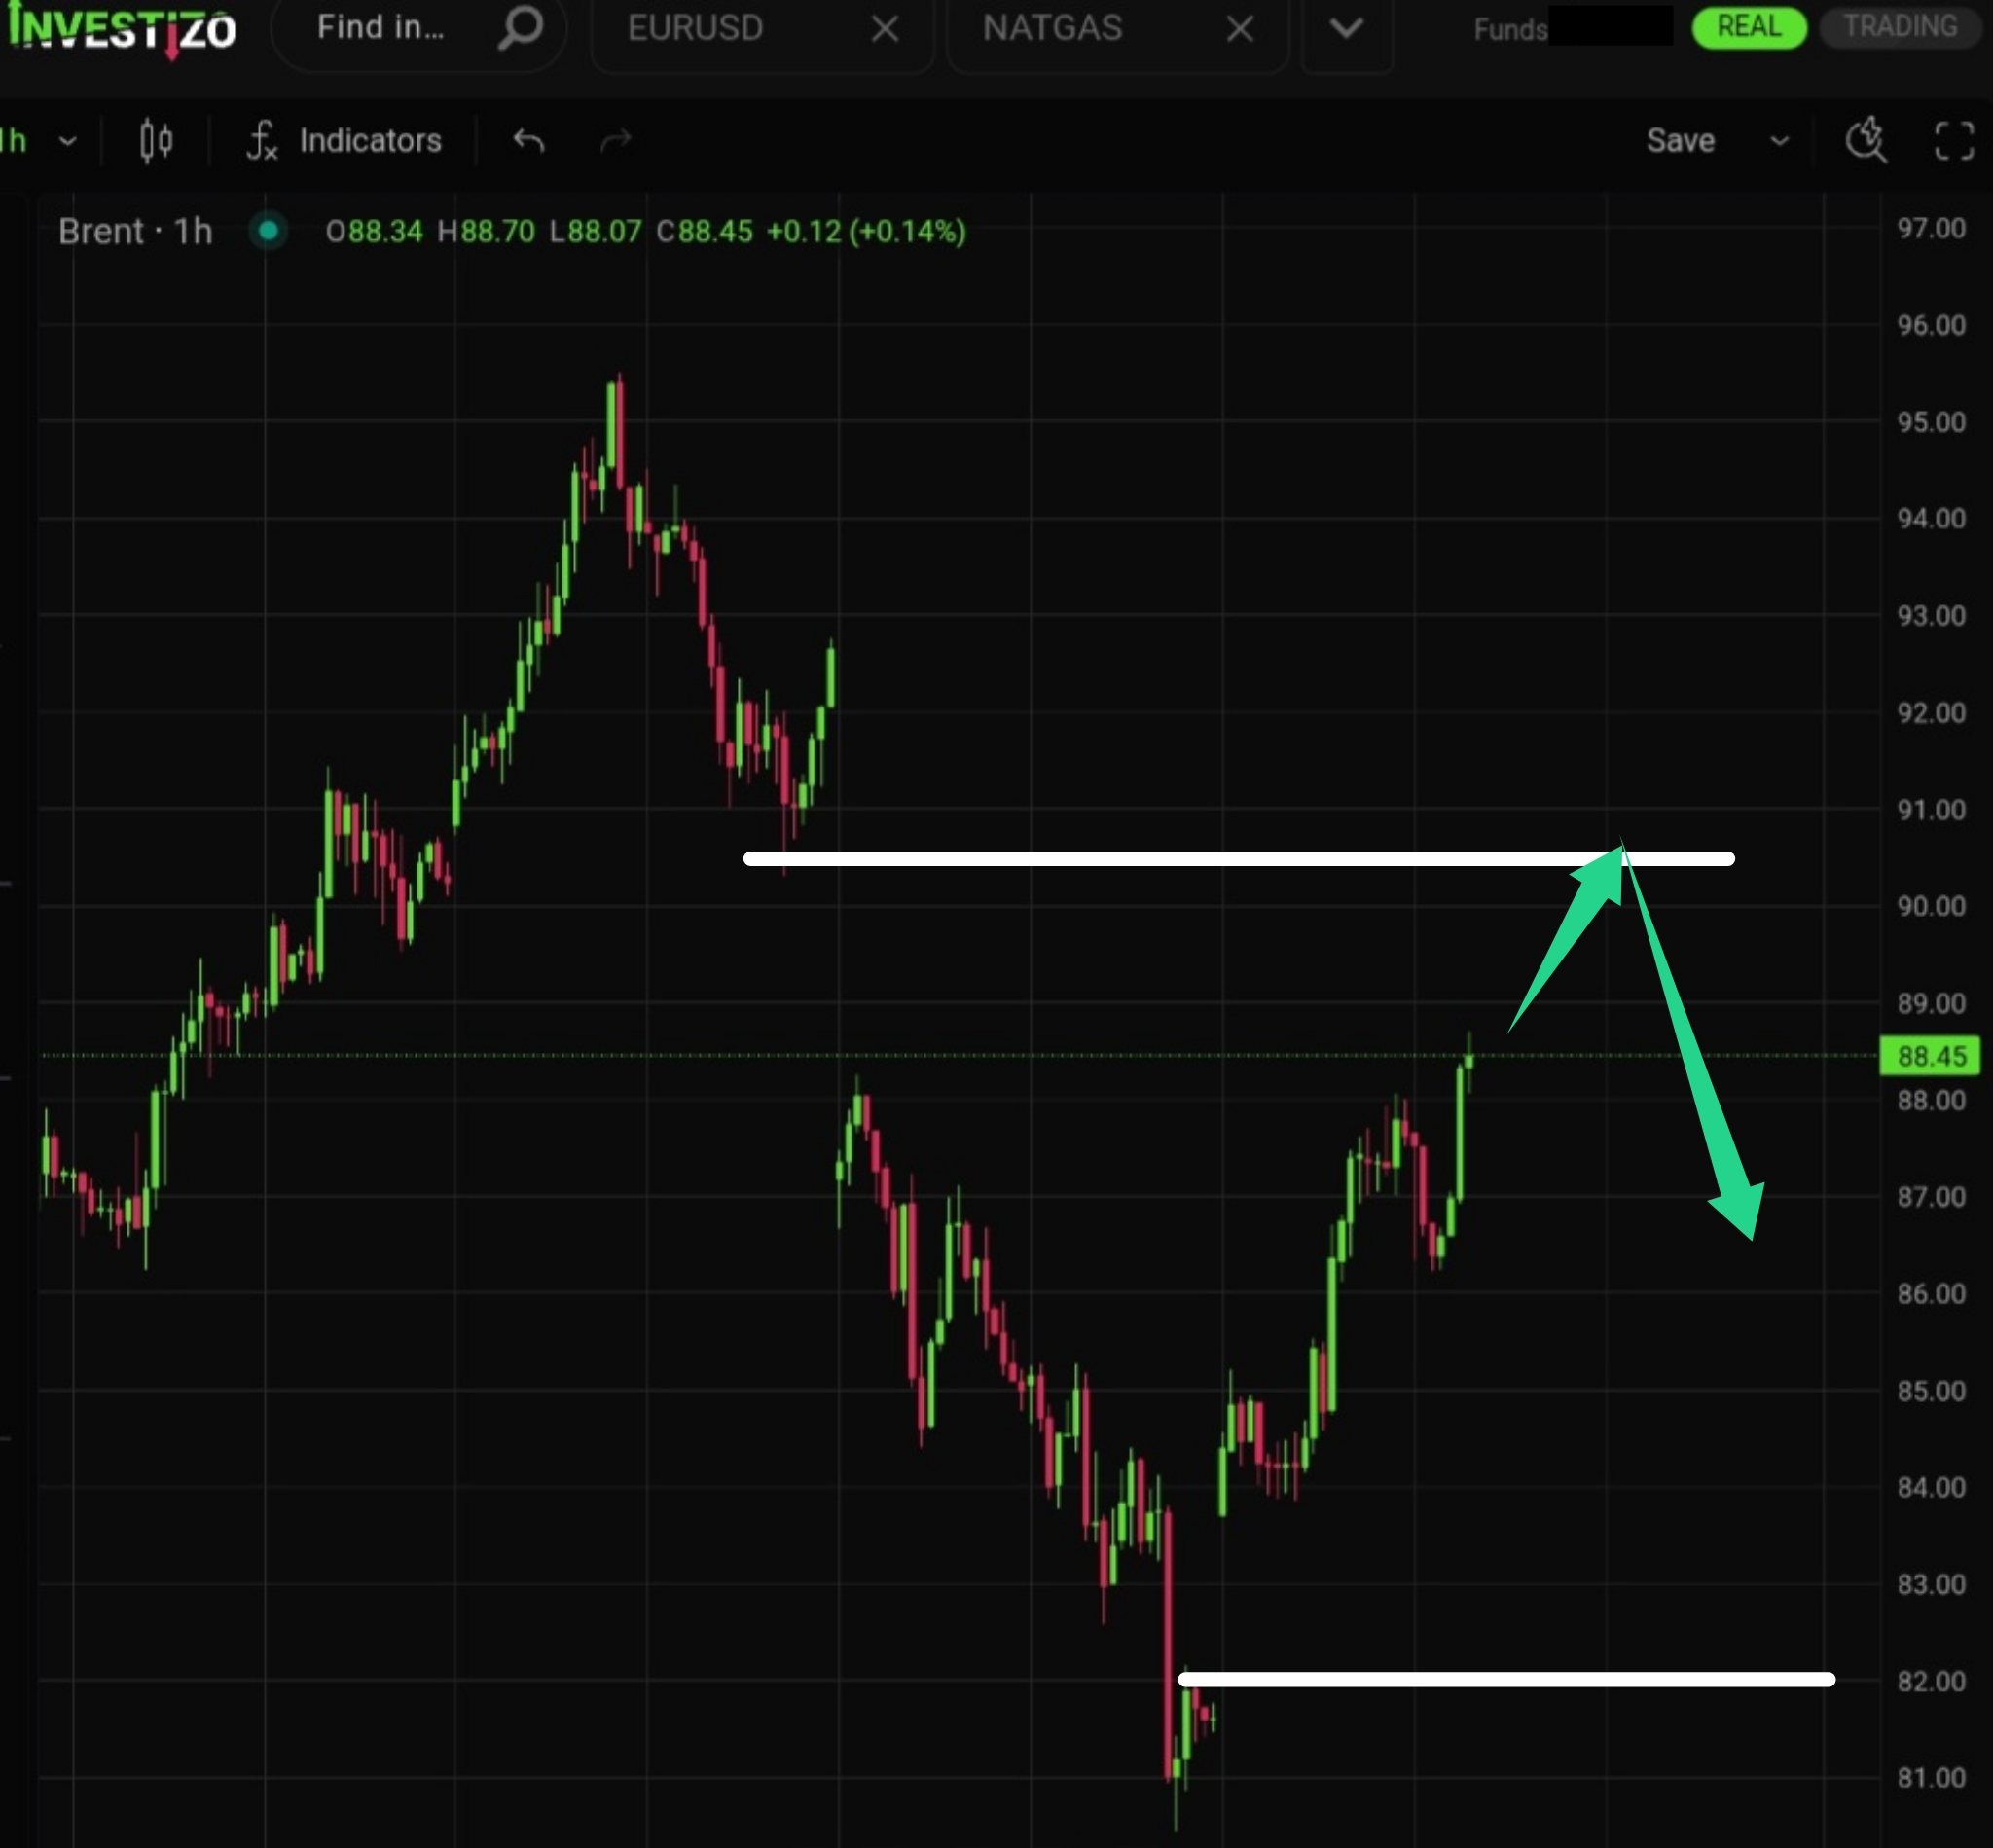
Brent Crude is trading near $82.46 per barrel, experiencing a sharp cooling off after plunging -7.3% to $81.55 in early Monday action.
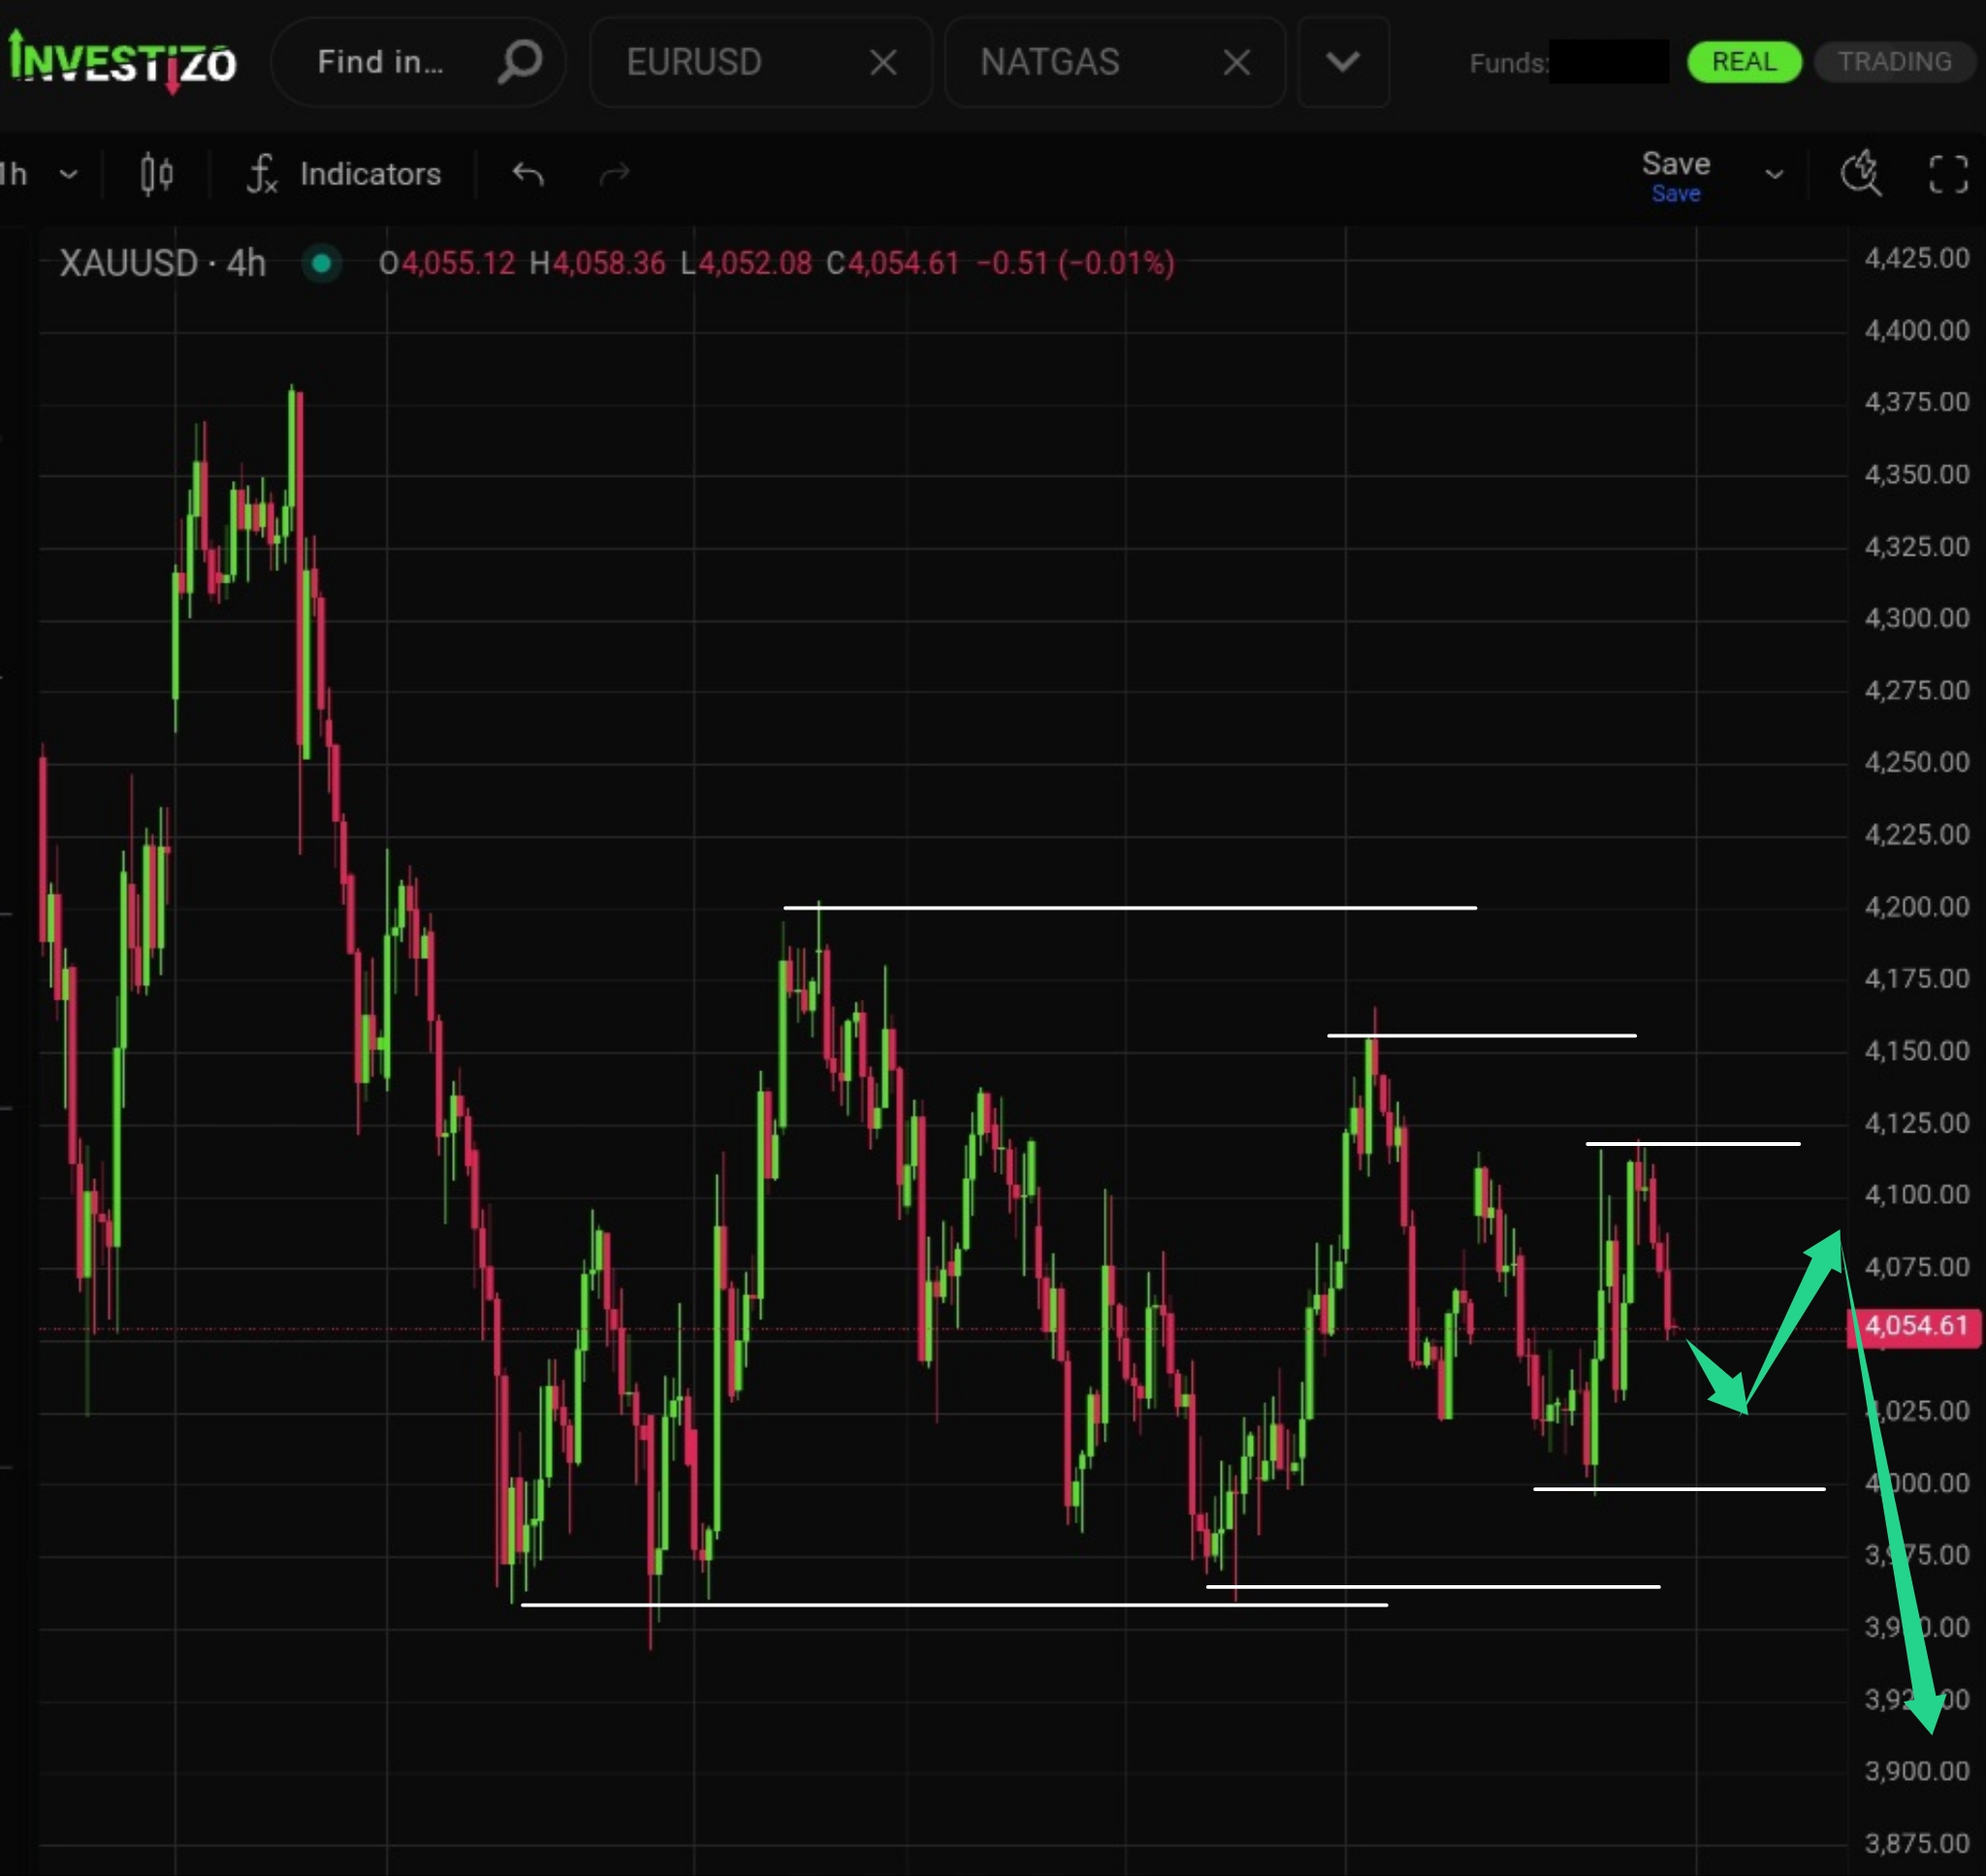
Gold’s trading range continues to contract, with limited space remaining and a bearish bias pointing toward a downside break. Key support at $4,000 remains the critical level to watch, with the primary move expected after the weekend.
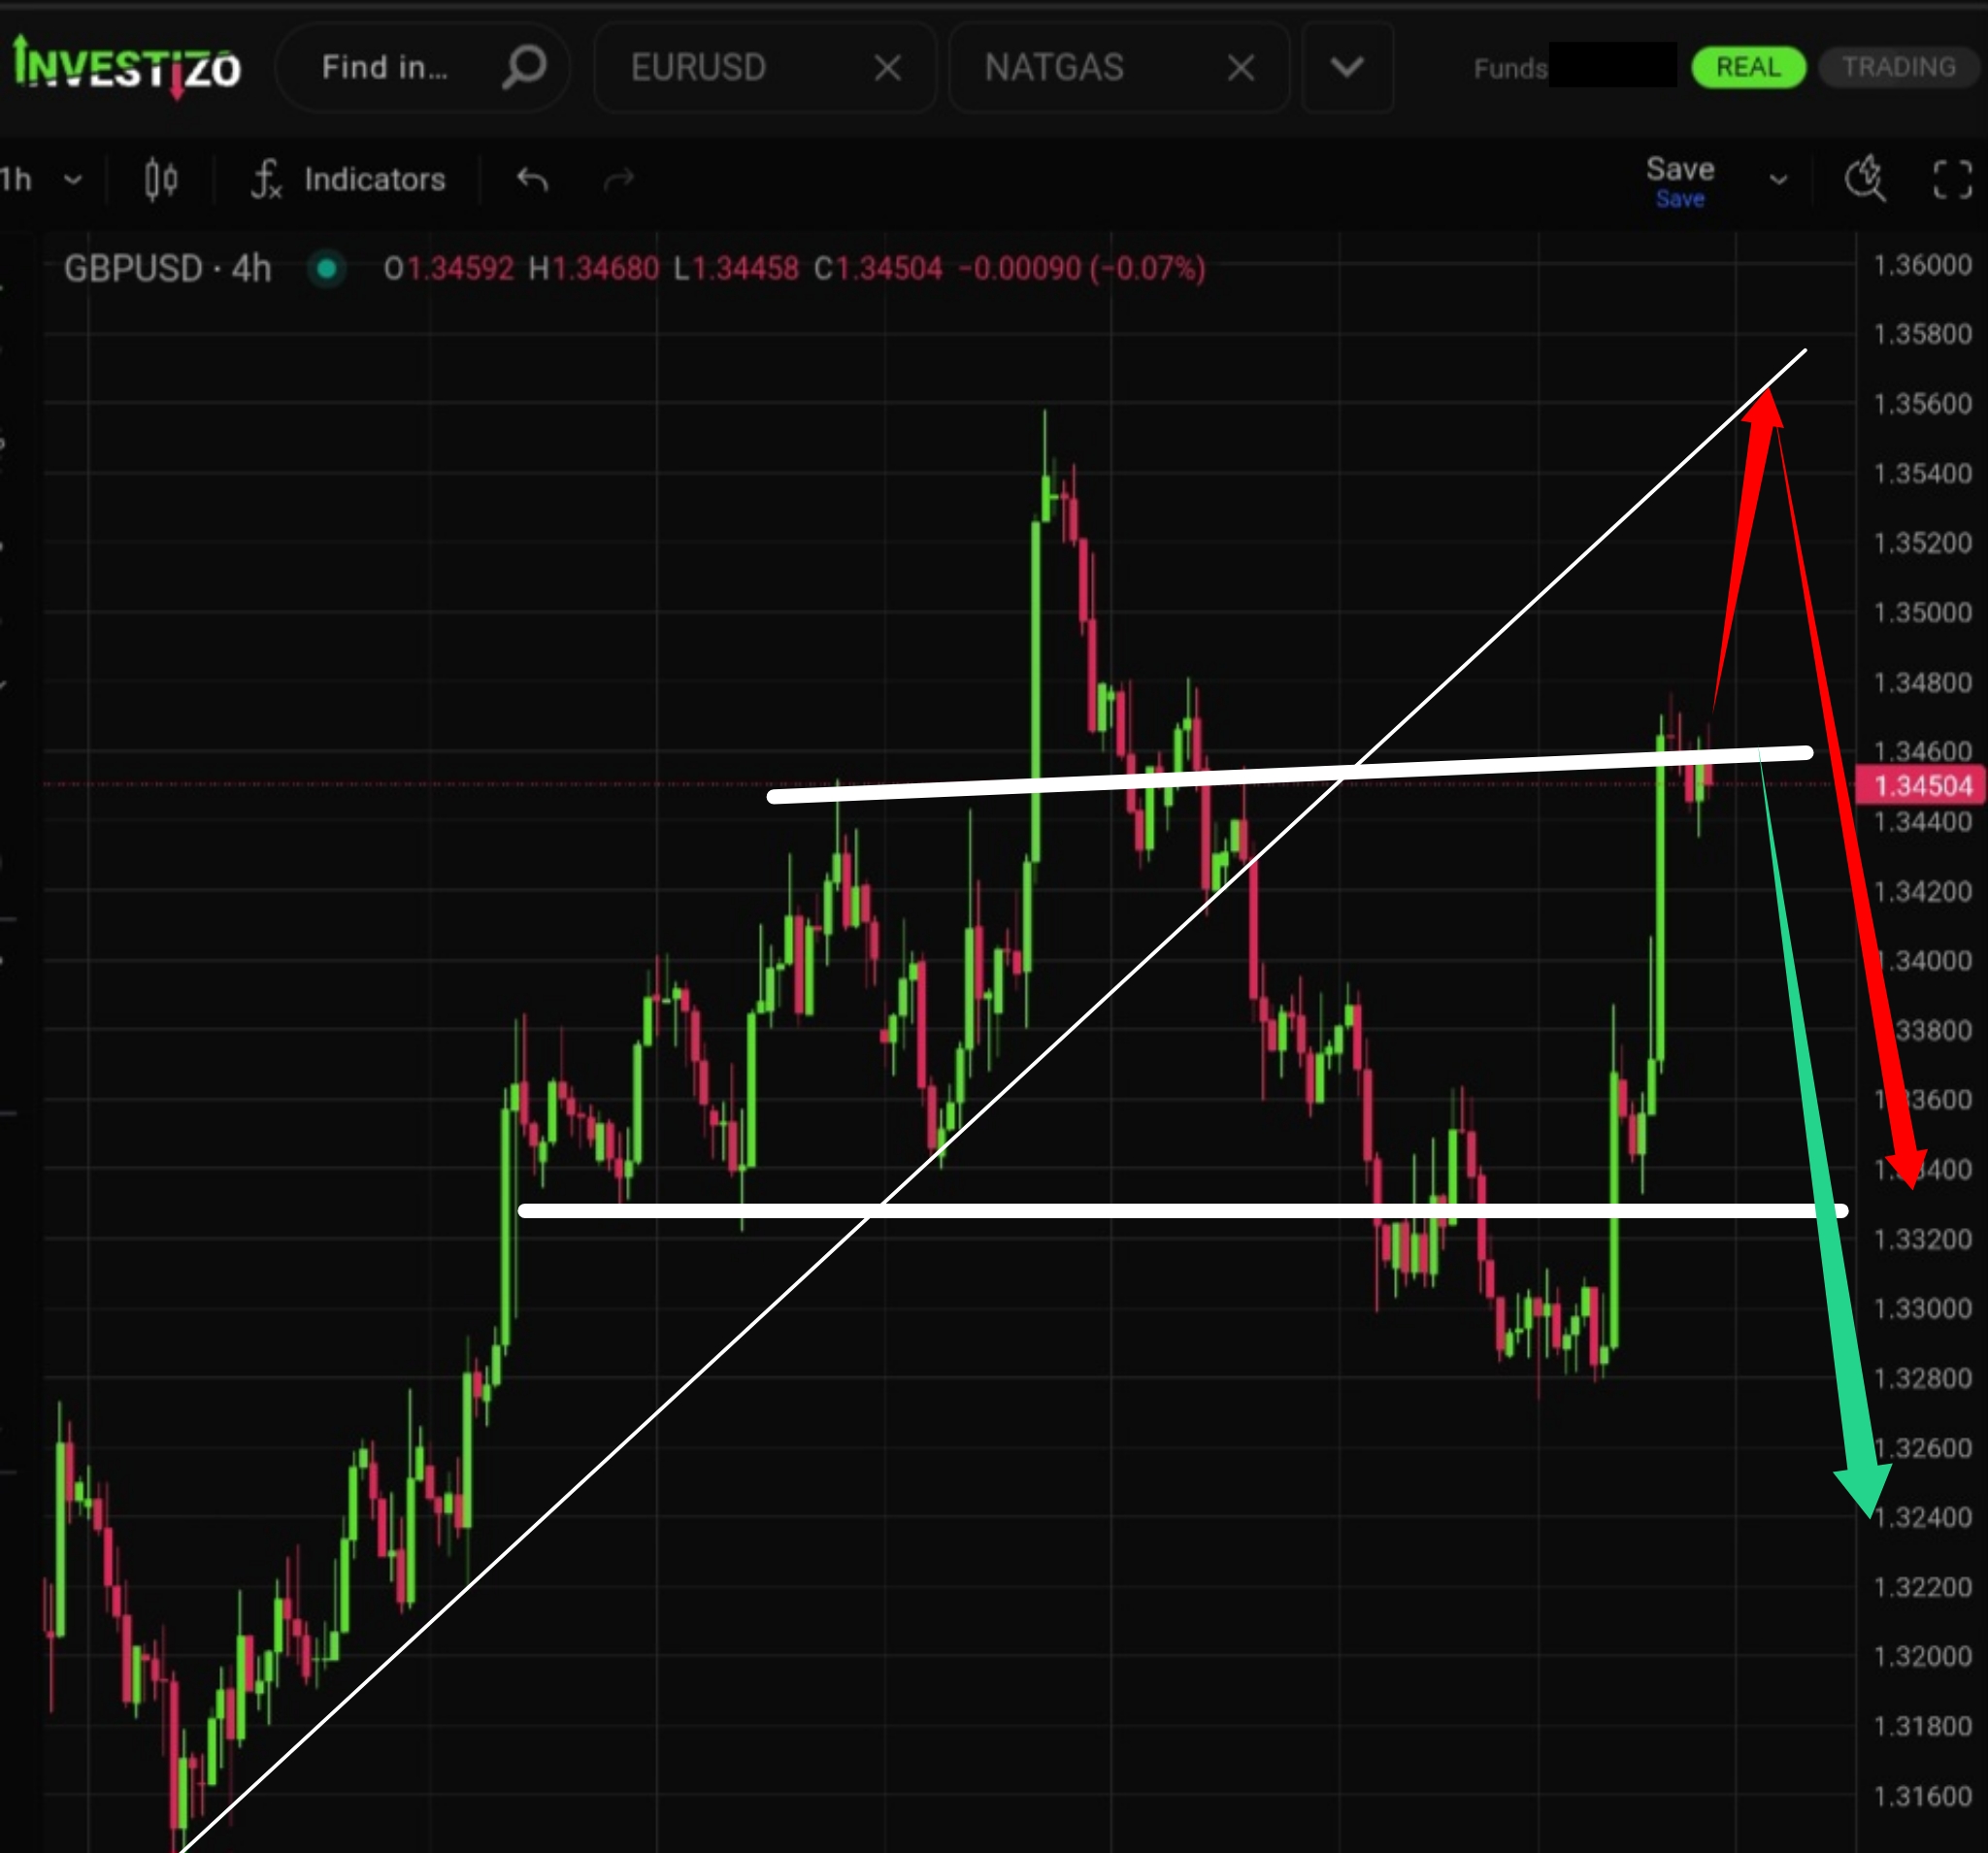
GBP/USD is testing the critical 1.3450–1.3460 supply zone that previously generated an Over&Under reversal. A confirmed rejection would open the path toward 1.3300, while a break higher targets the next confluence area near 1.3550–1.3560.
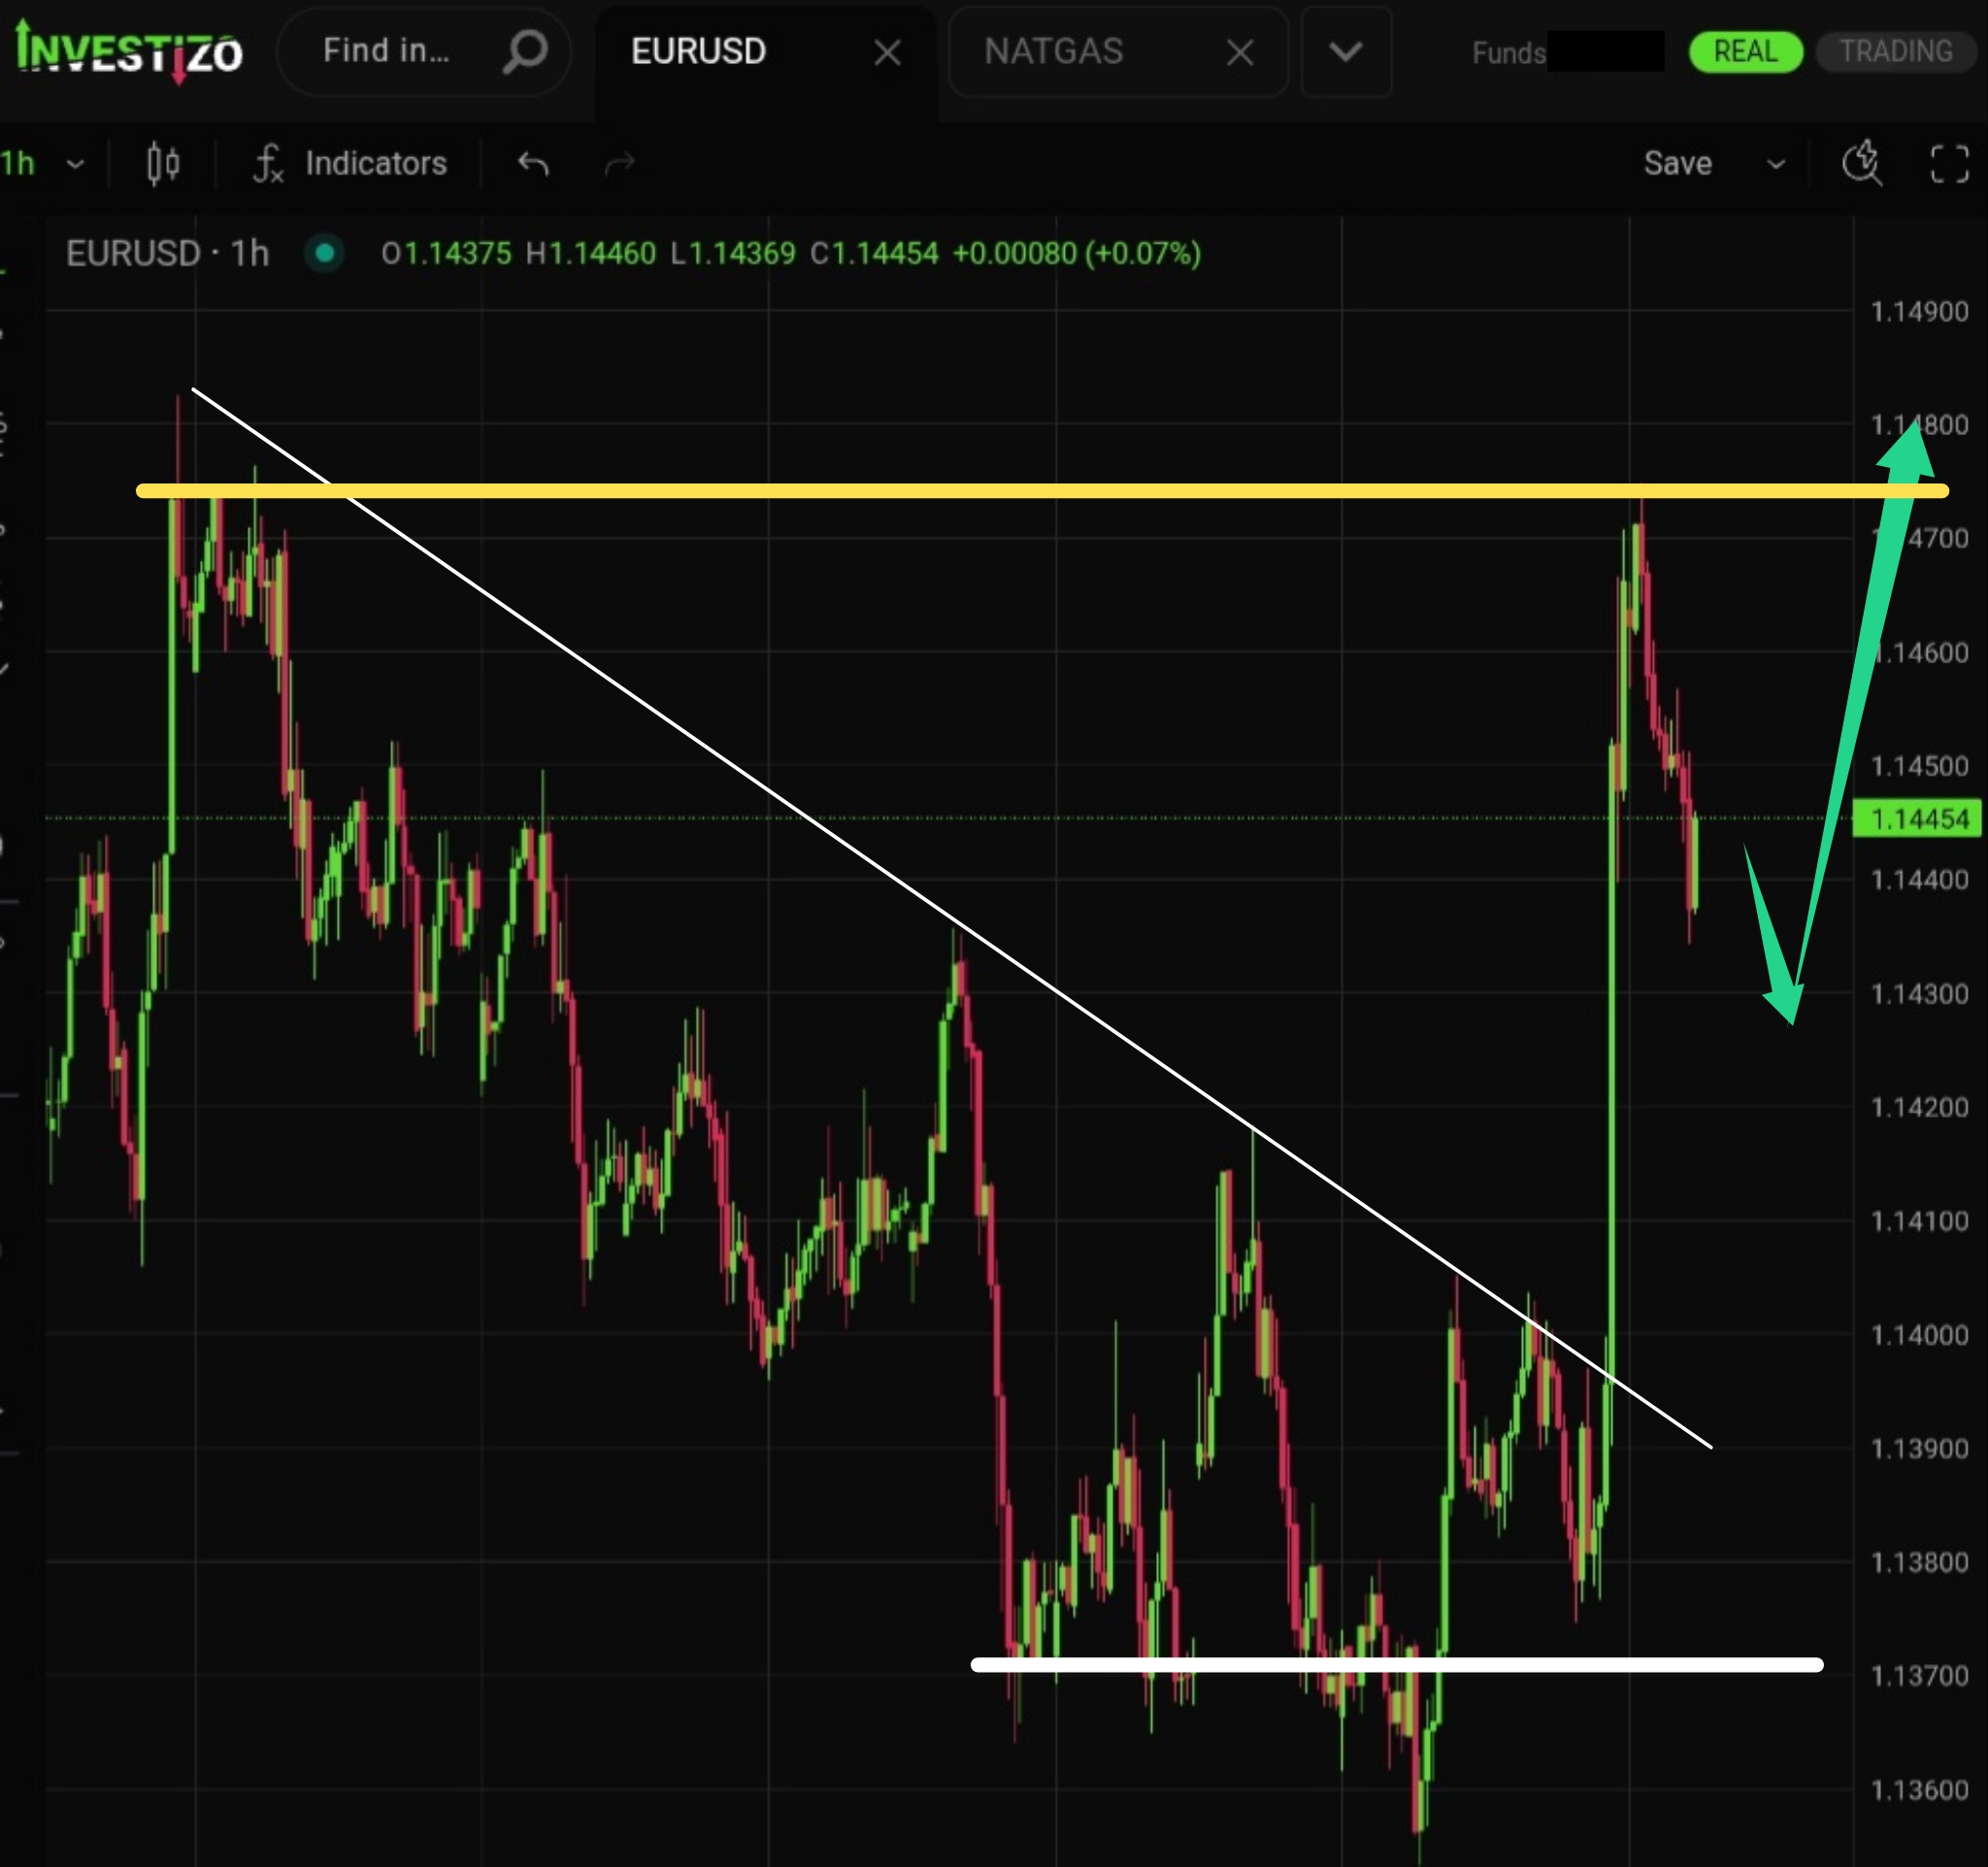
EUR/USD is forming a bullish flag within its medium-term uptrend, with a potential 100-pip advance targeting 1.1600 if confirmed. Buy signals near 1.1490–1.1500 remain valid but may be postponed into the following week.
Brent crude remains highly volatile amid conflicting reports from the Iran–US confrontation, repeatedly opening and filling price gaps. Attention is focused on the $83.00 and $90.50 levels as the boundaries of the current trading range.
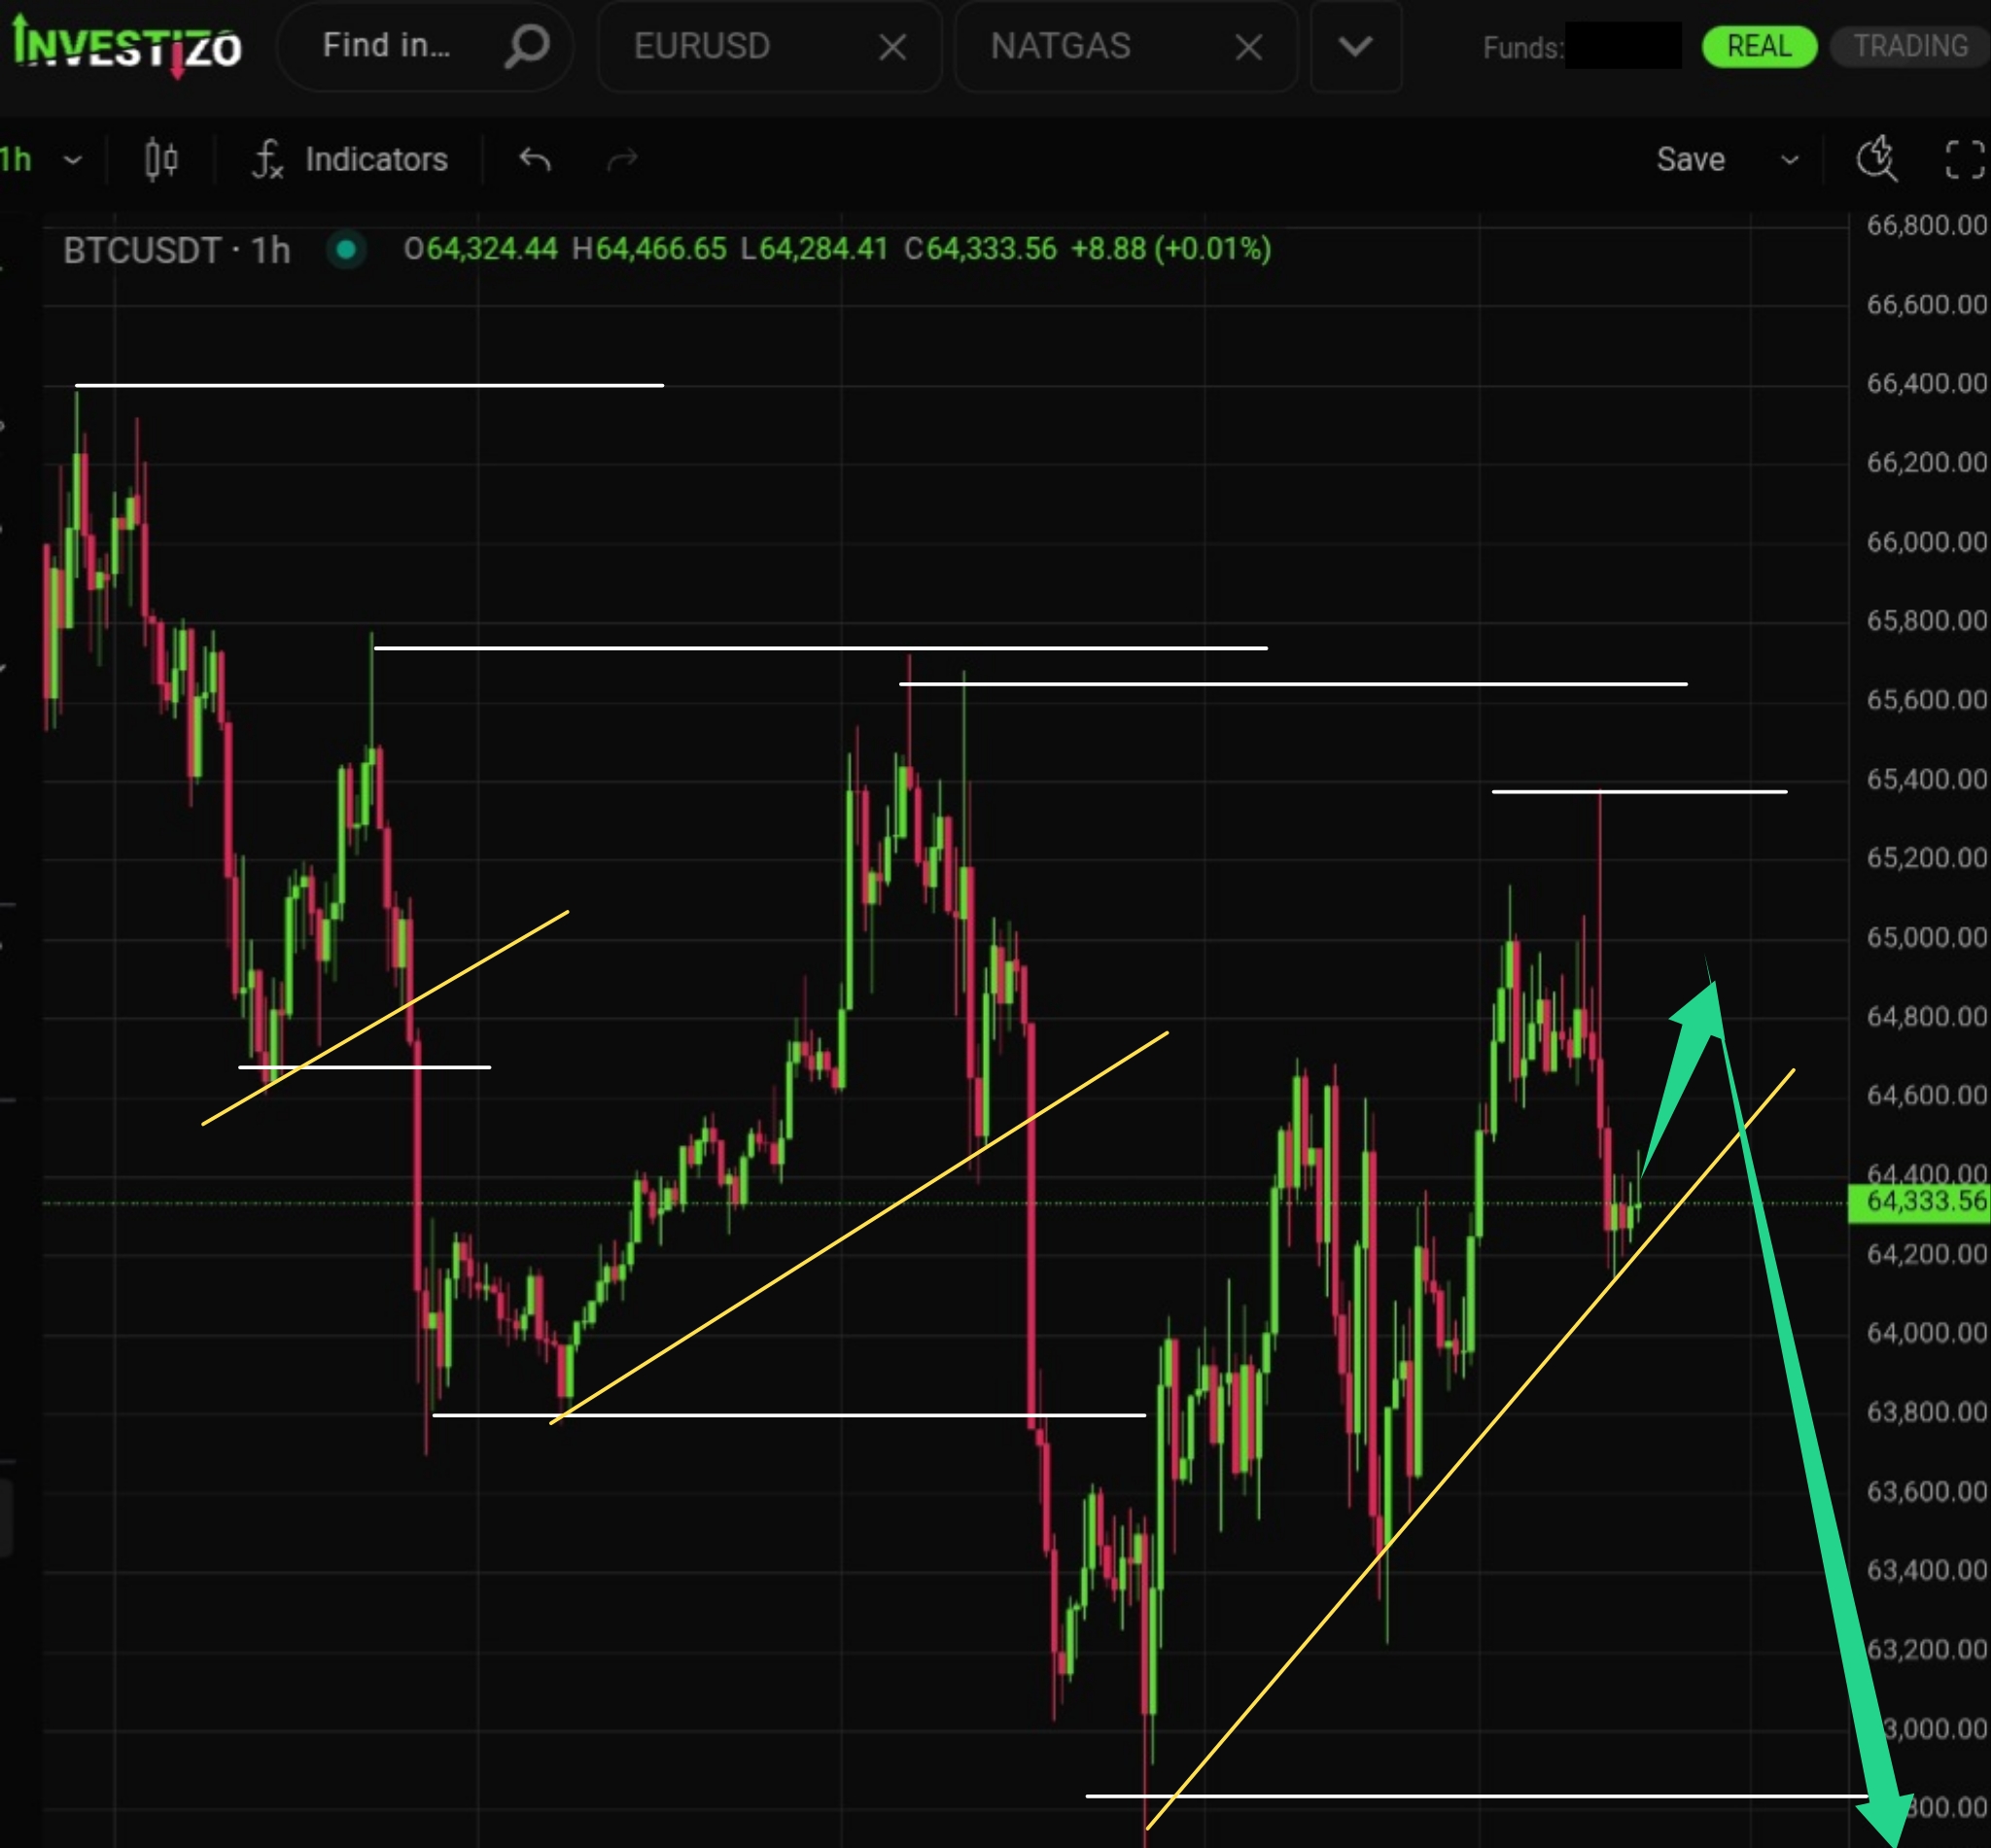
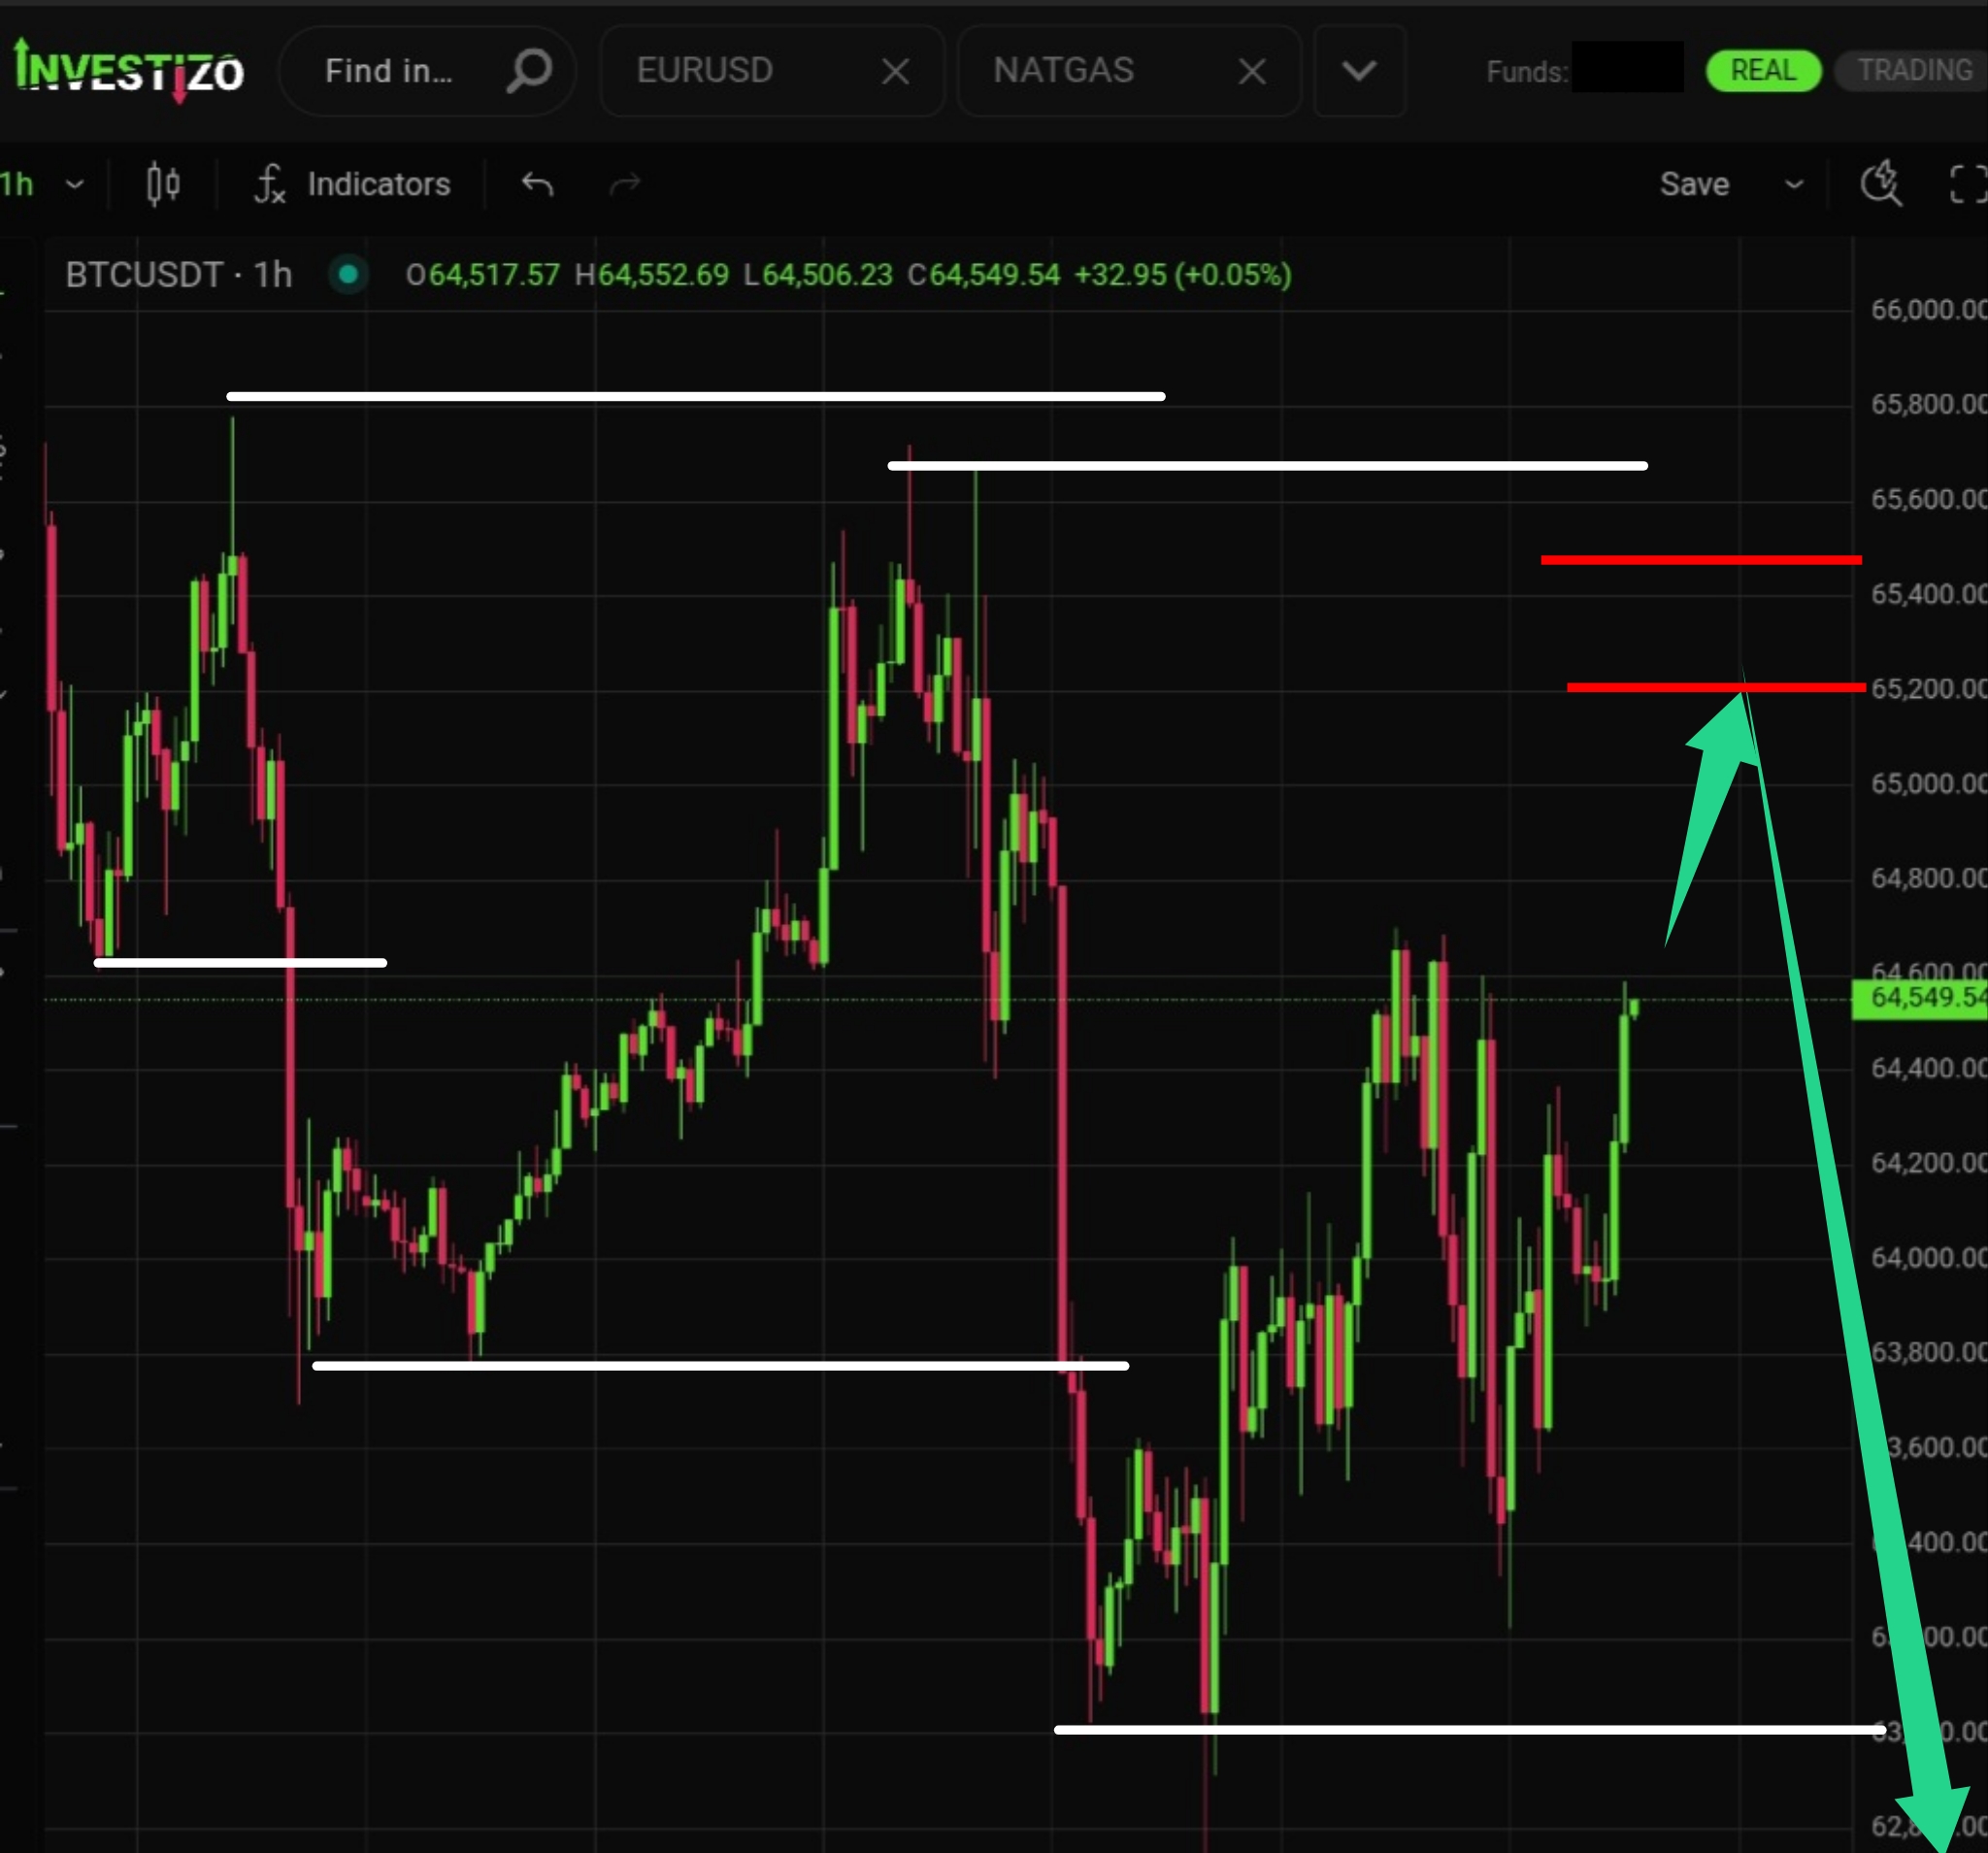
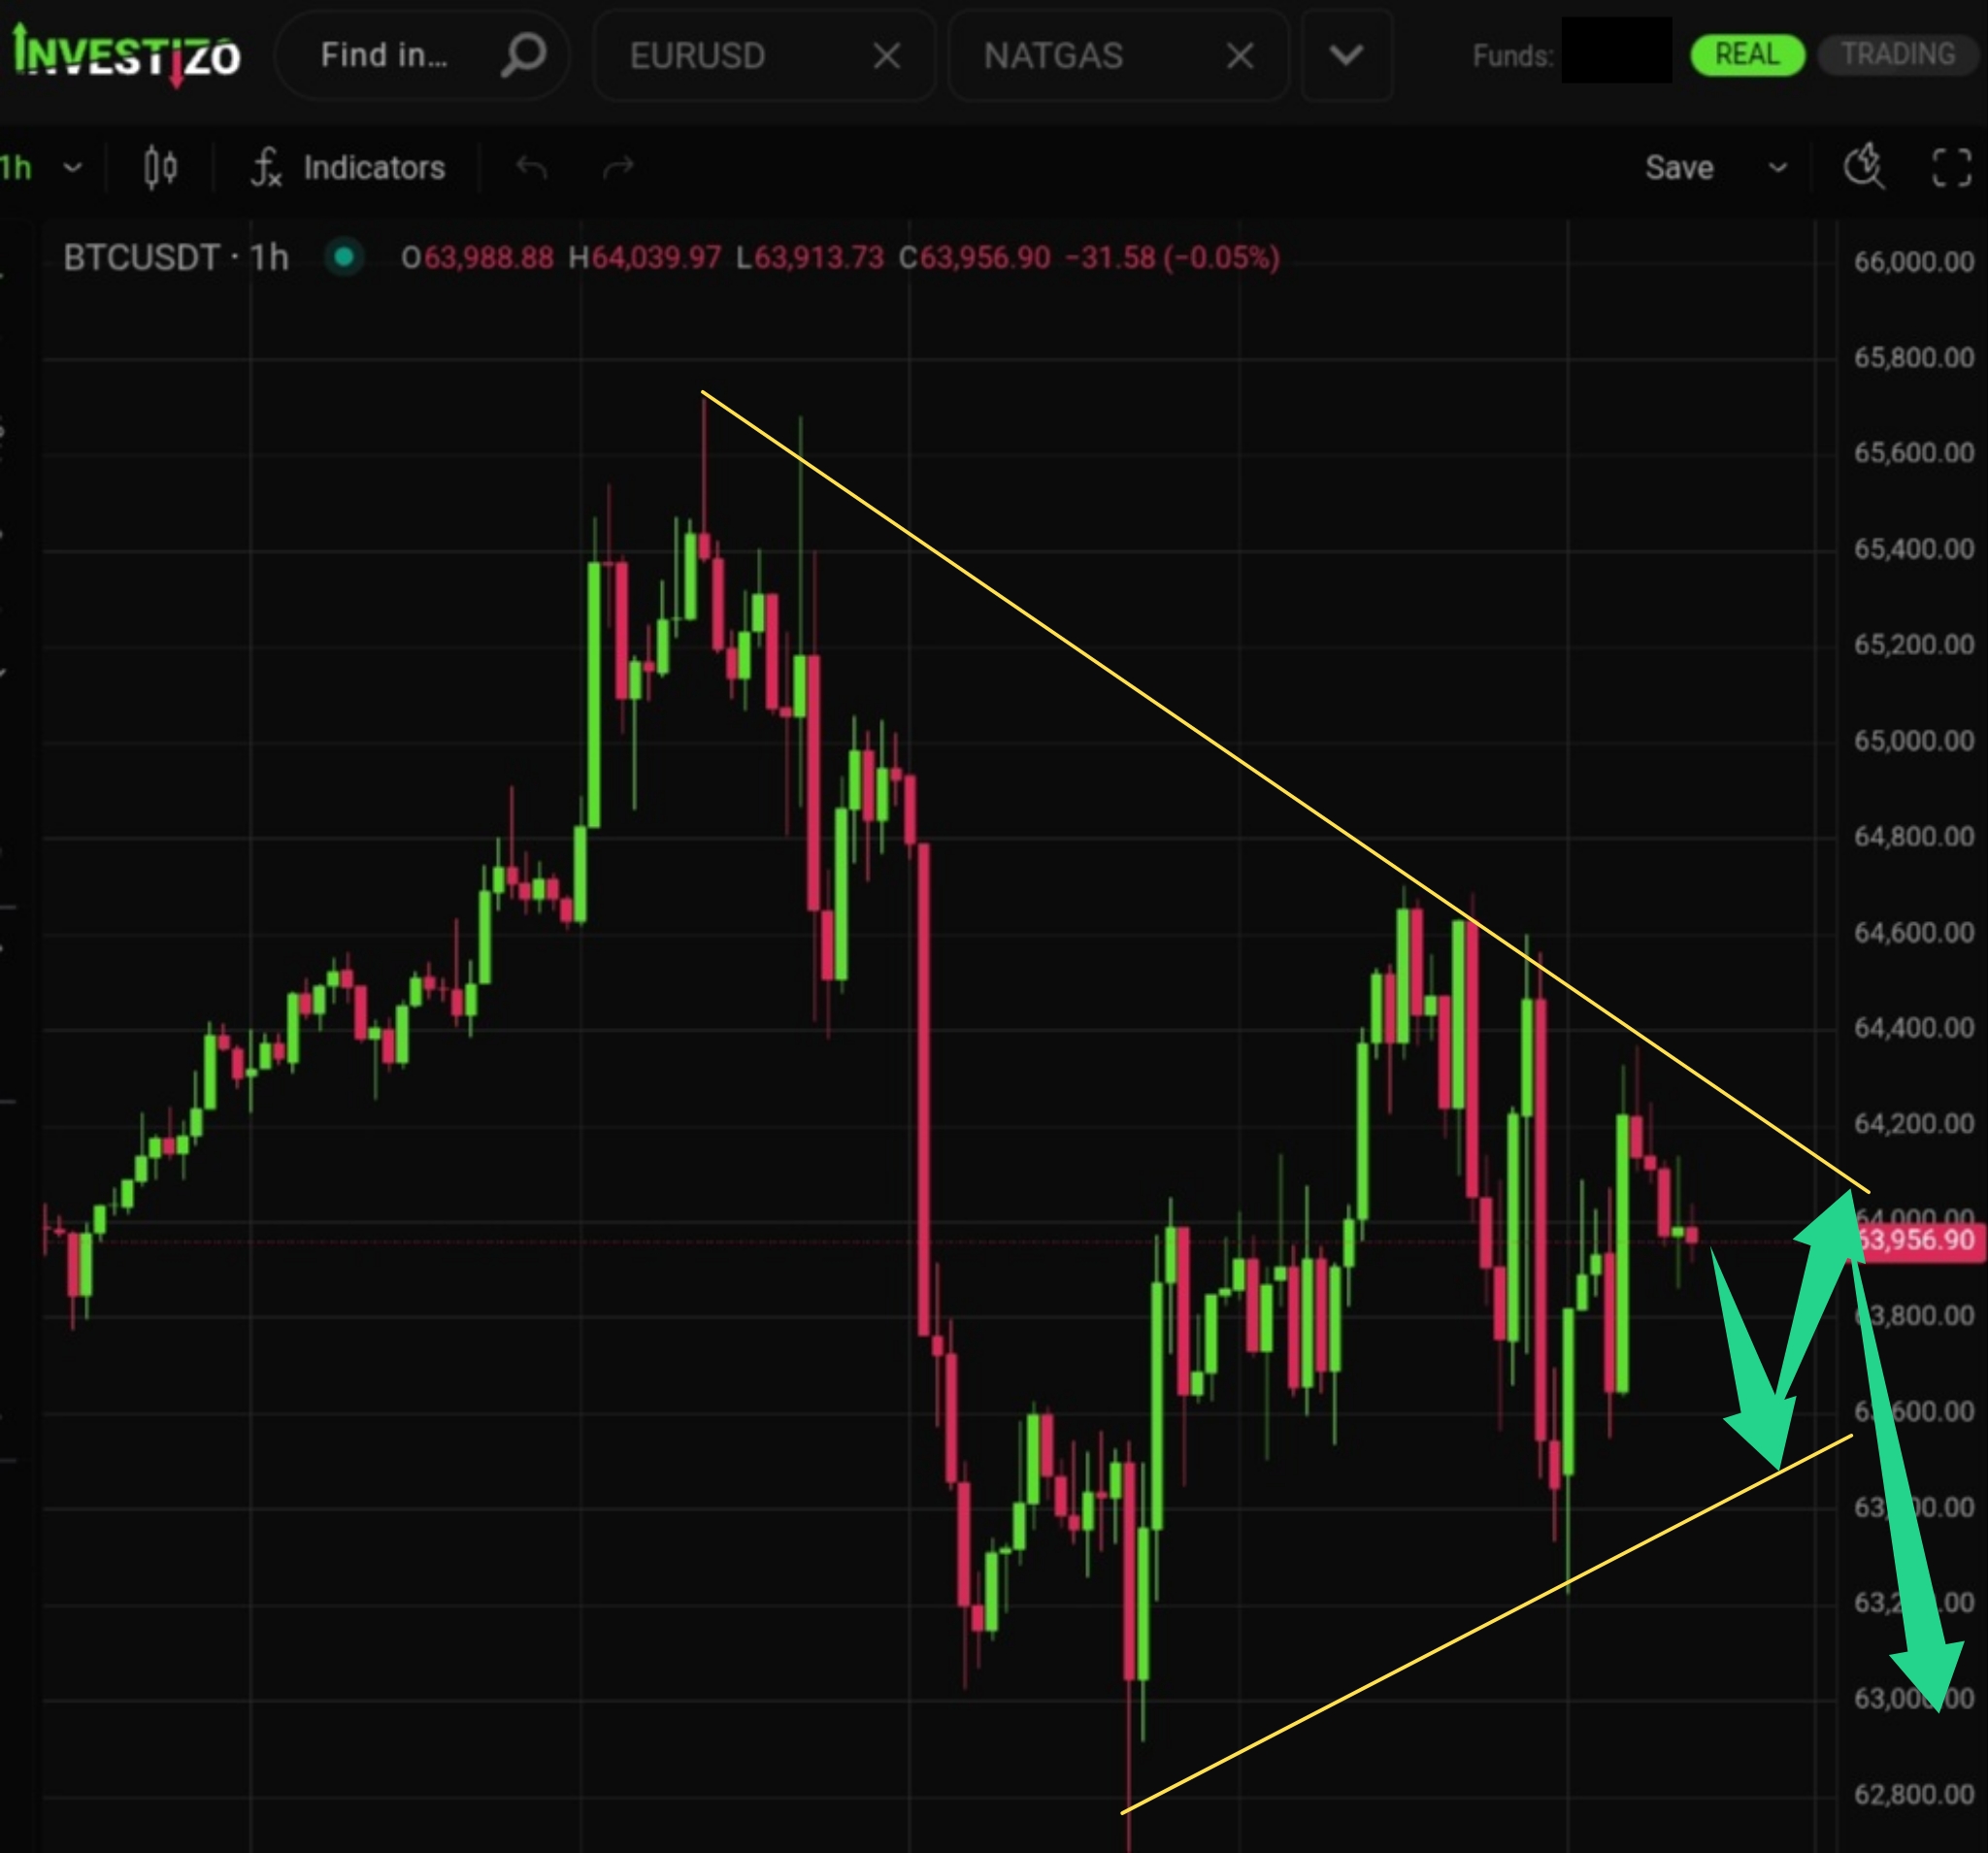
BTC/USD trades at $64,333 as the market continues to construct a local price floor following weeks of range-bound price action.
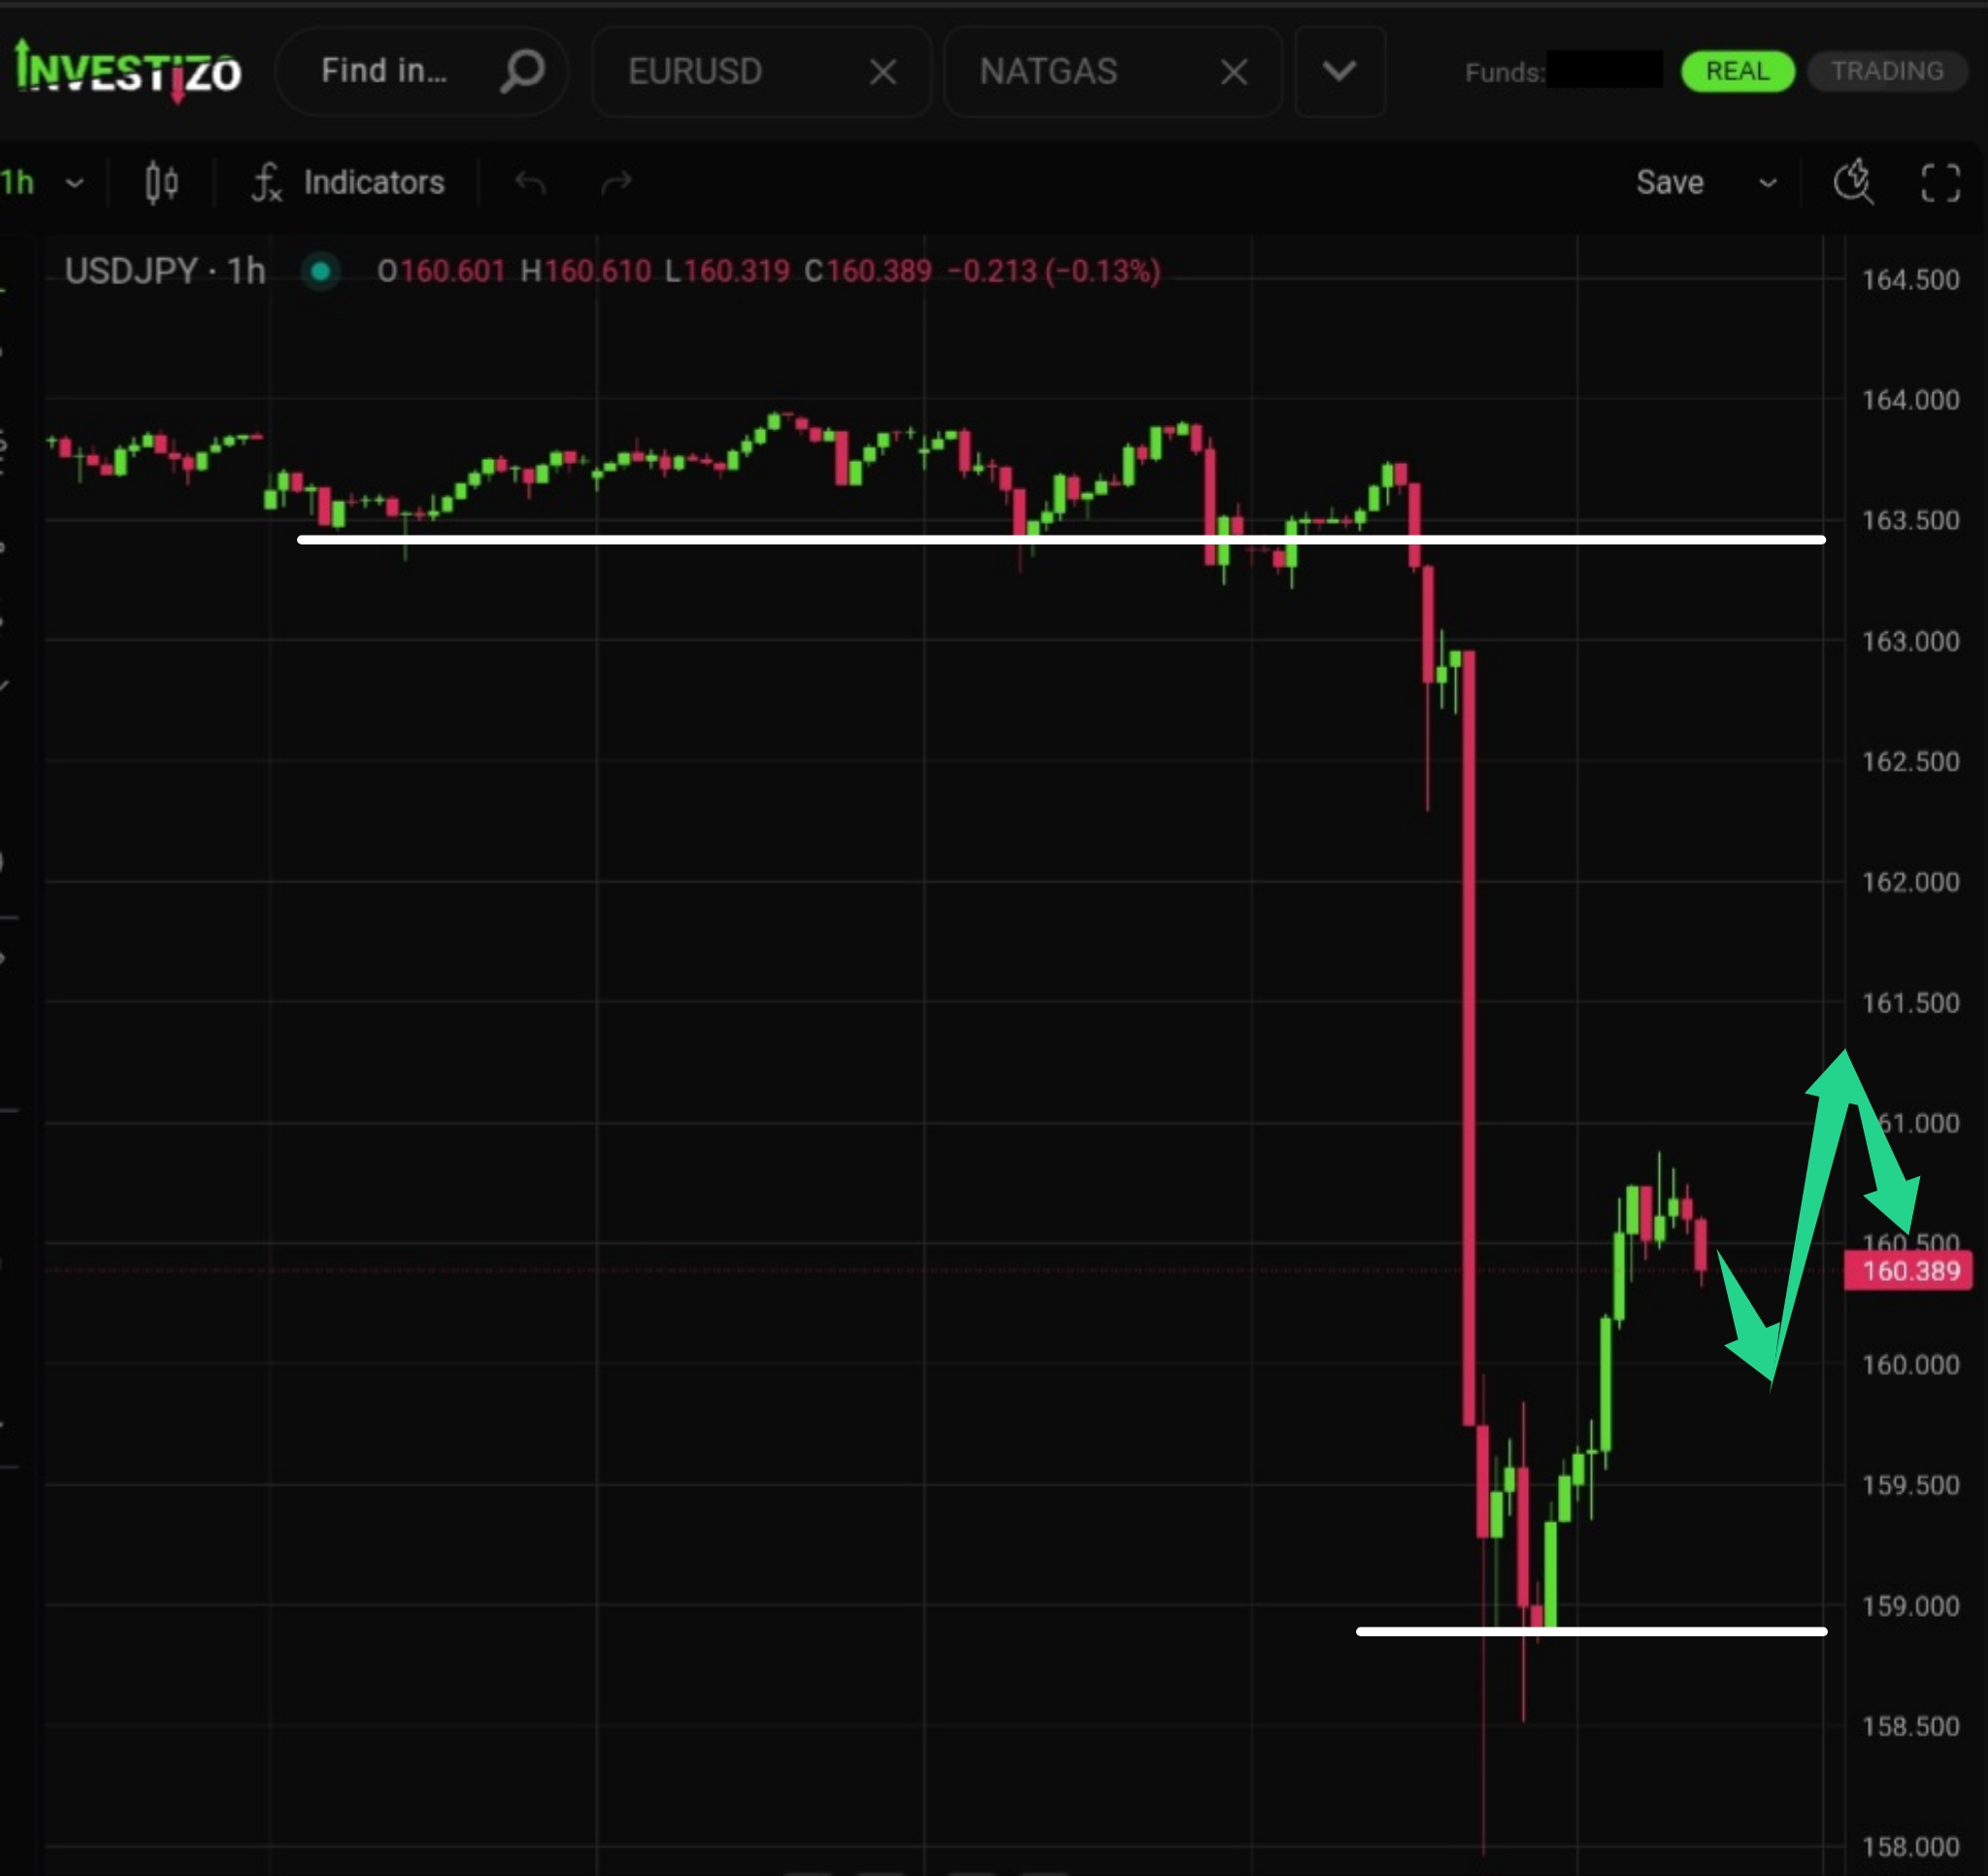
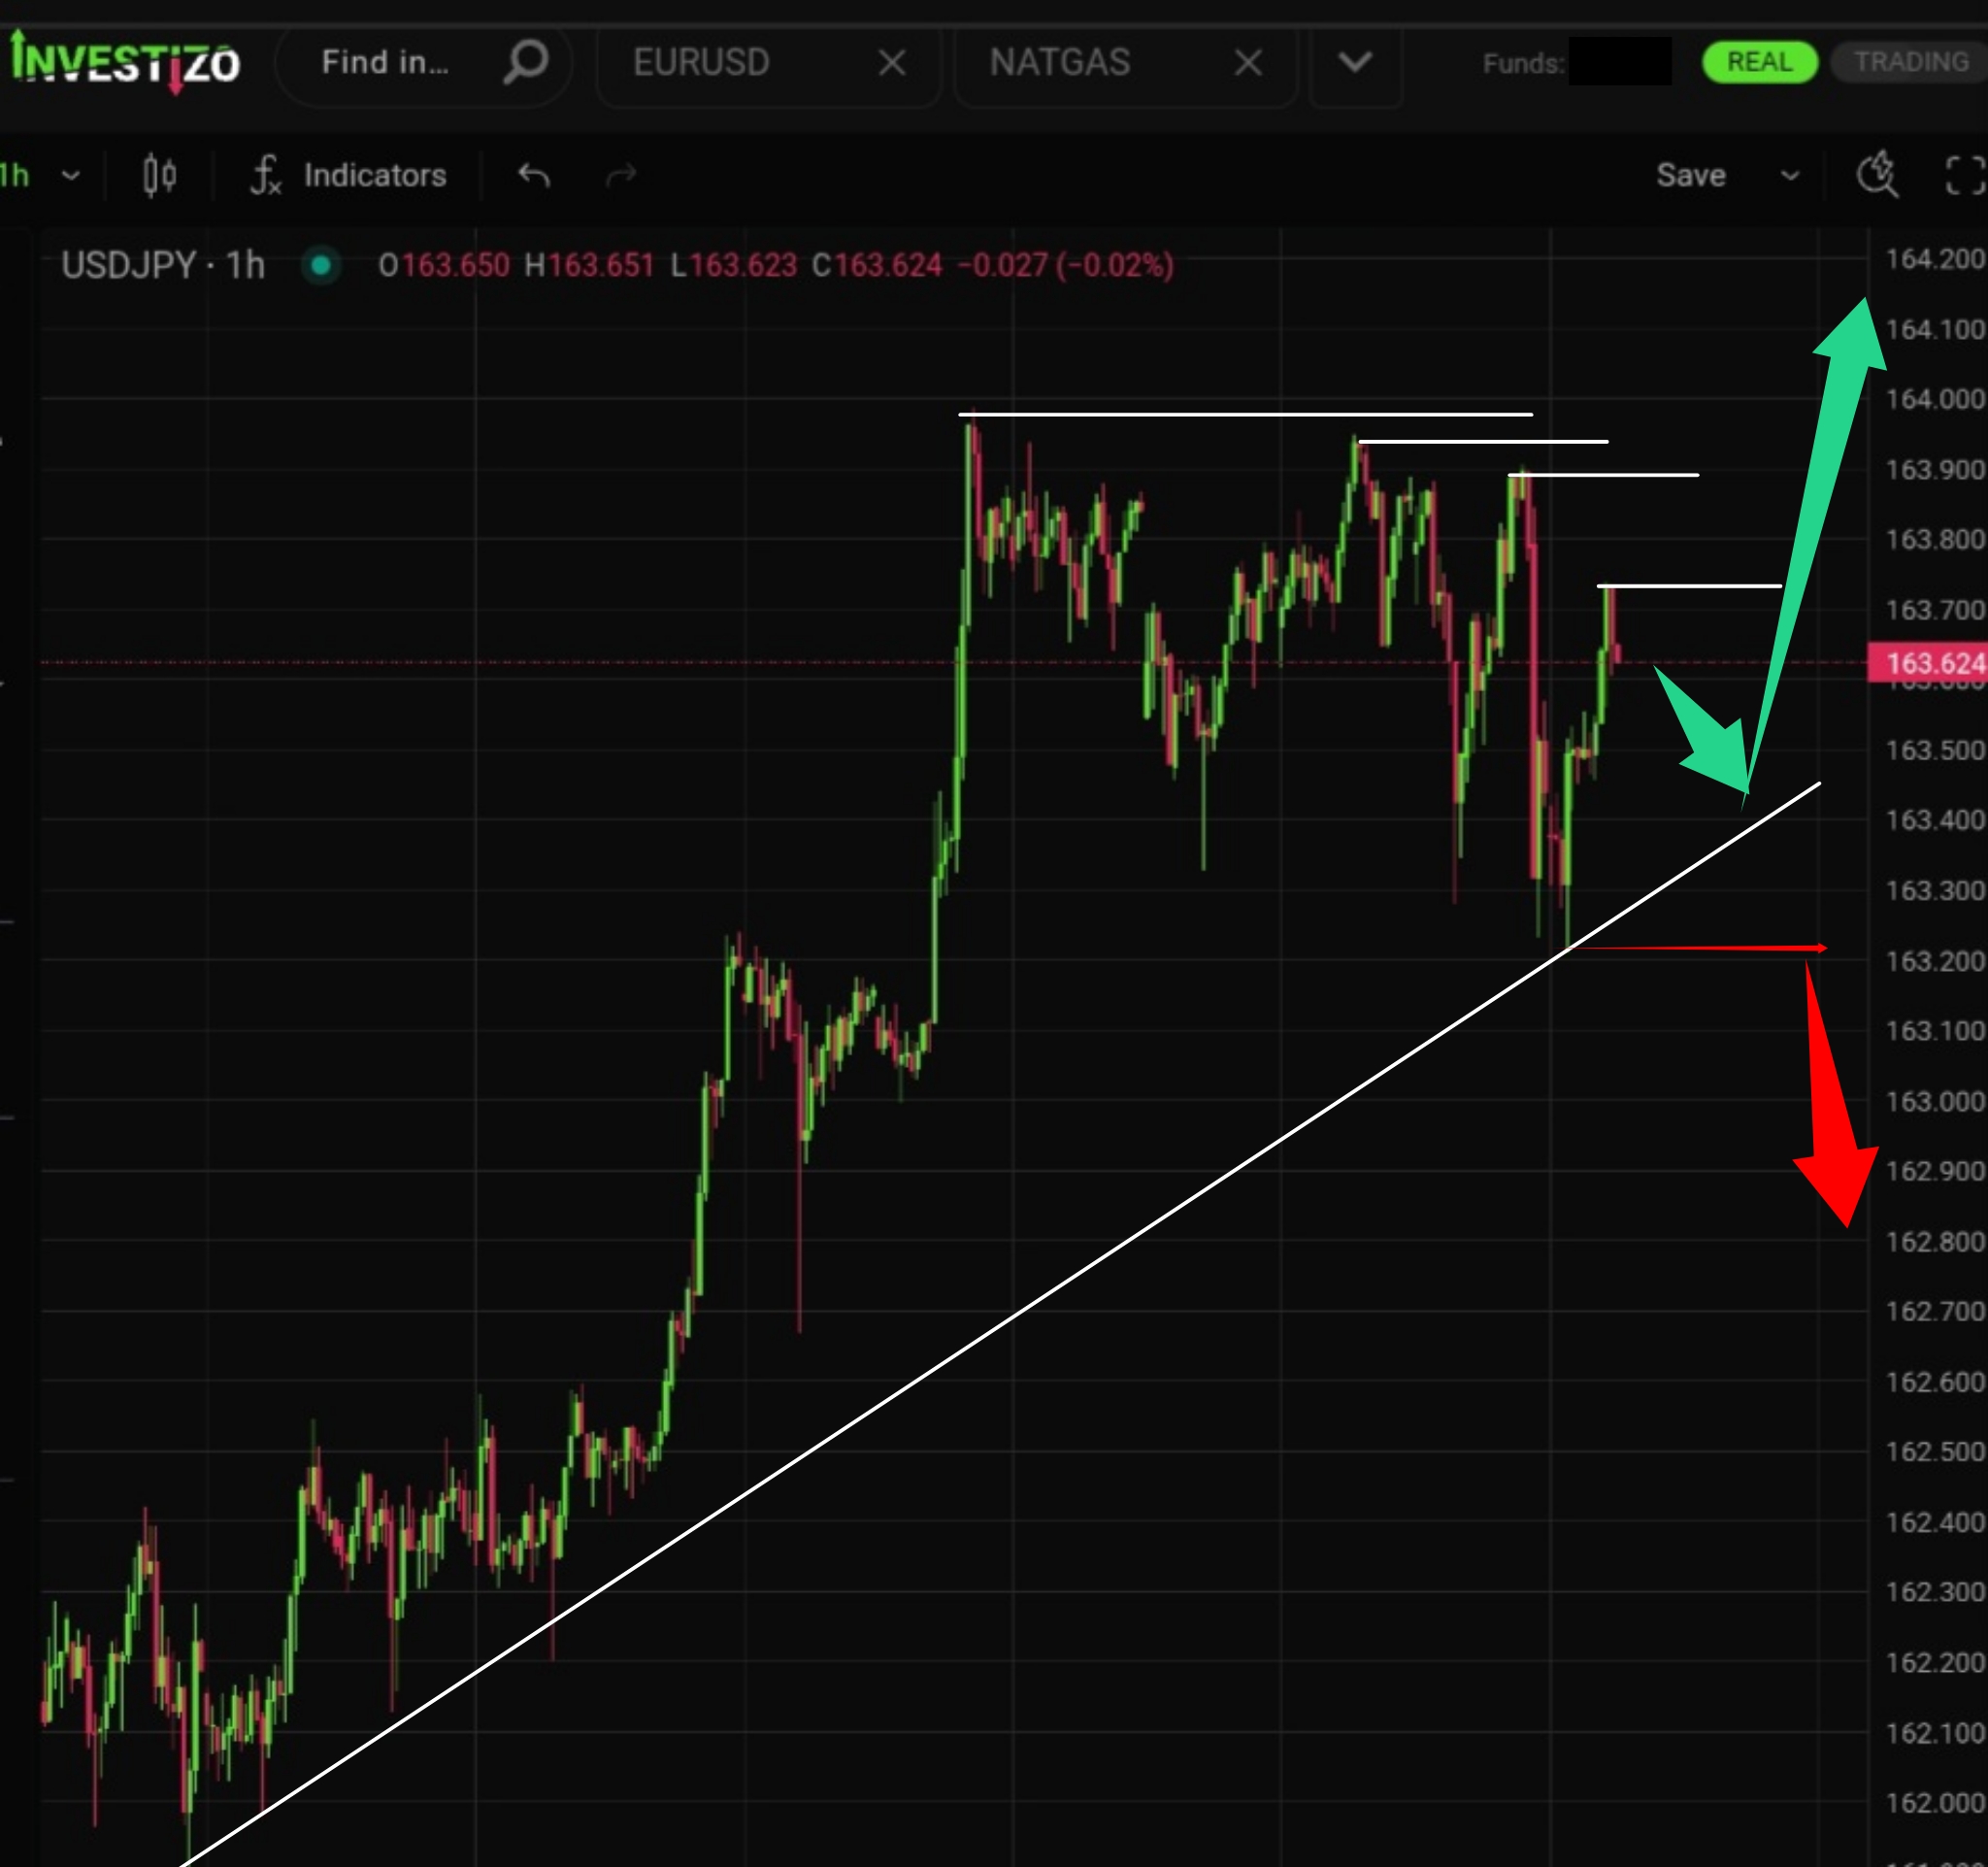
USD/JPY is trading near 160.389 following a violent 500+ pip plunge that handed the Japanese yen its sharpest single-day rally (+3.3%) in over two years.
Bitcoin is reacting nervously to yesterday’s Fed decision to keep rates unchanged. Price action remains volatile and two-way, yet the underlying structure stays bearish, with clear downside risks if resistance at $65,700 holds.
USD/JPY remains tightly consolidated after the Fed’s rate decision while the prevailing bullish trend stays intact. A tested trendline and a completed bull flag suggest an upward impulse toward fresh highs may unfold at any moment.
The euro strengthened significantly against the dollar following the Fed’s decision to keep rates unchanged. A local downtrend line has been firmly broken, clearing multiple resistance levels and opening the way for further upside after a technical pullback.
Gold briefly tested the psychological $4,000 level before buyers stepped in. With a narrowing trading range and limited technical support, further consolidation may precede a downward impulse.
Bitcoin remains under pressure after the Federal Reserve left interest rates unchanged.
Global energy markets remain hyper-focused on the Middle East as the volatile standoff between Washington and Tehran intensifies.