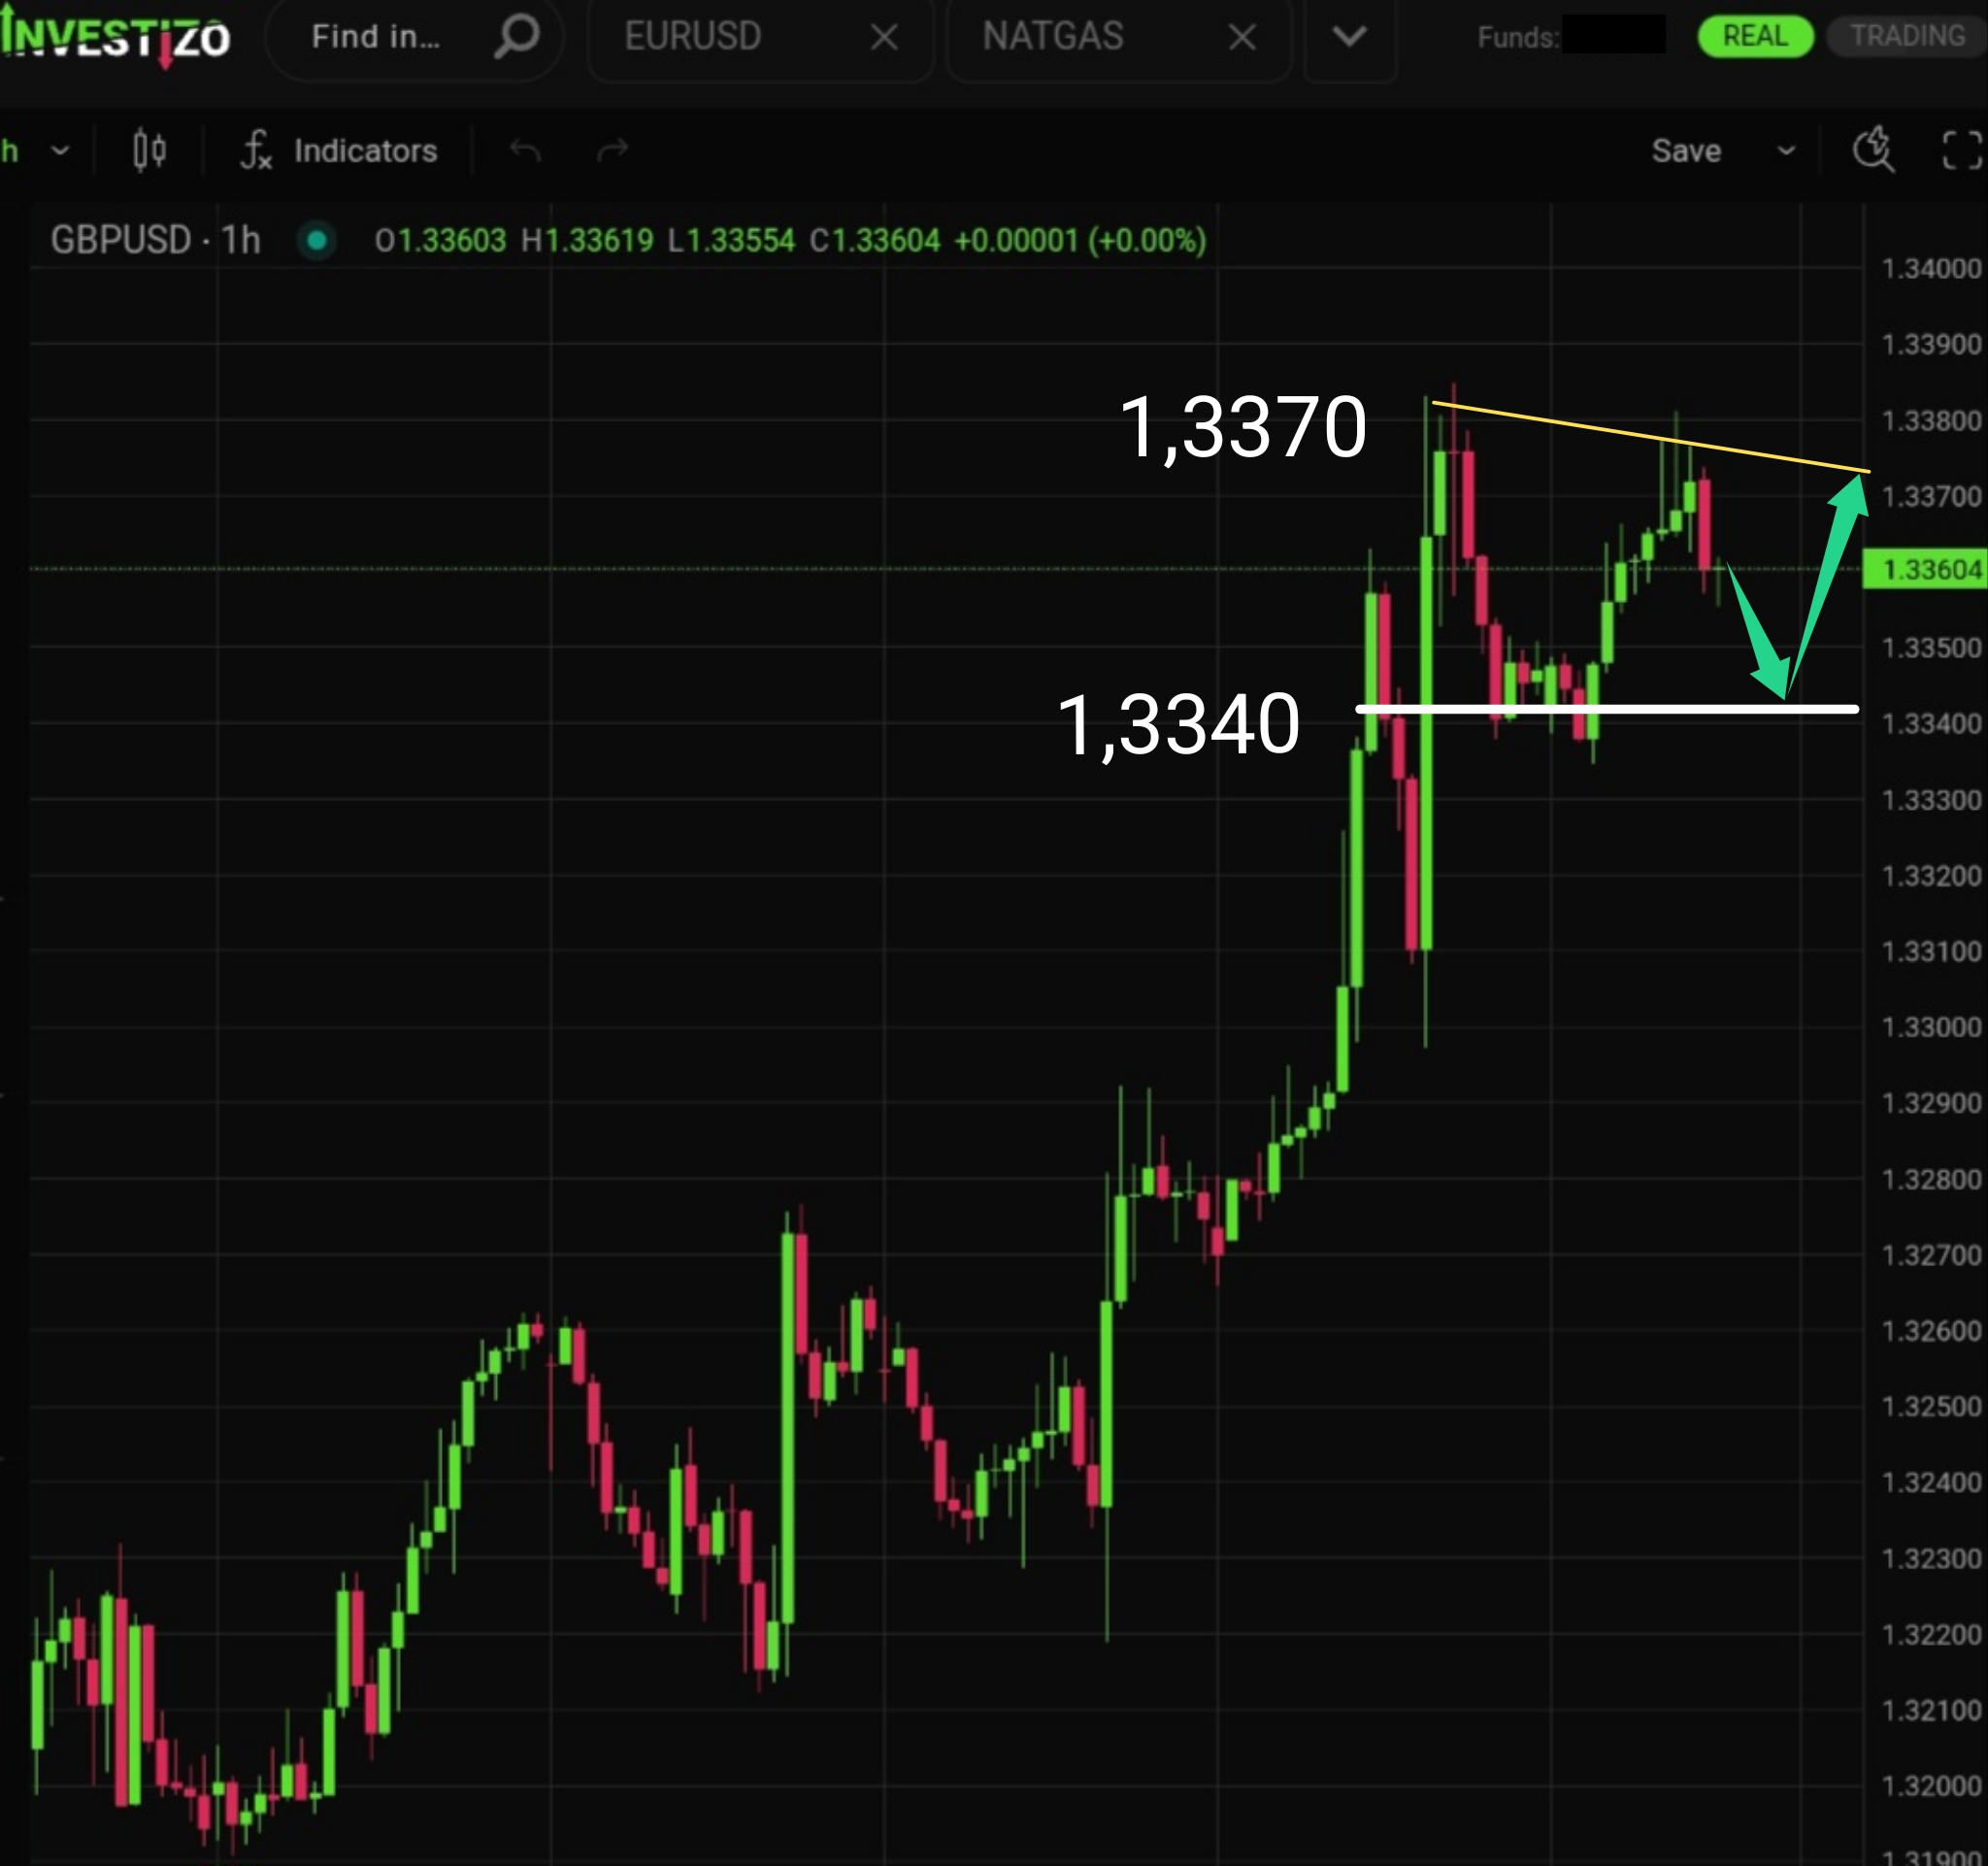
GBP/USD, Technical Analysis – H1
The pair is consolidating within a narrowing triangular range between 1.3340 and 1.3370.
Investizo LTD. Business company number 25432 BC 2019
Suite 305, Griffith Corporate Centre,
P.O. Box 1510, Beachmont, Kingstown,
St. Vincent and the Grenadines
DUNS 817053497
Phone:+996312610515
E-mail: [email protected]
© 2019-2026 Investizo 18+ Все права защищены
Предупреждение о рисках: CFD являются сложными финансовыми продуктами, торгуемыми на марже. Торговля CFD рискованна и может не подходить для всех инвесторов. Убедитесь, что вы понимаете риски, связанные с тем, что вы можете потерять весь свой инвестированный капитал.
The pair is consolidating within a narrowing triangular range between 1.3340 and 1.3370.
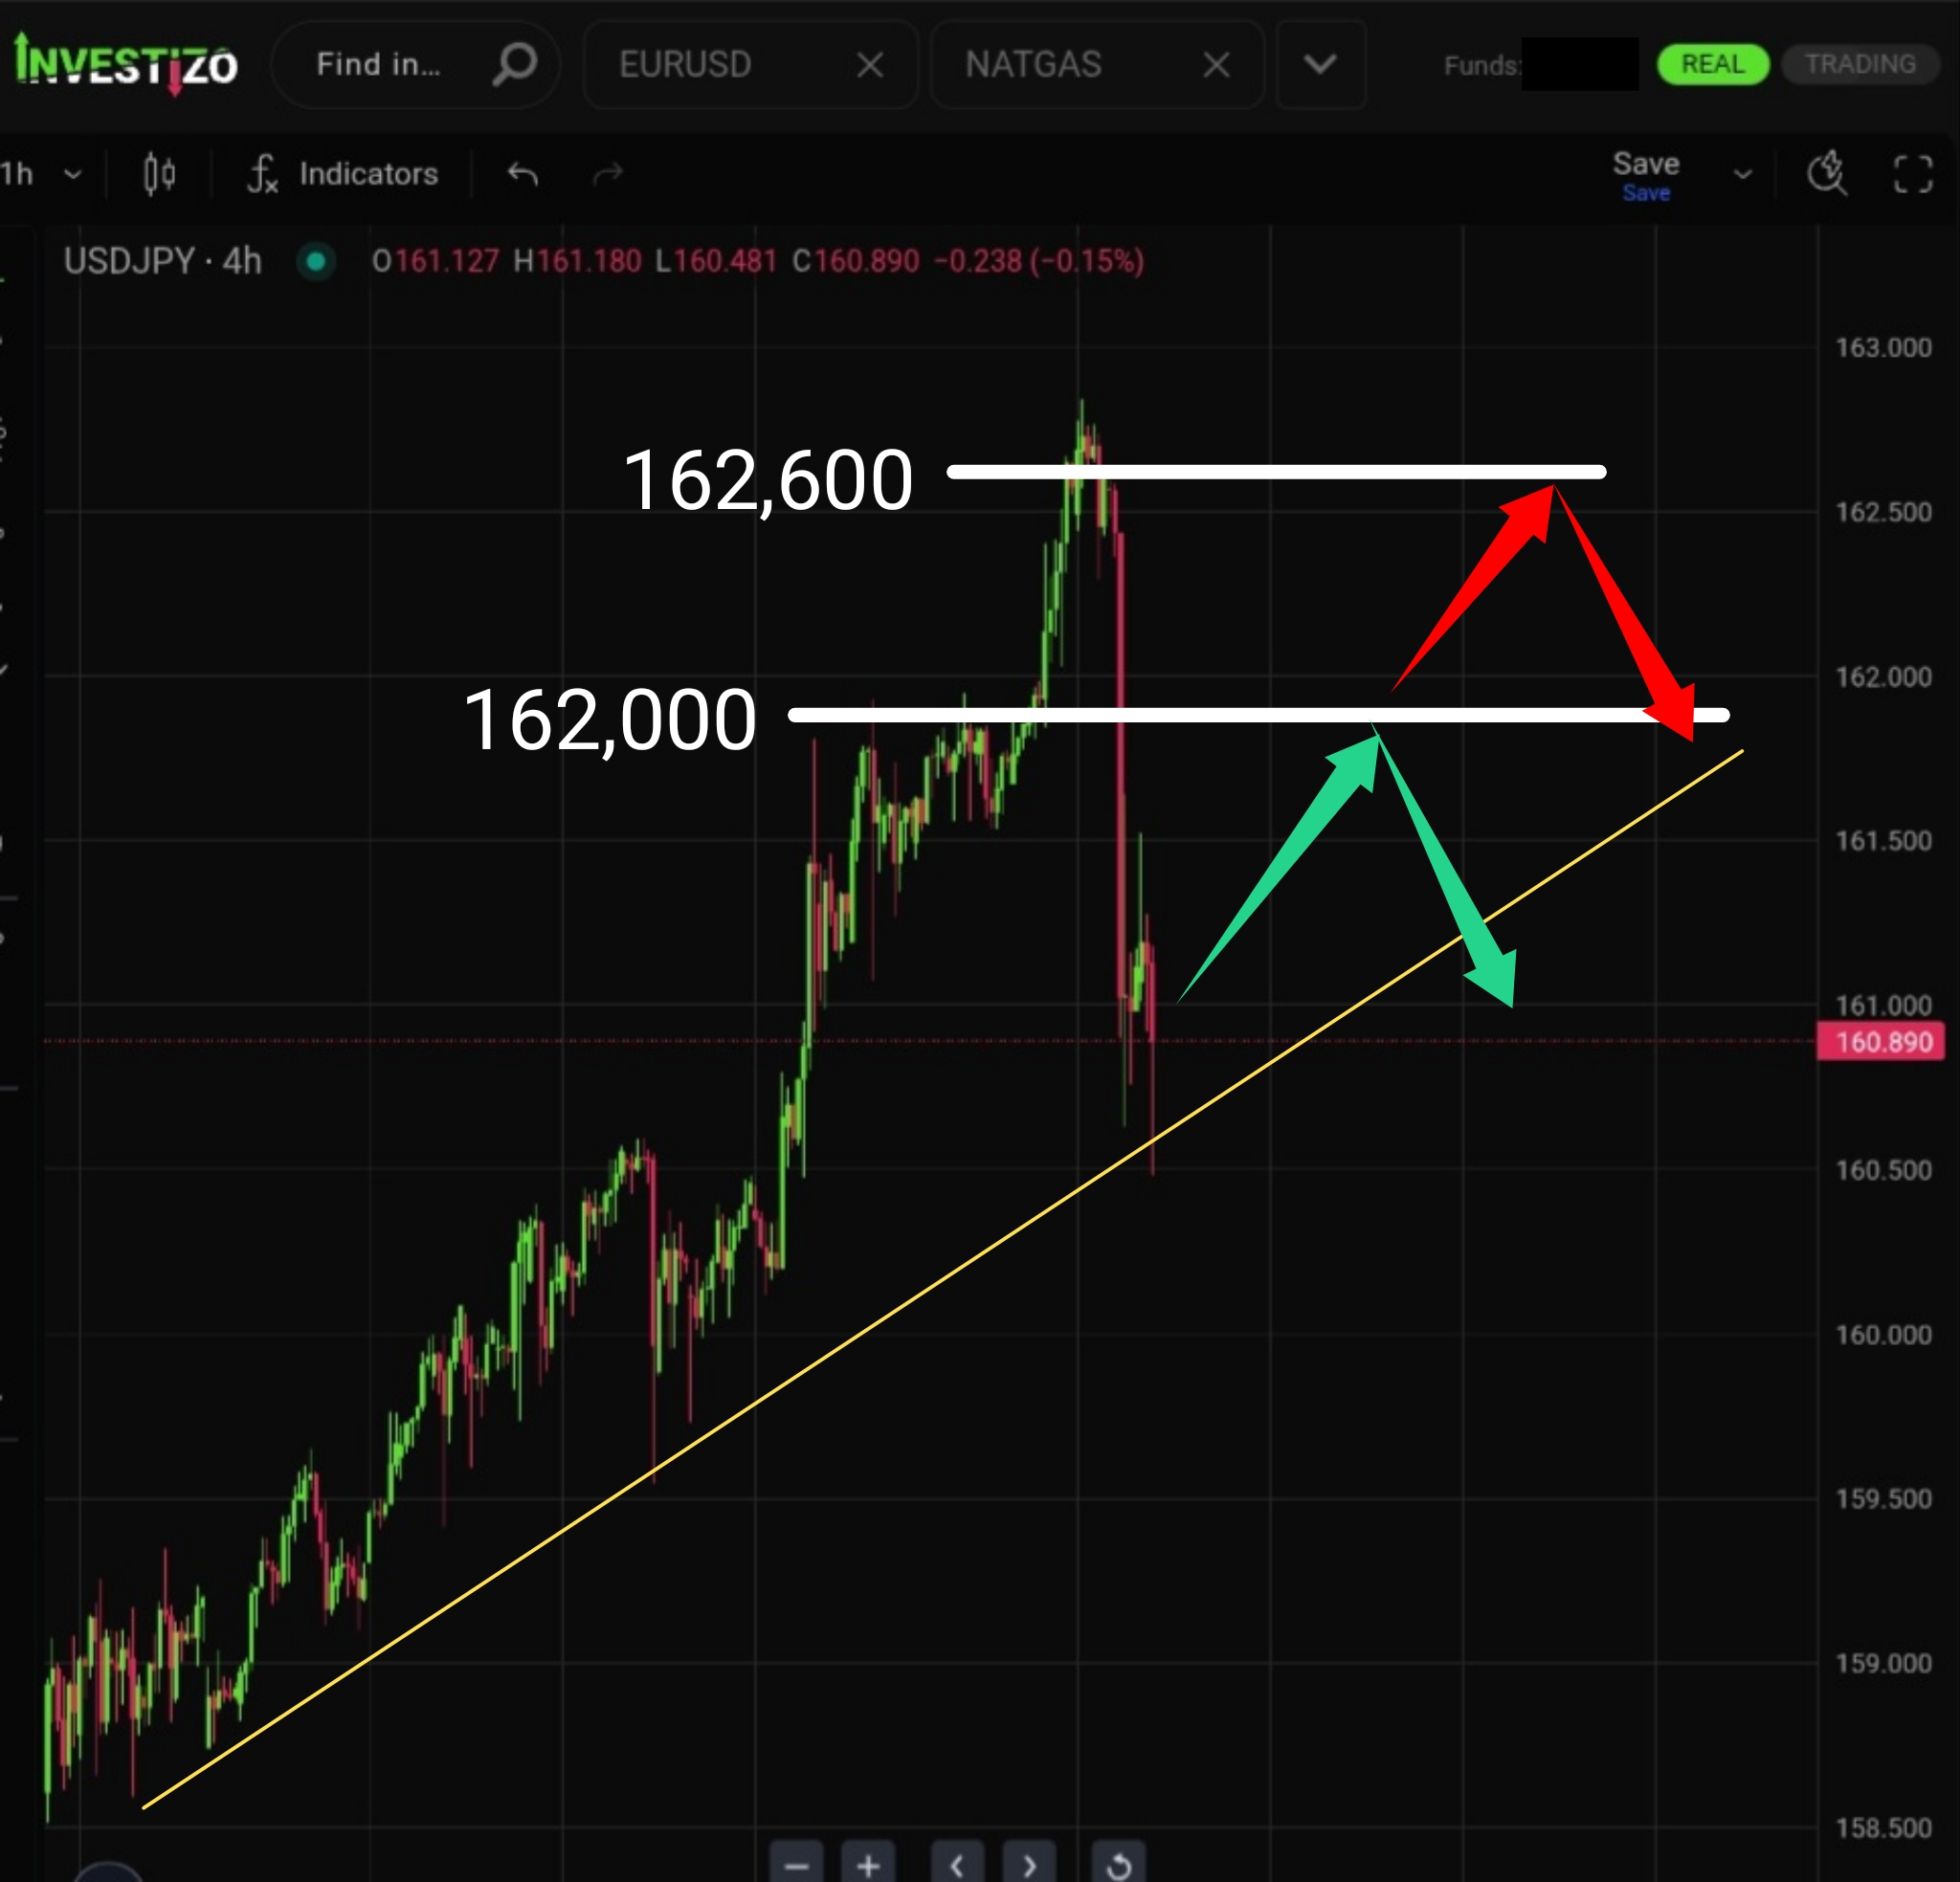
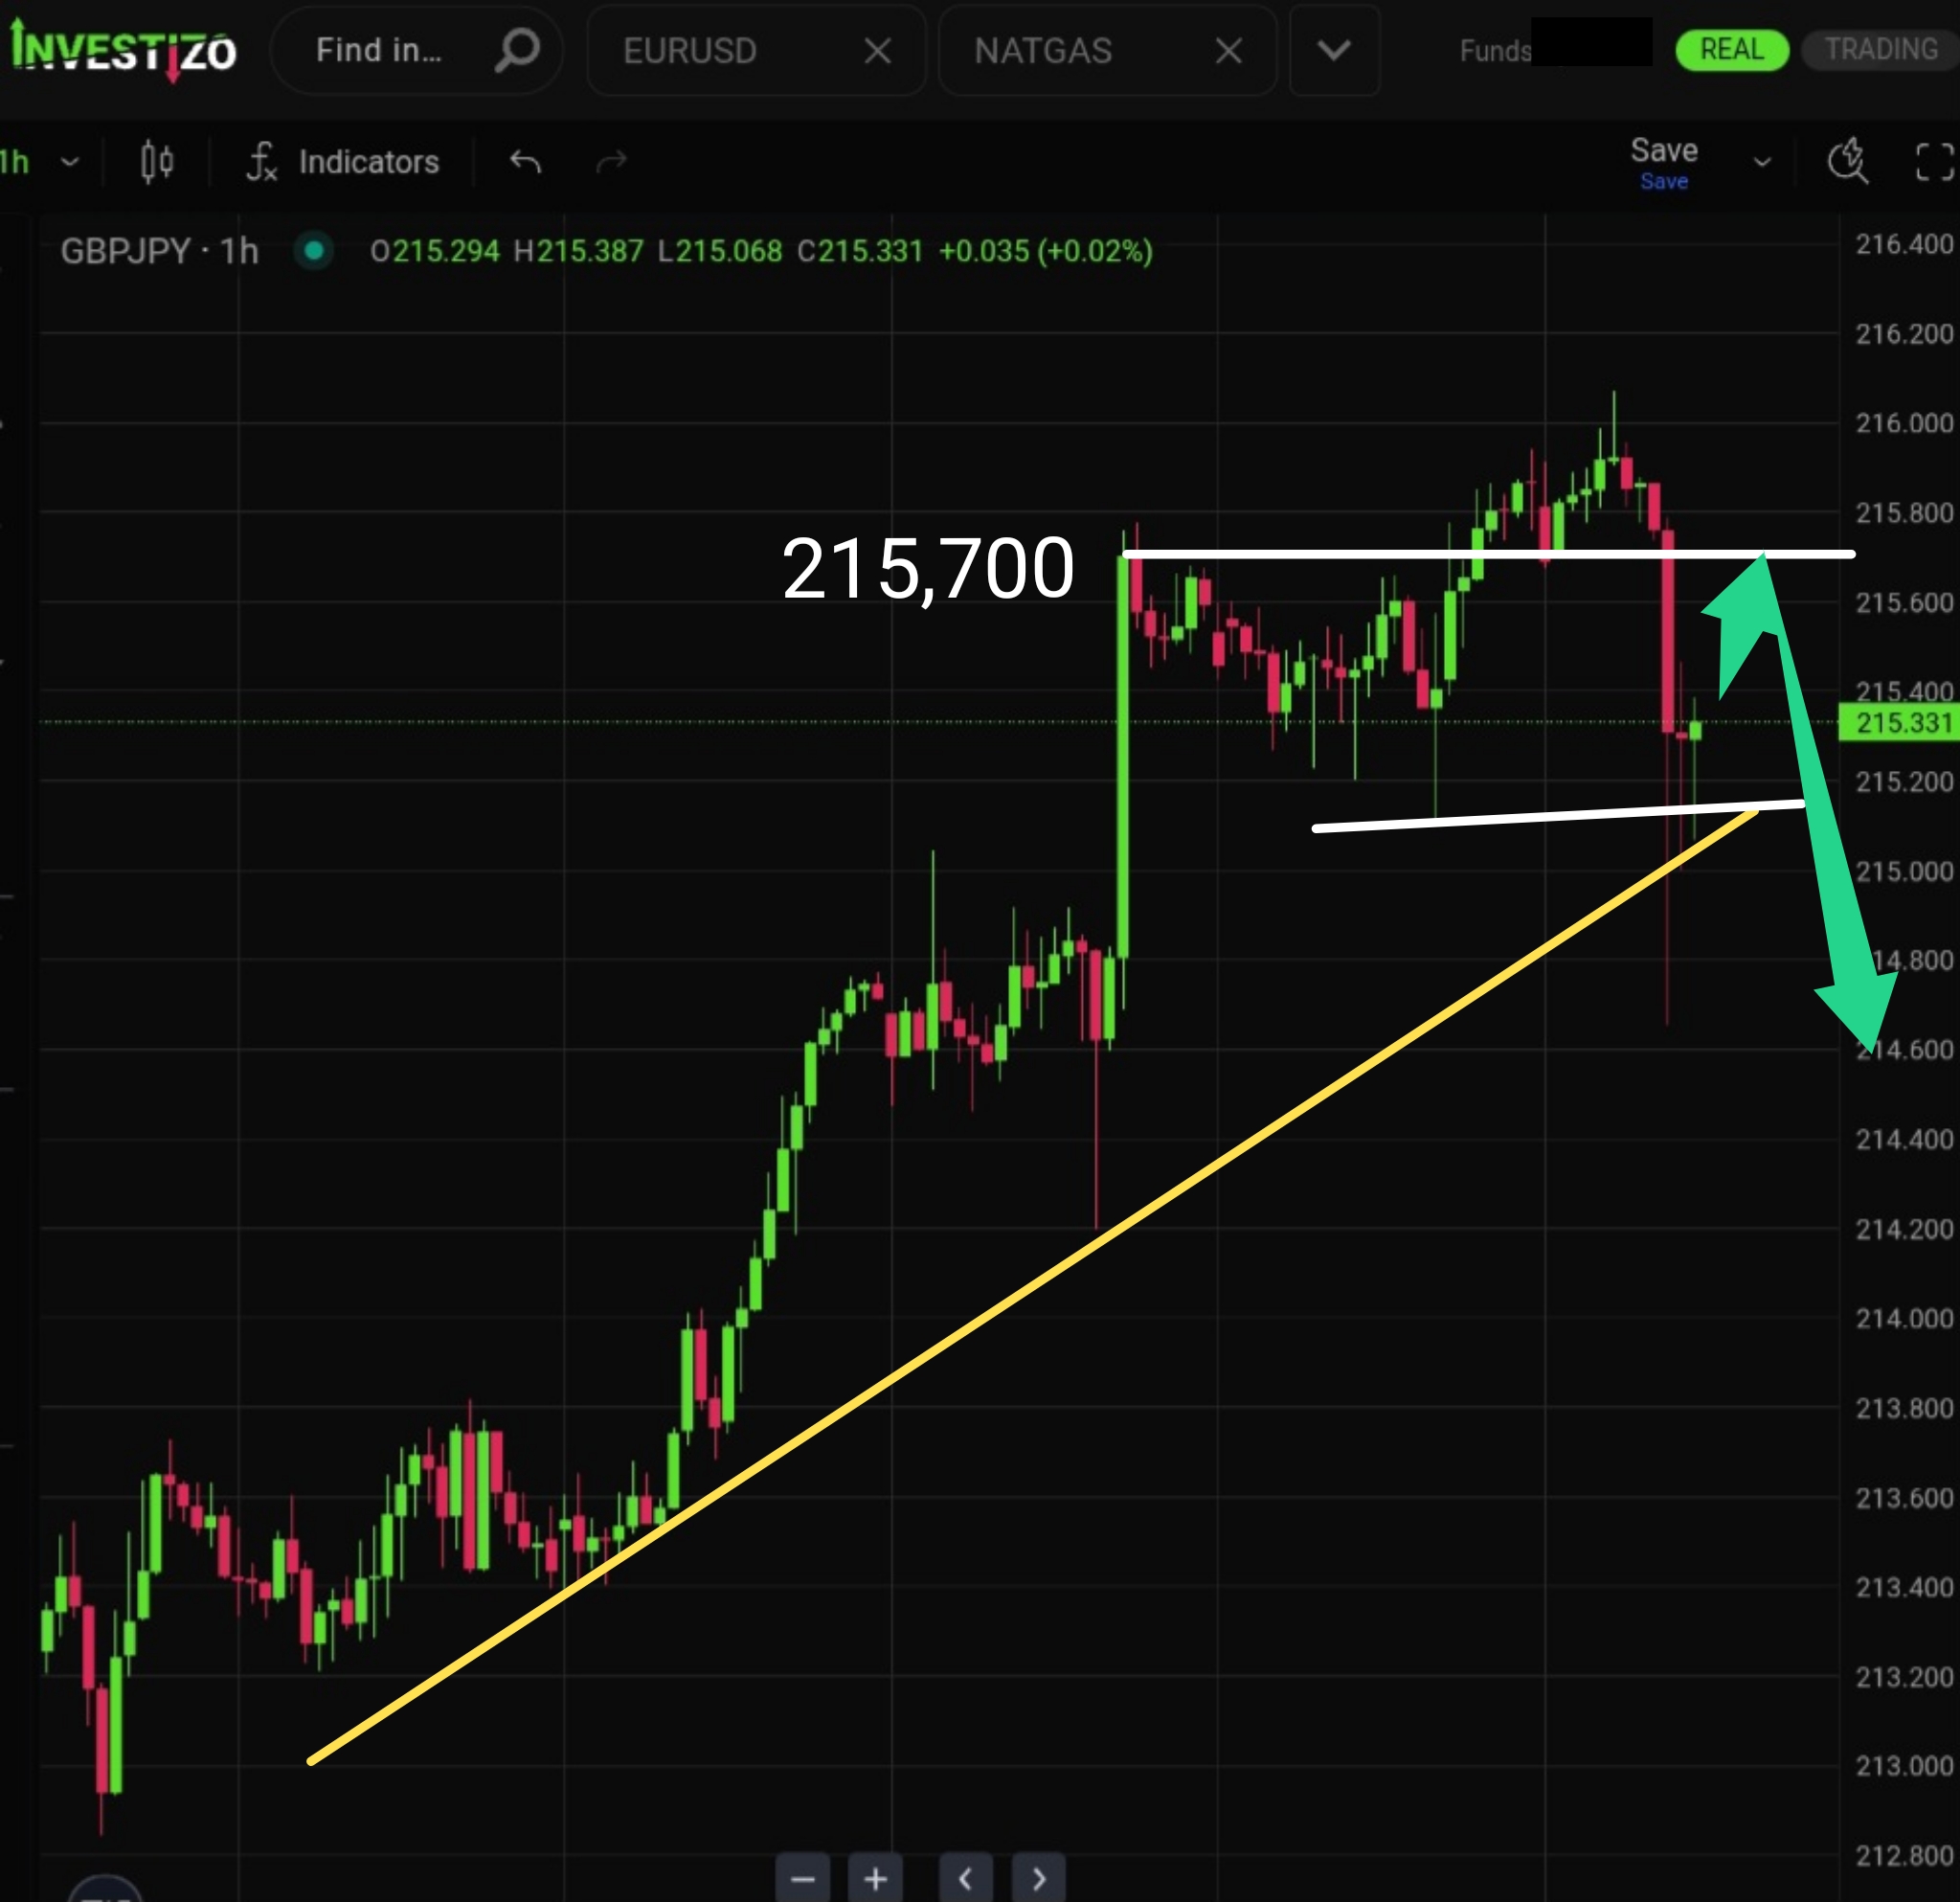
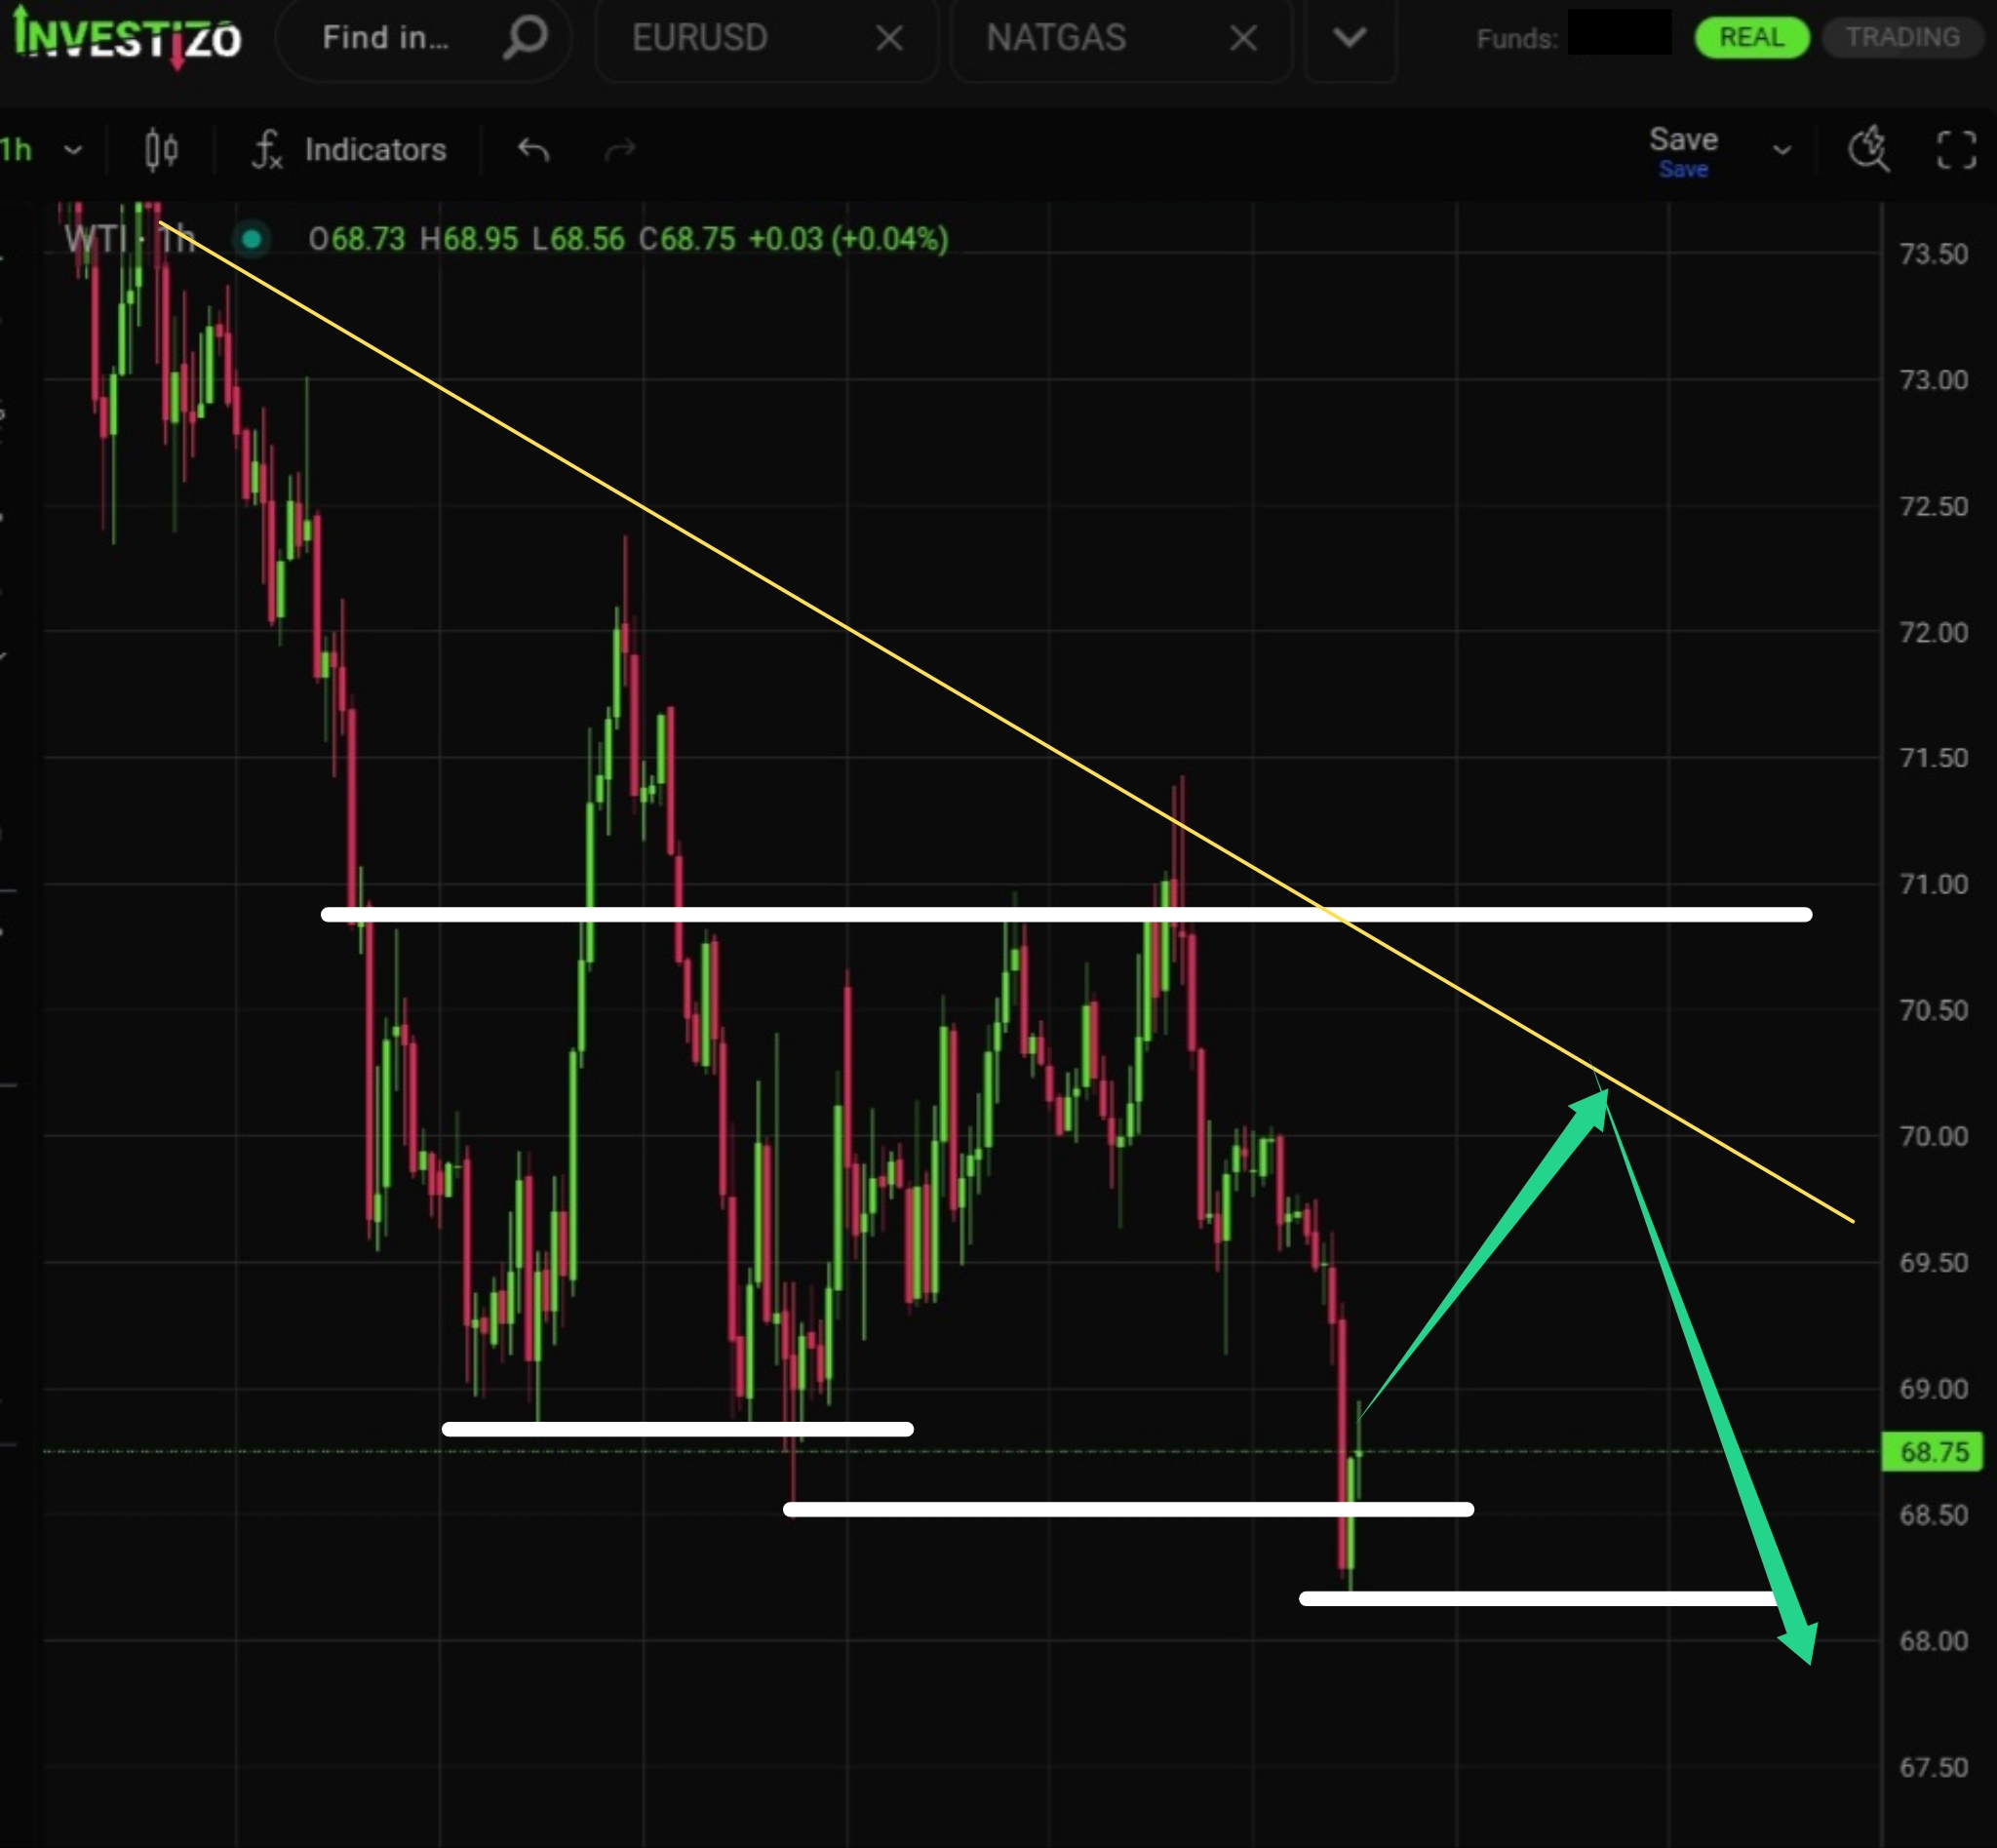
Despite the sharp sell-off, bulls have so far managed to defend support near the trendline.
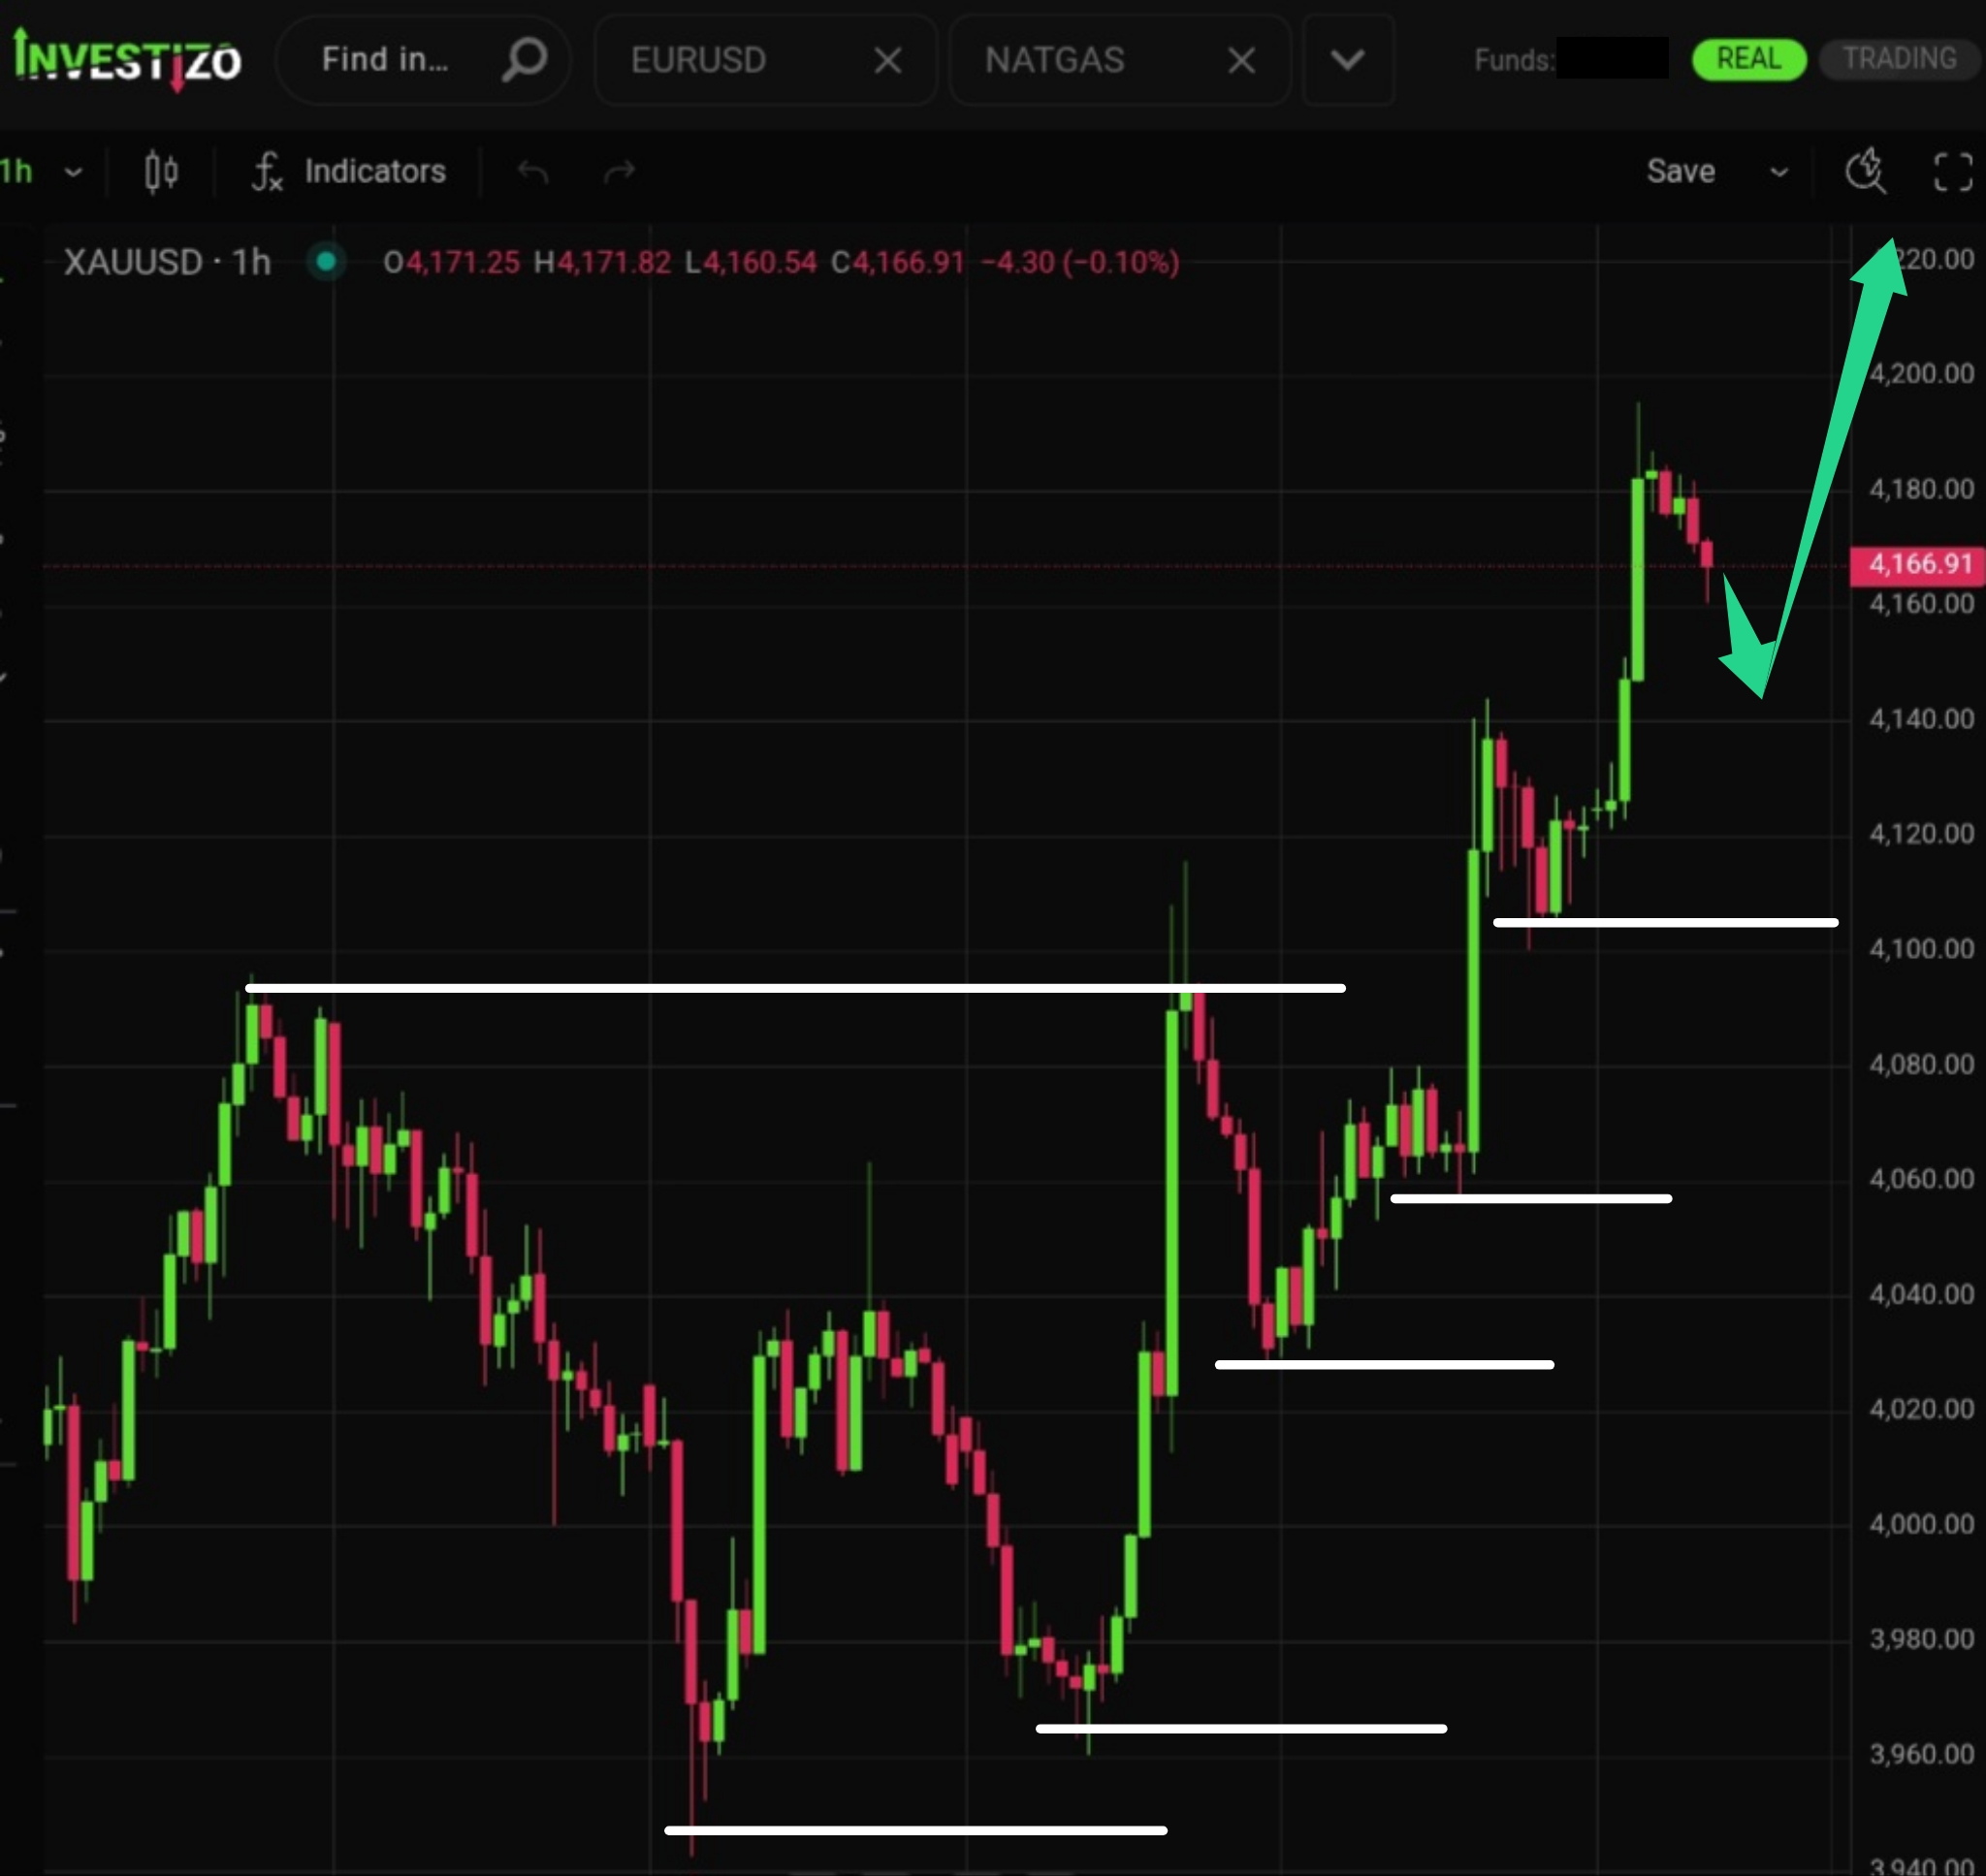
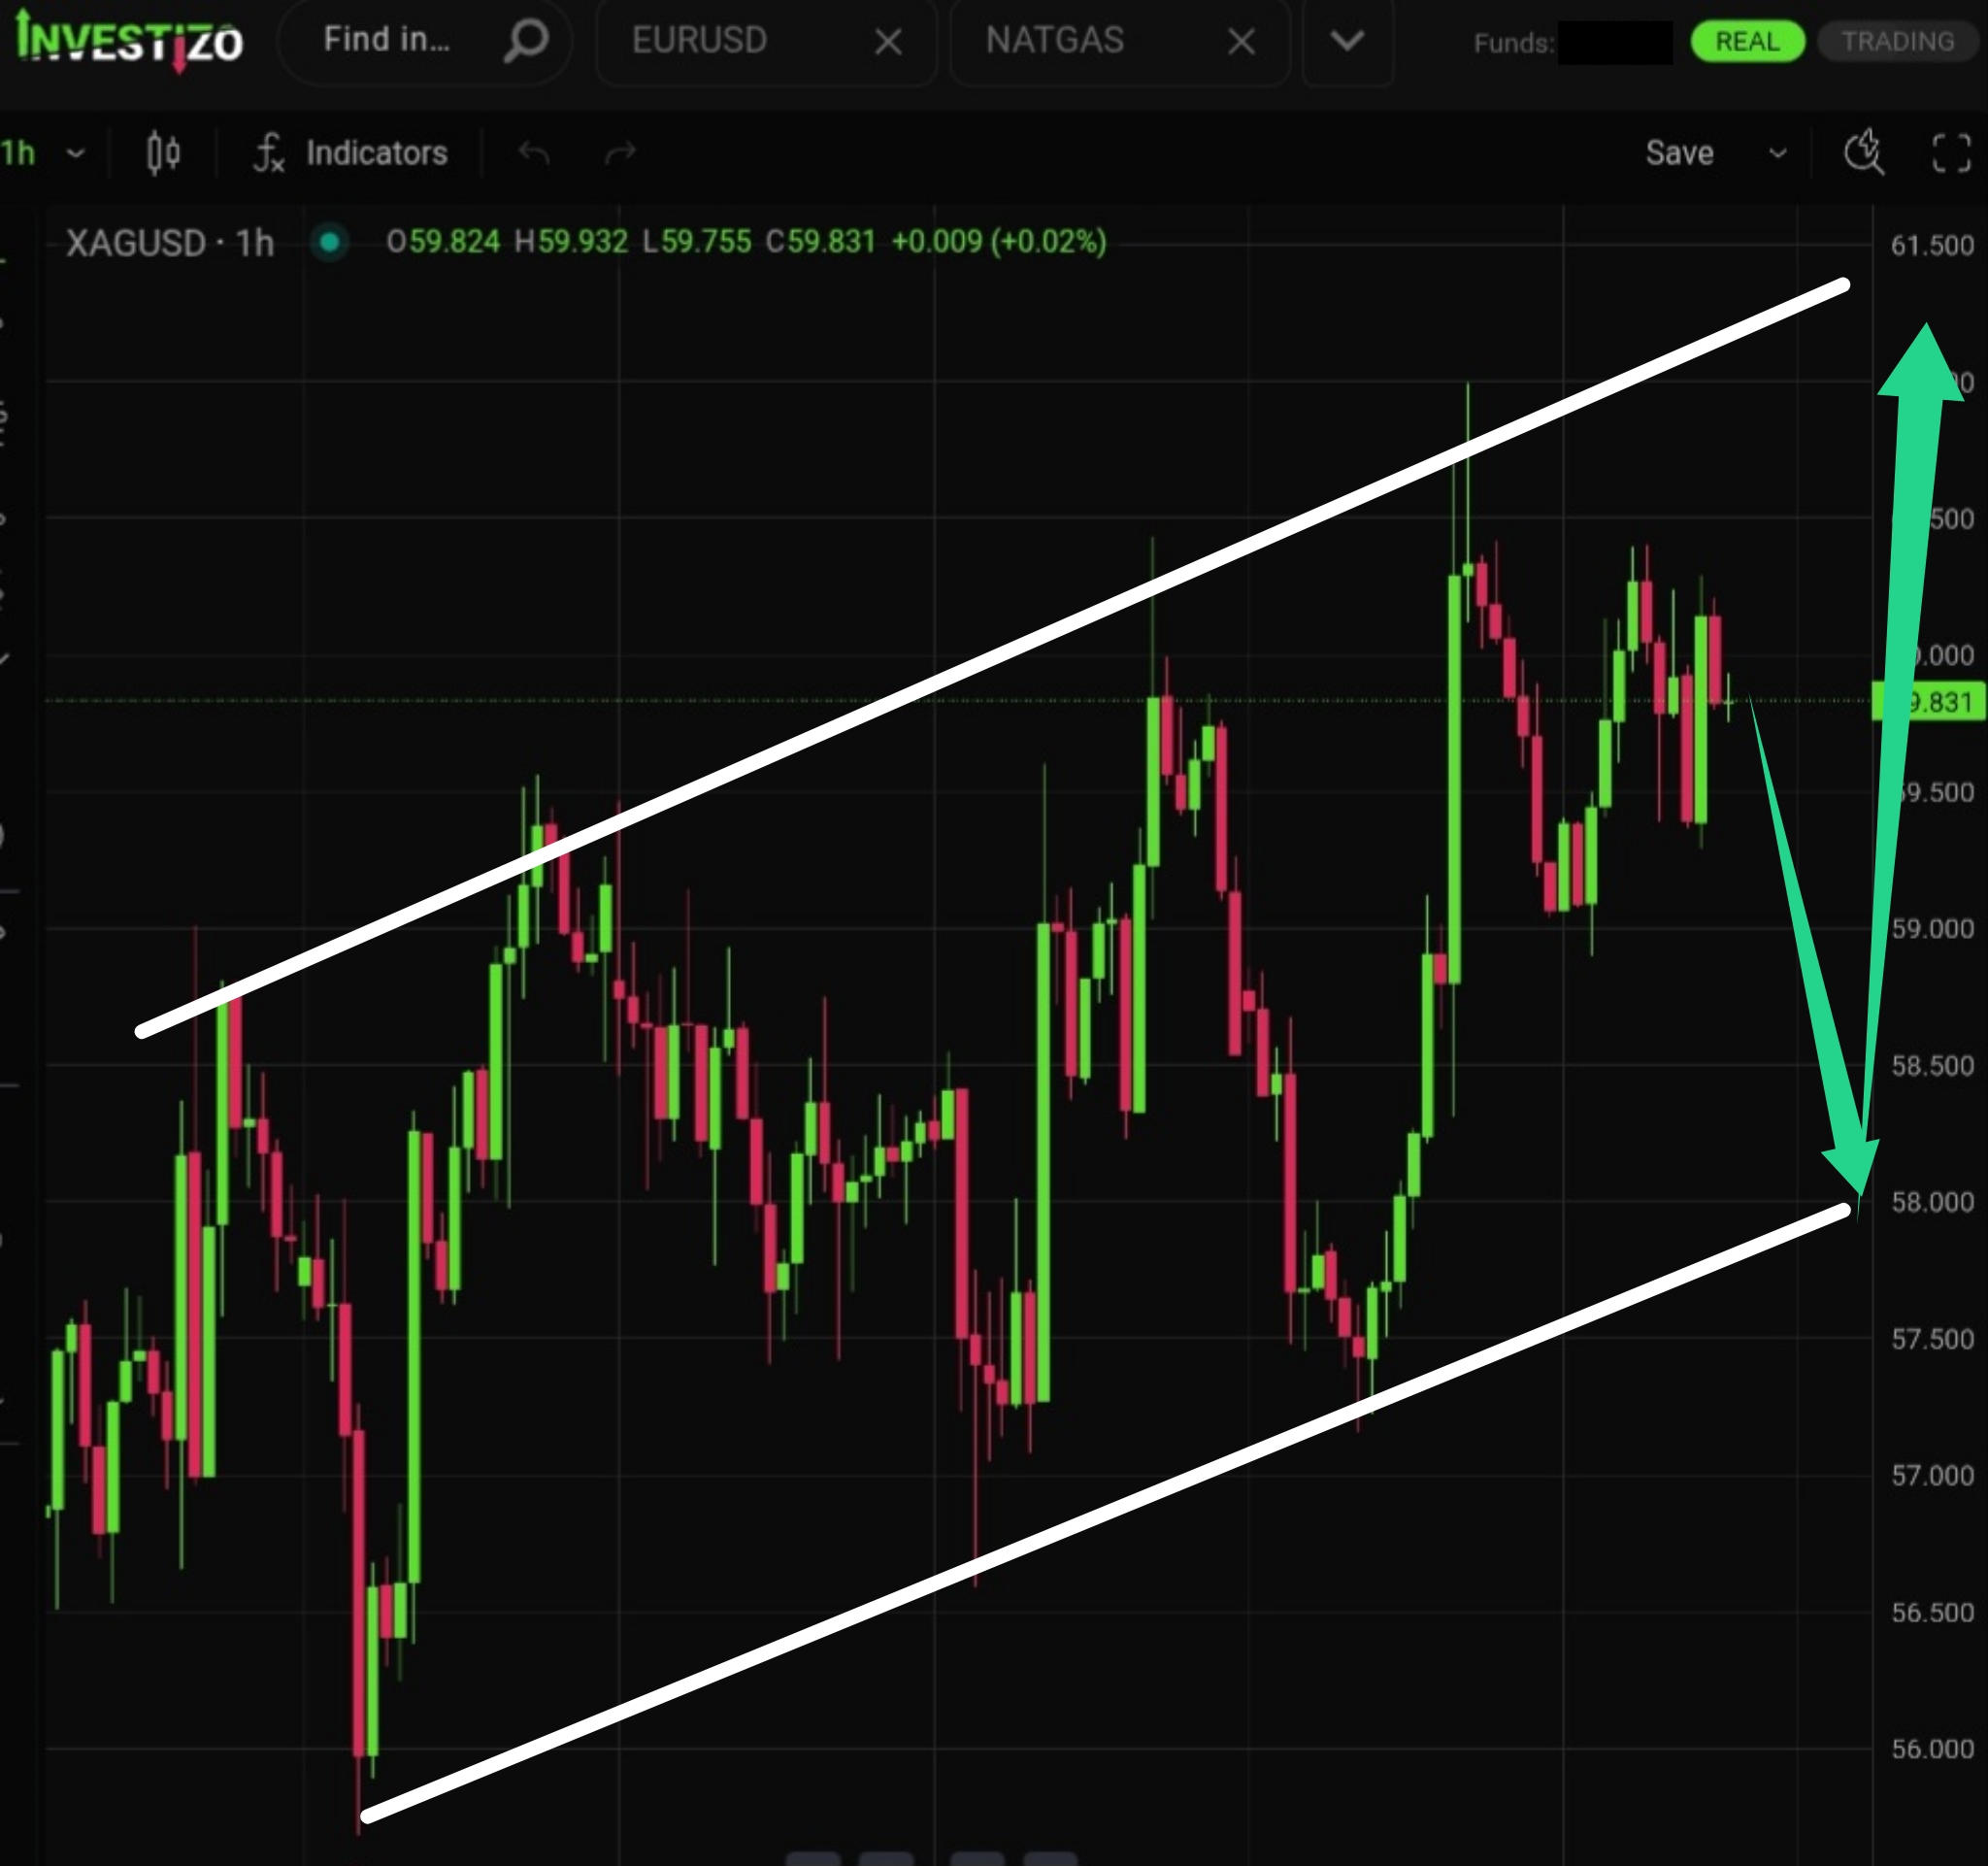
The pair continues to strengthen within a clear ascending structure, supporting expectations of further upside.
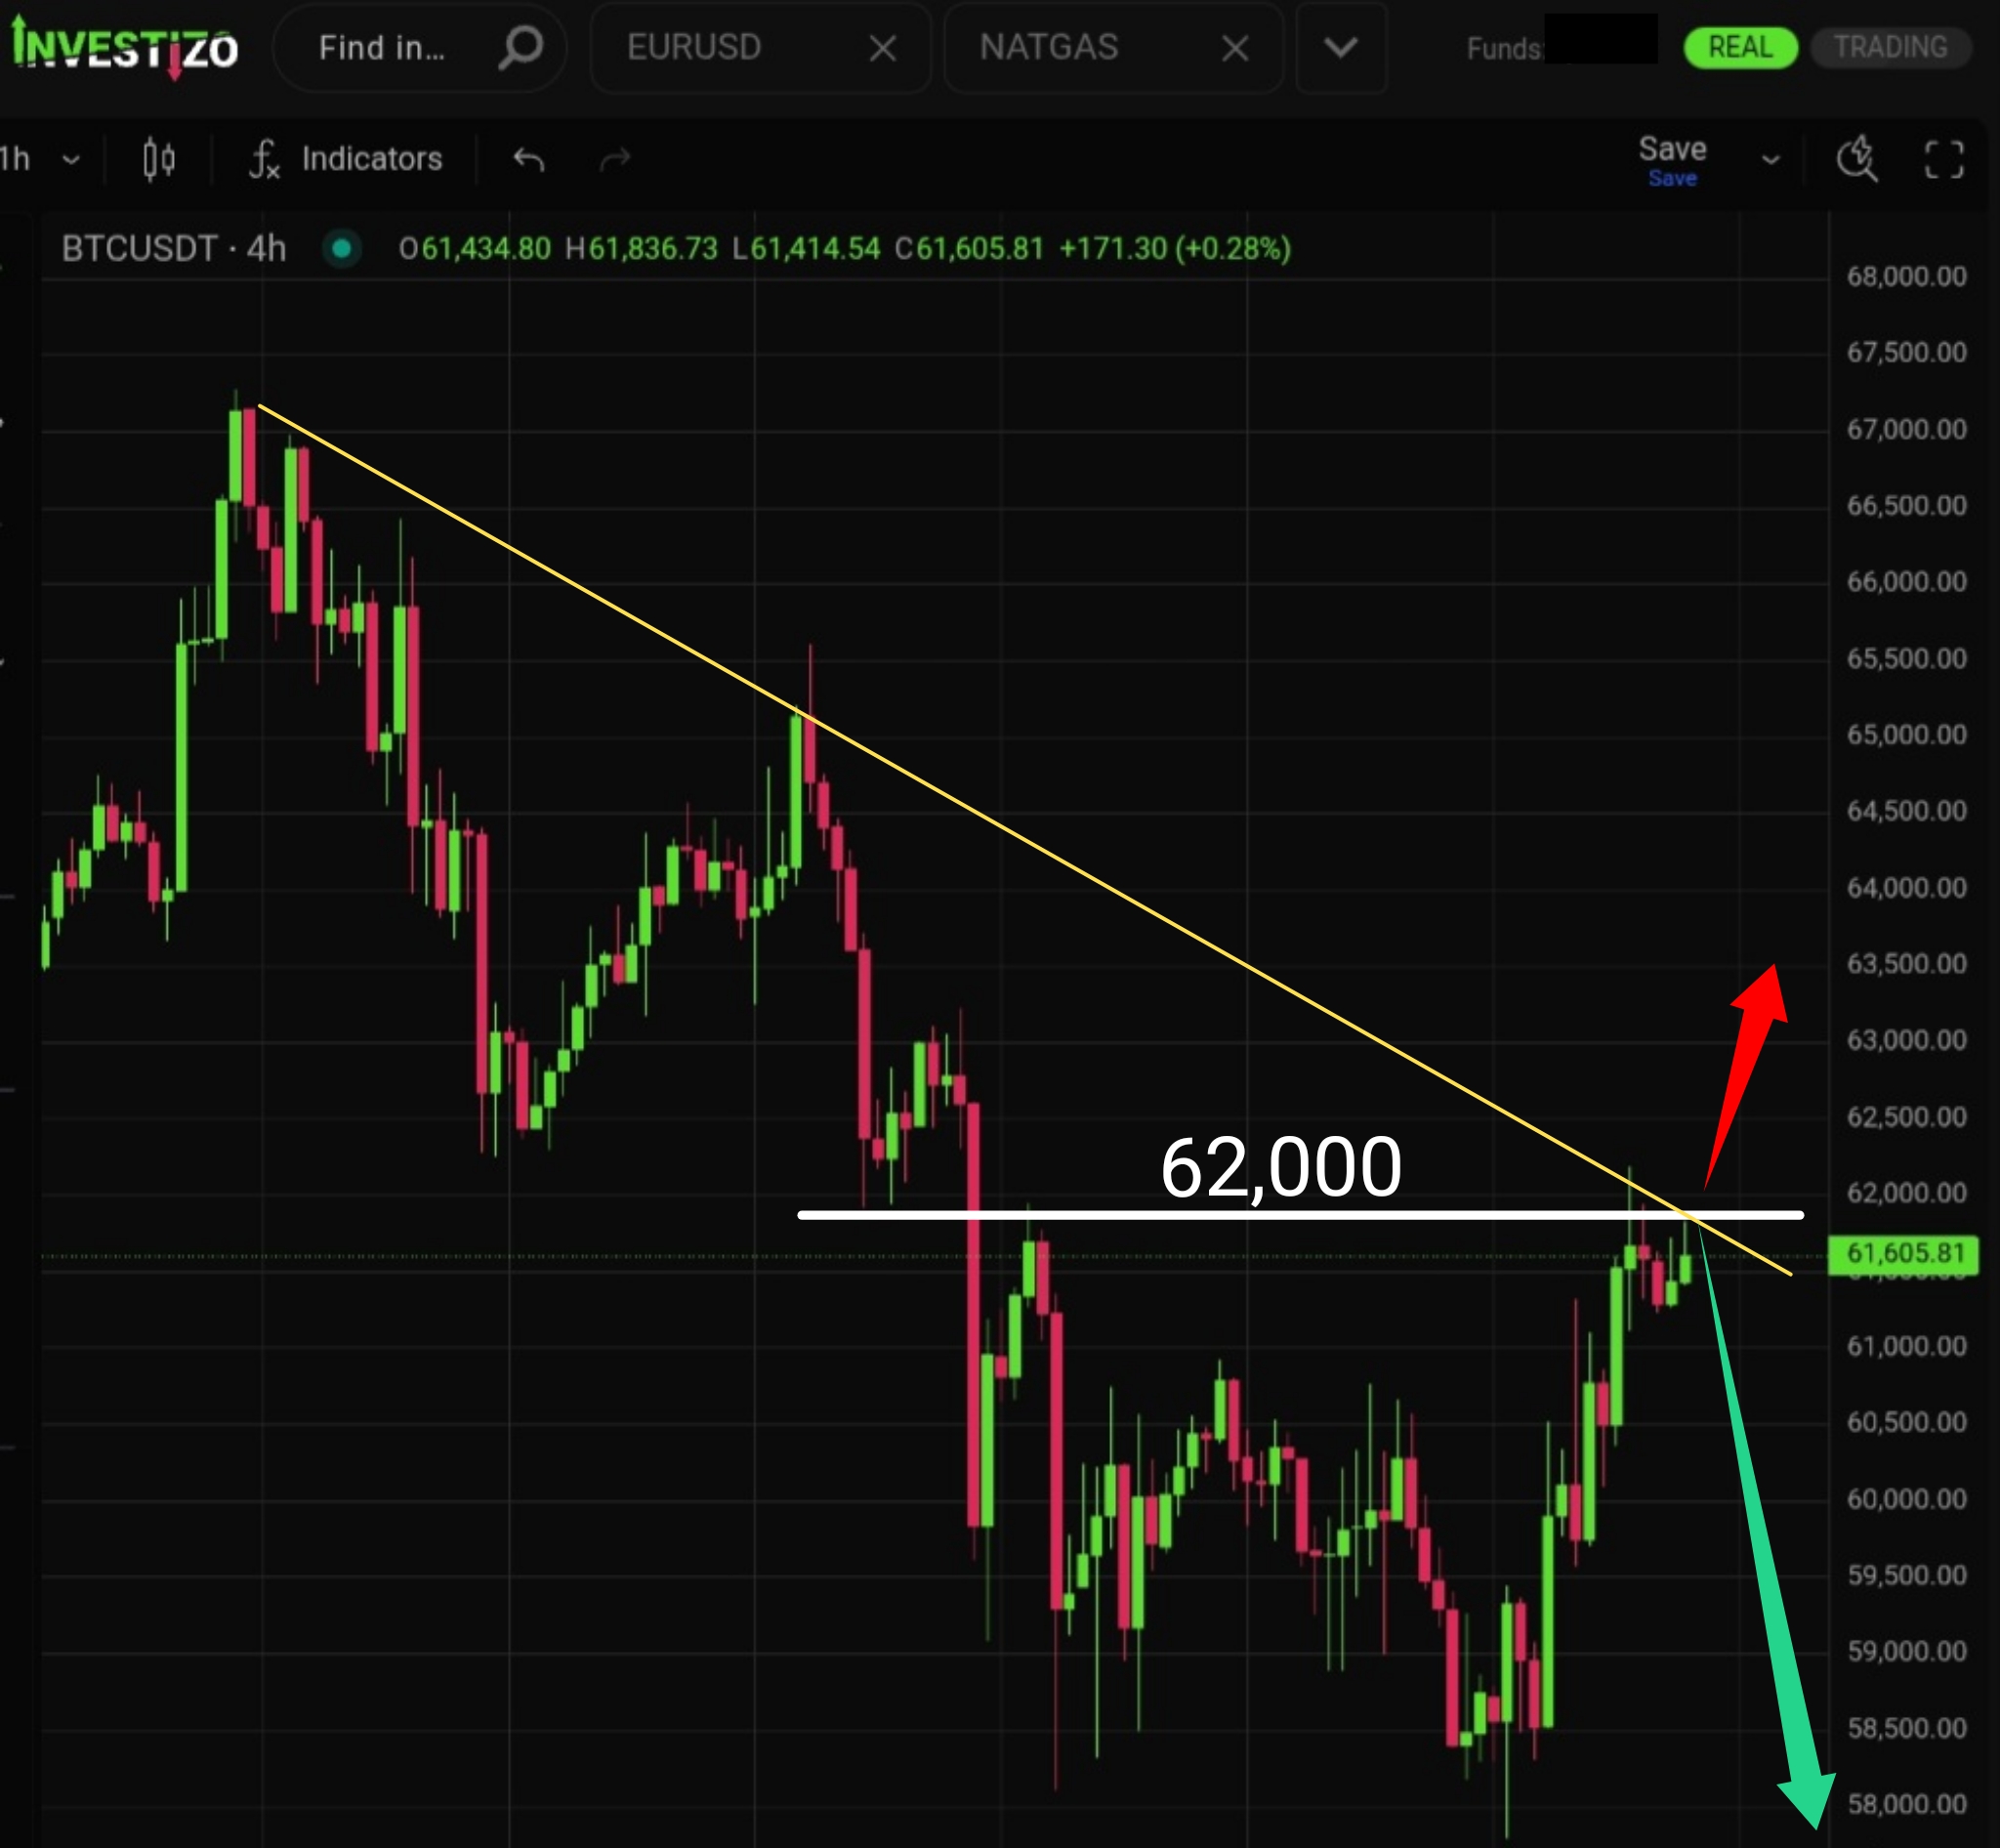
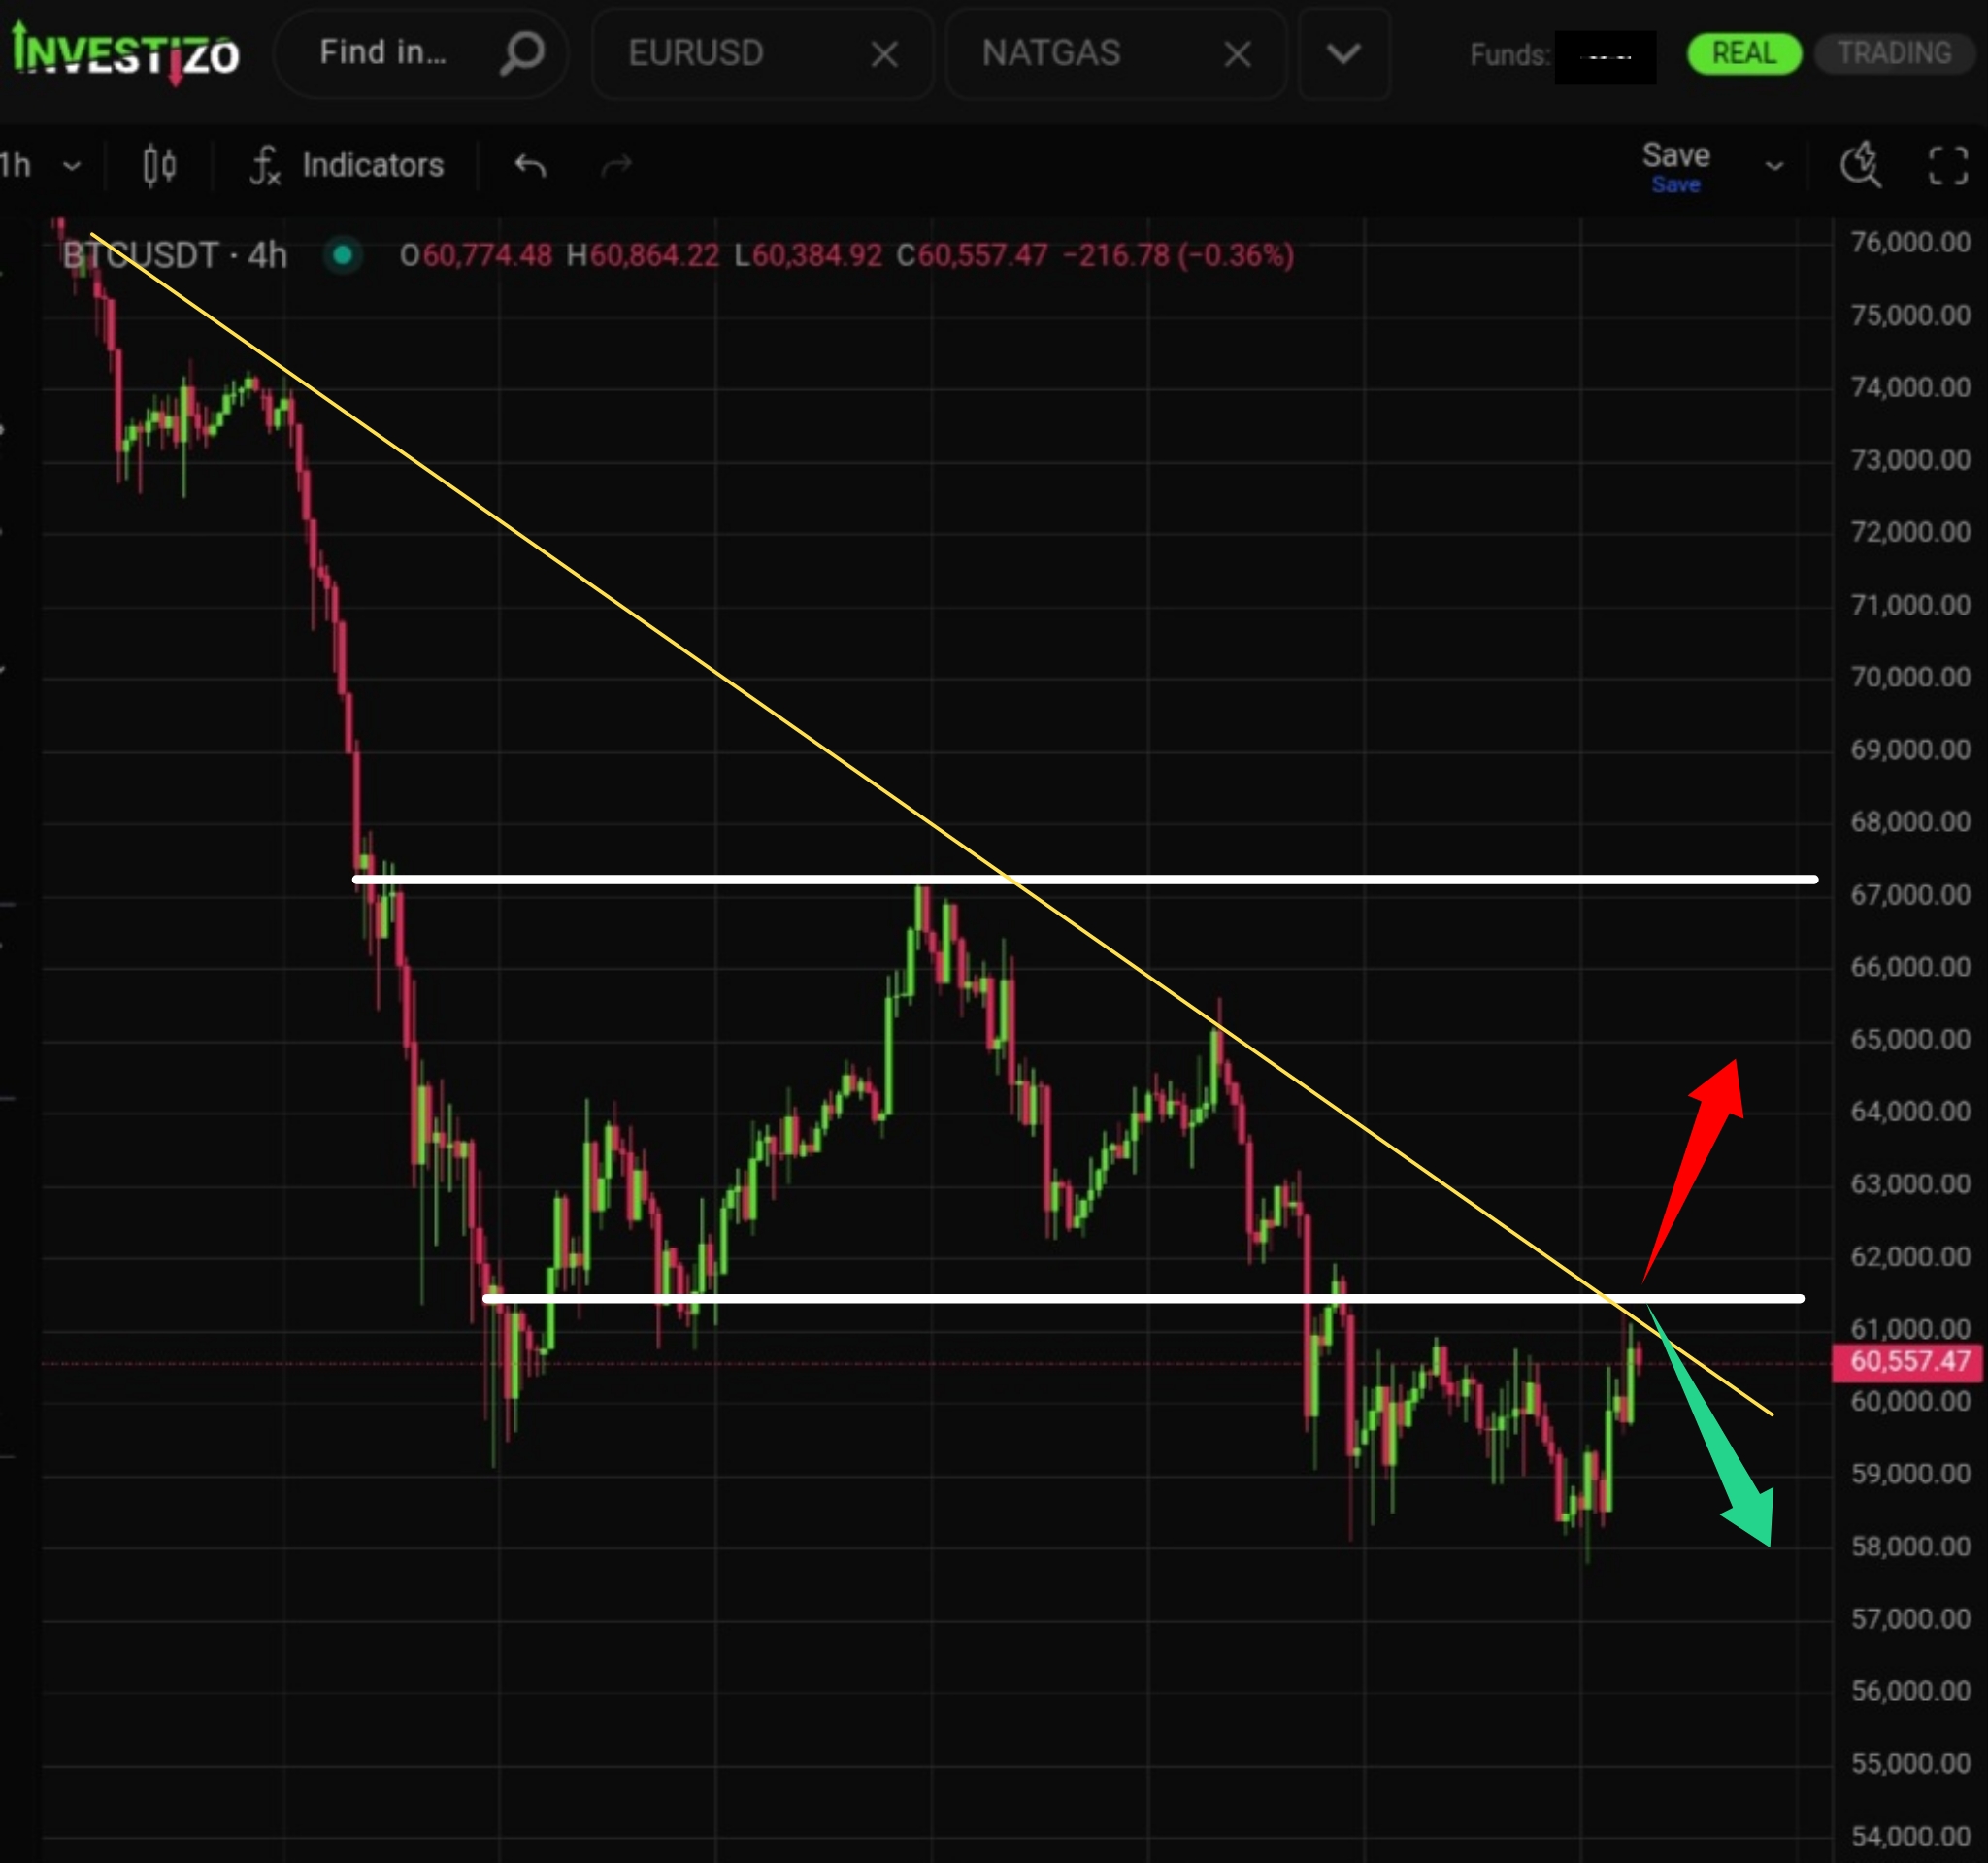
The asset continues to consolidate below the critical $62,000 level, which serves as a key battleground for both bears and bulls.
Spot Gold holds steady in early Friday trading, priced at $4,167 as the market consolidates its recent momentum above the $4,150 technical threshold.
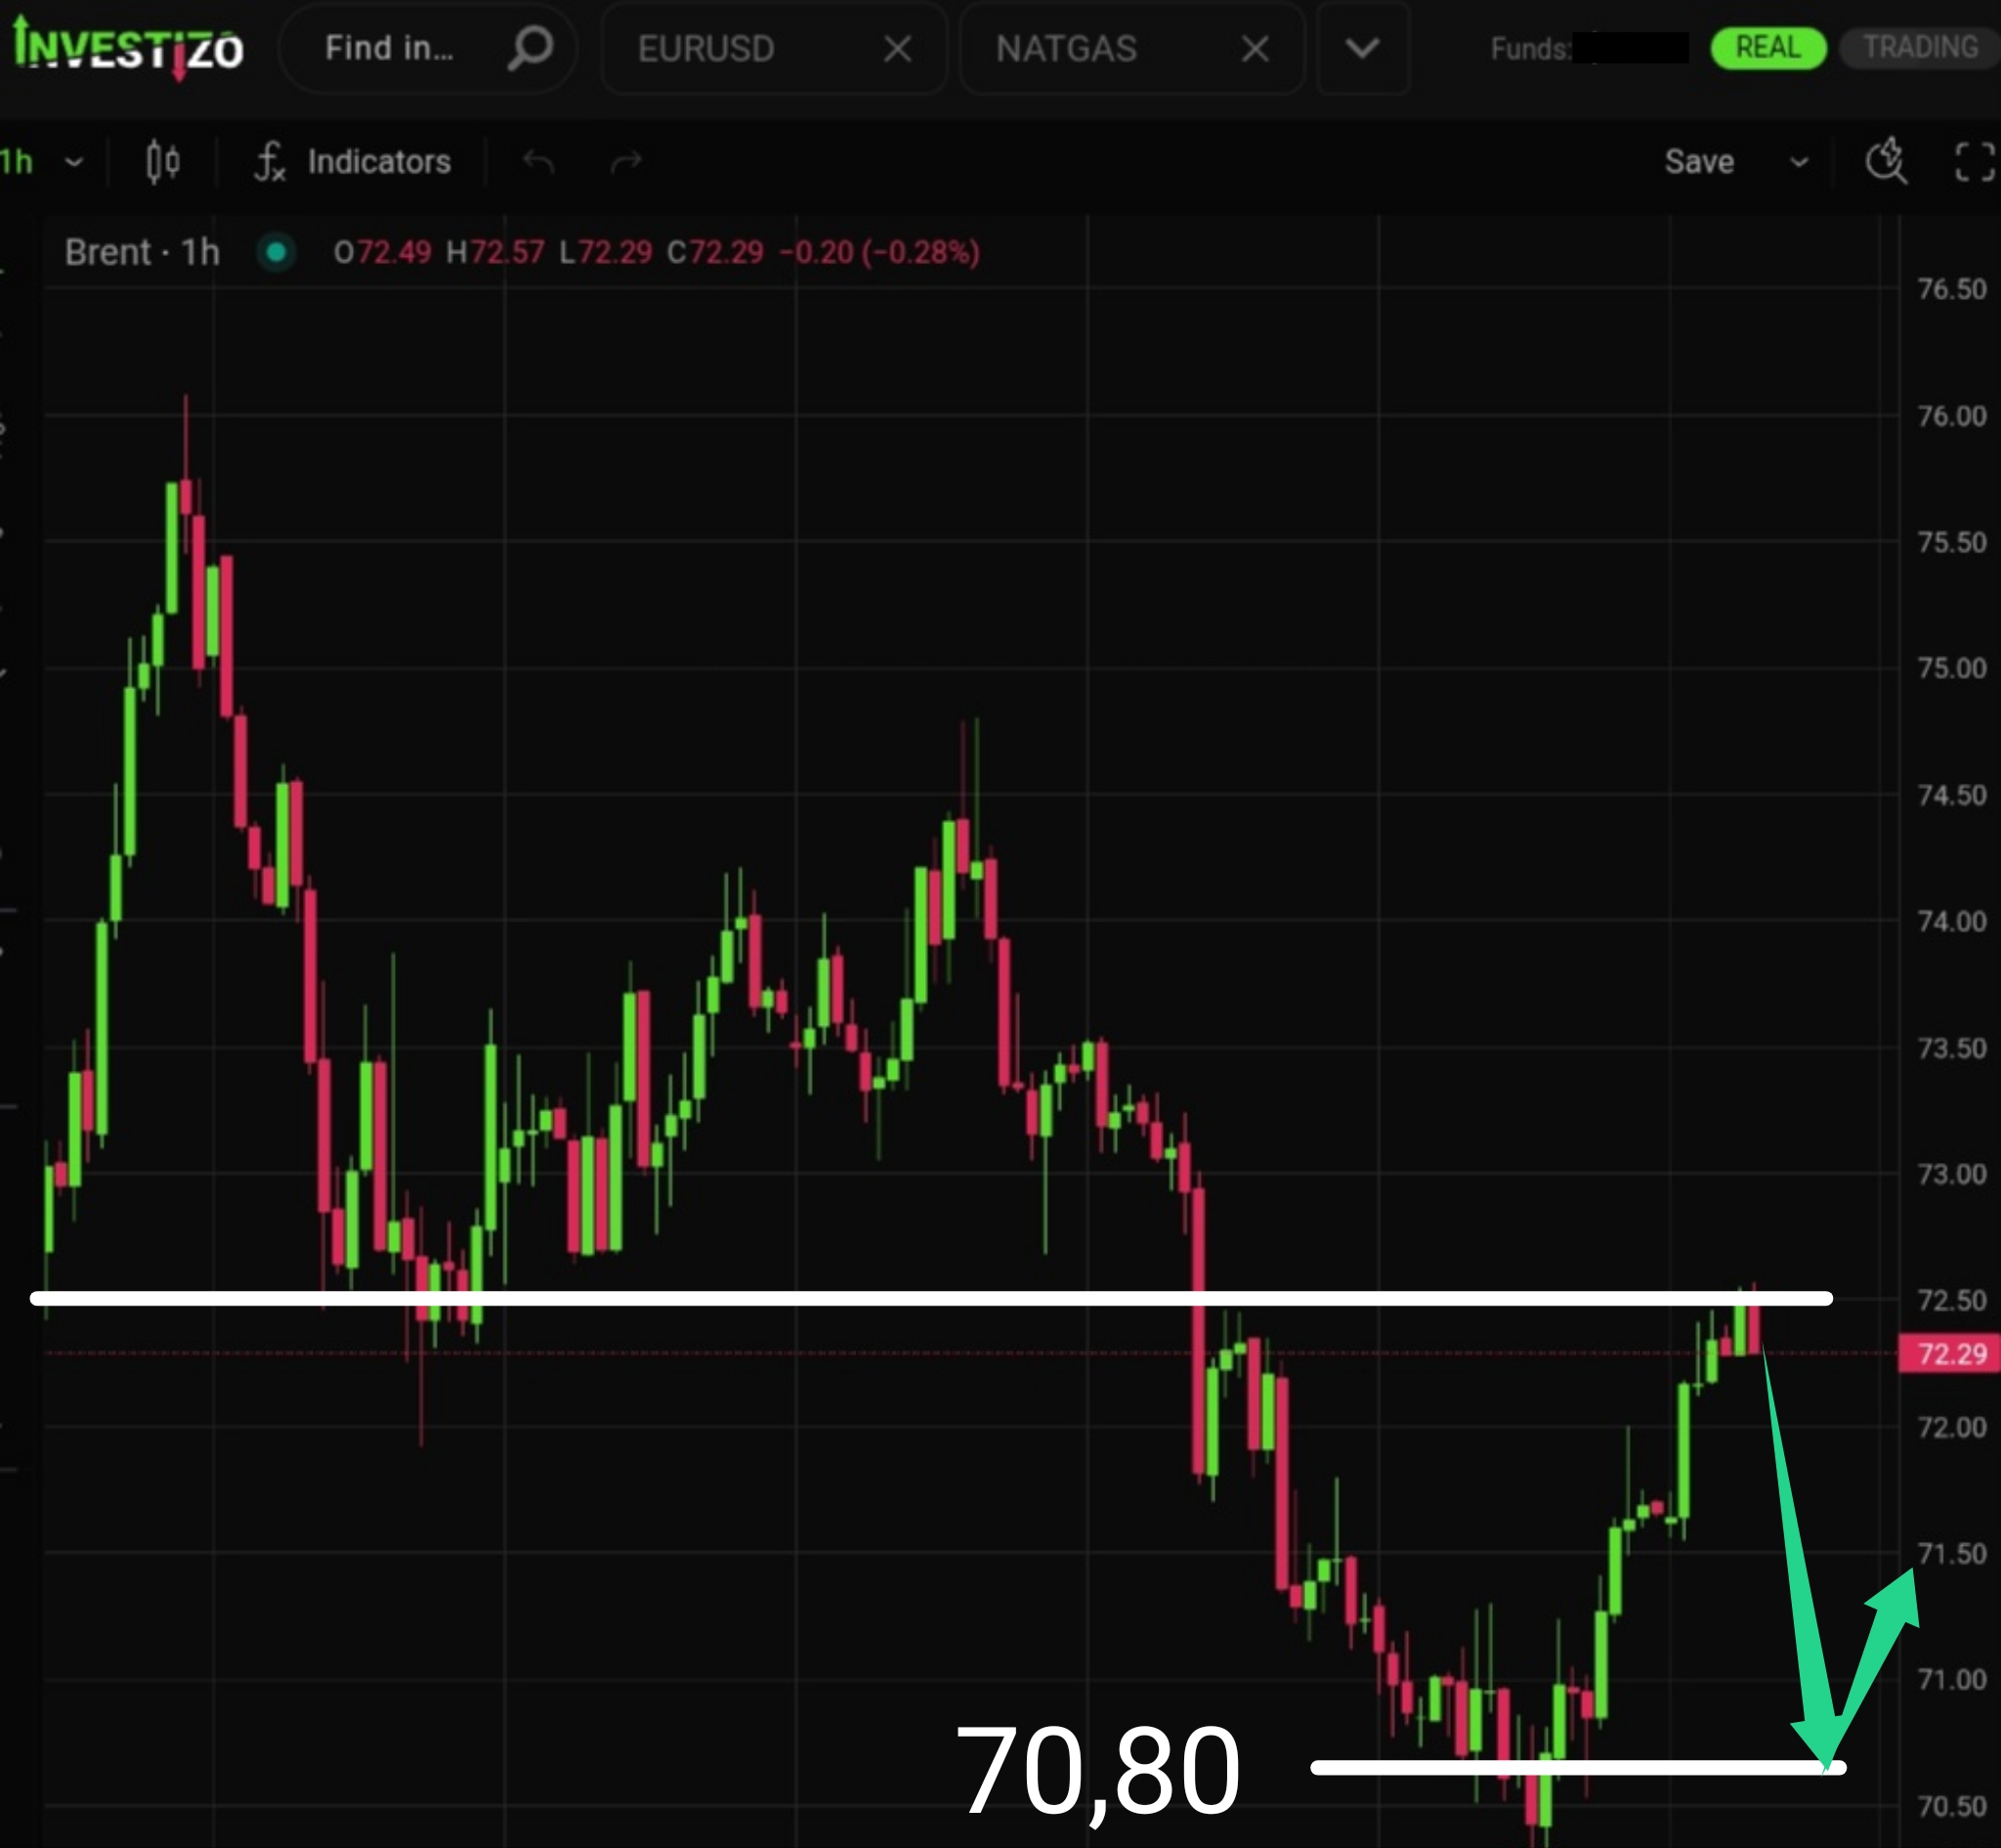
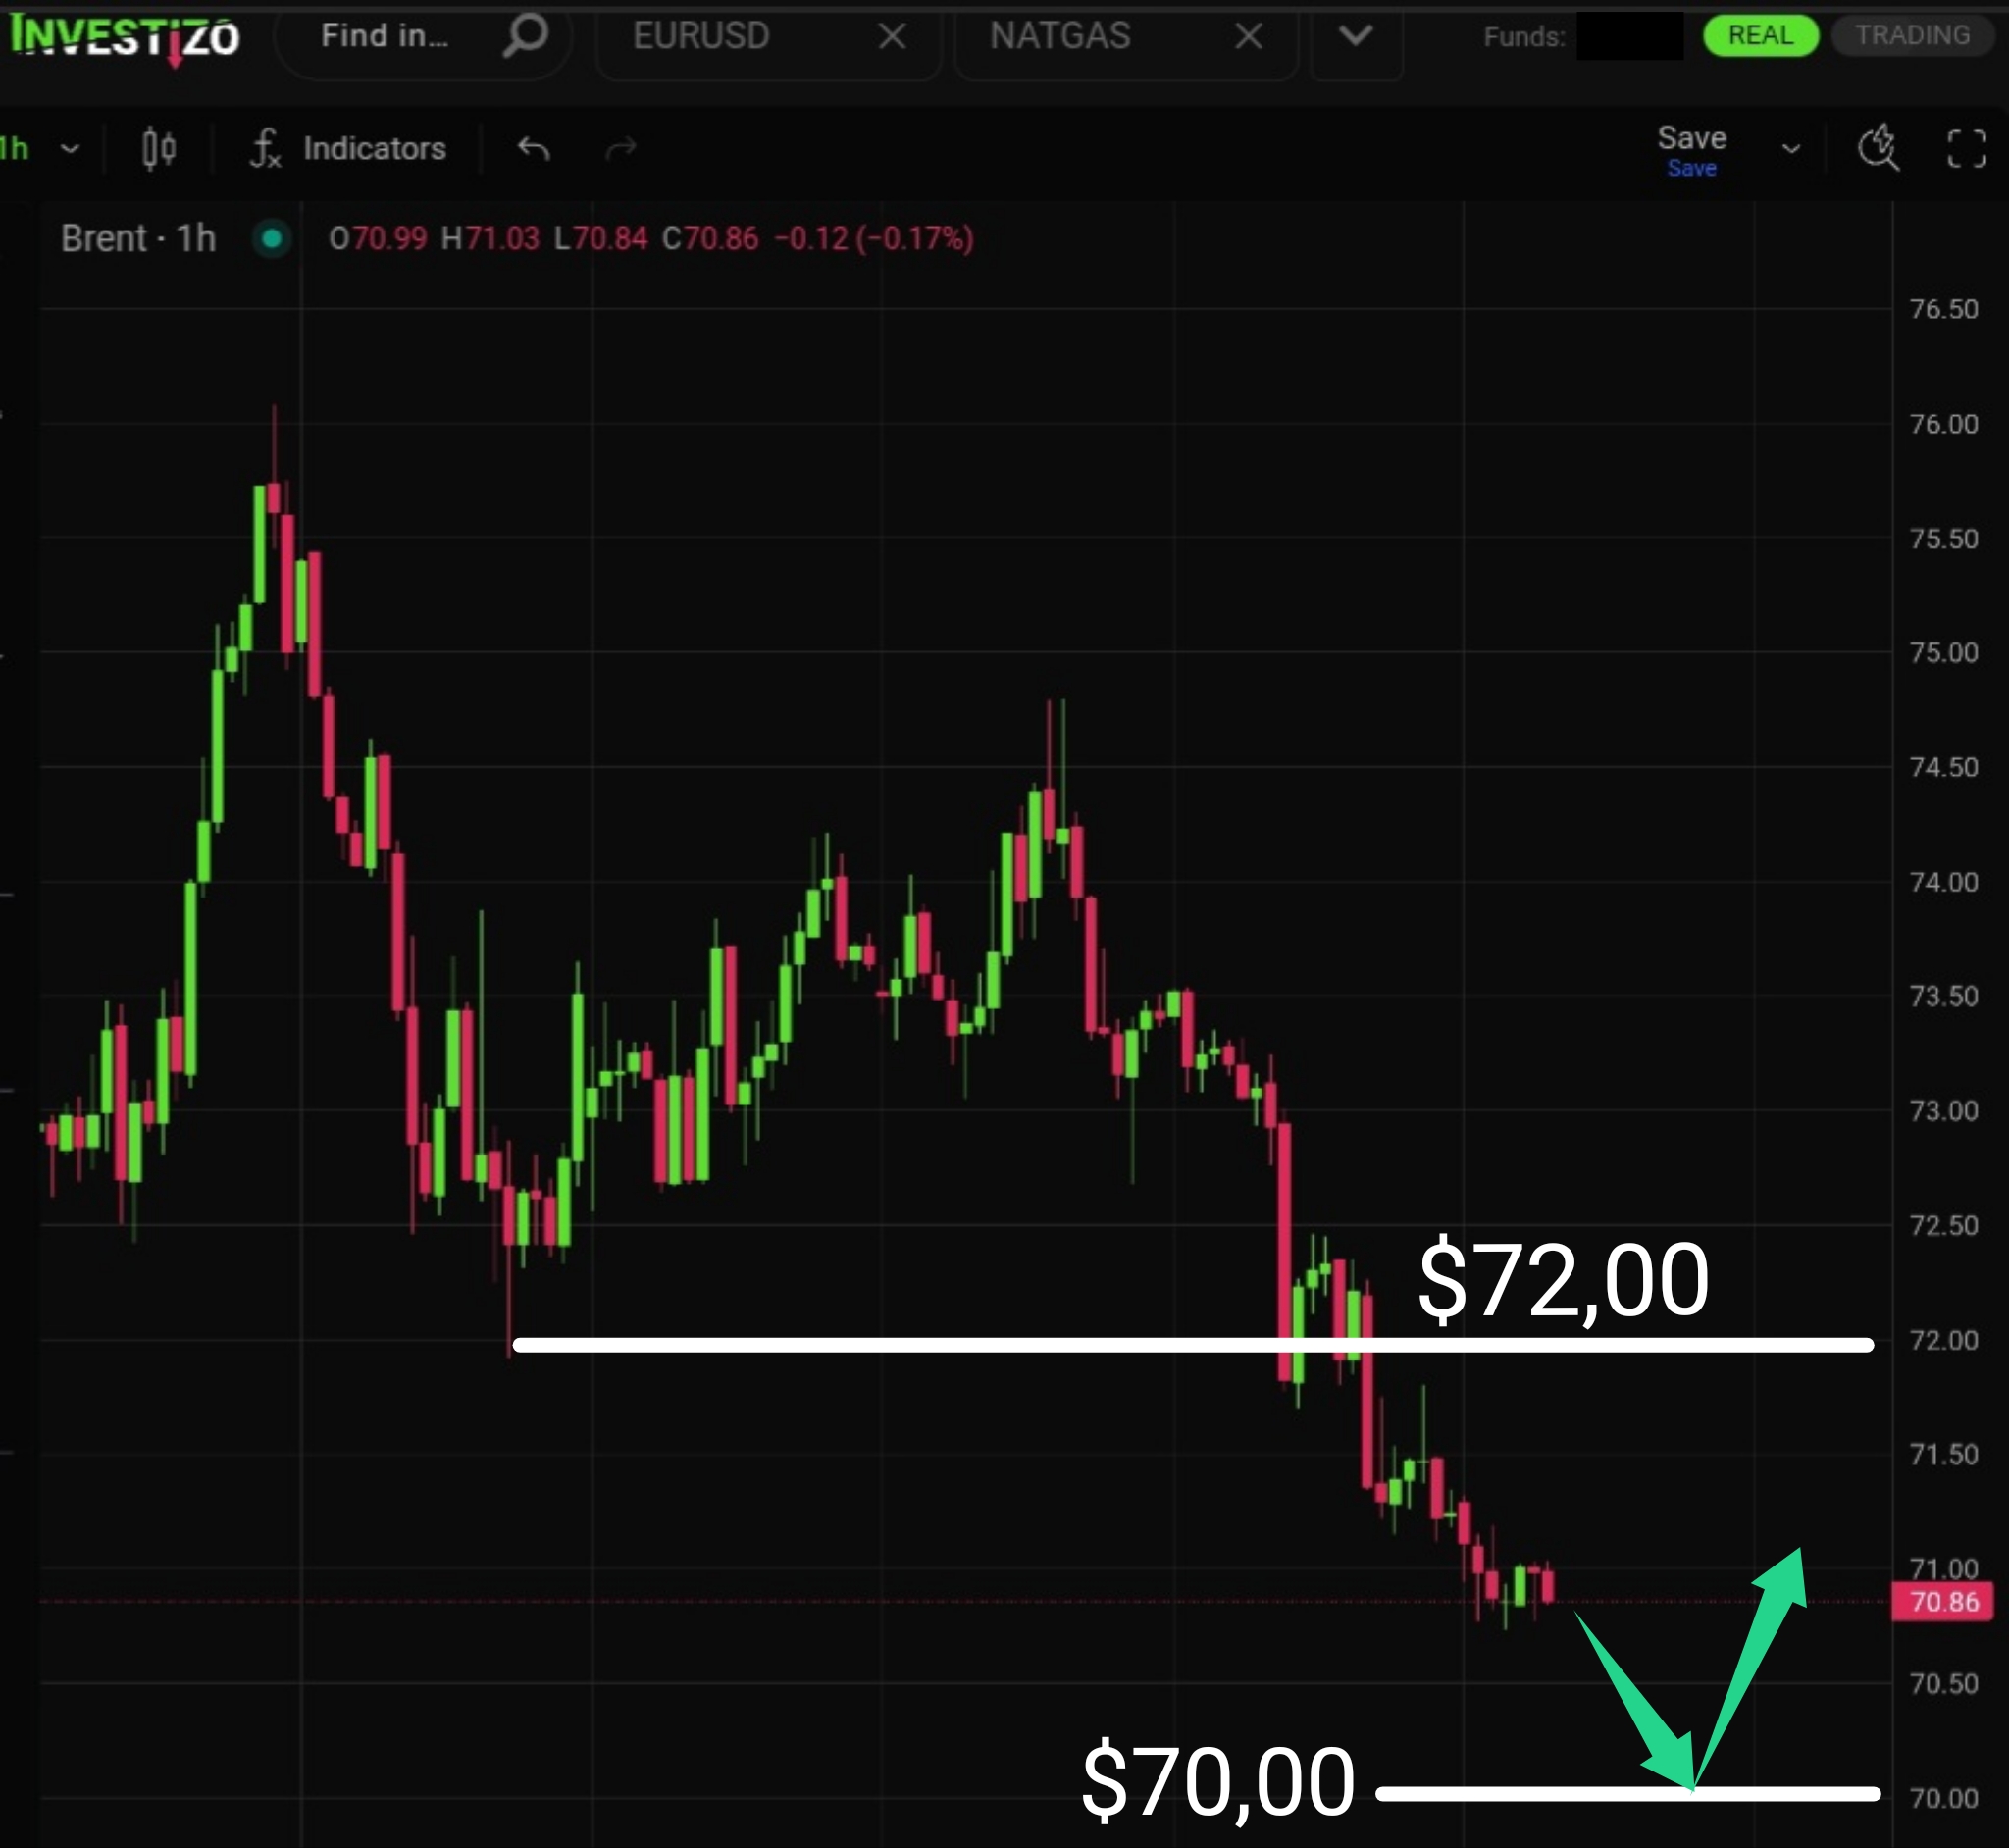
Brent Crude enters the morning session trading lower at $72.30, consolidating its recent down-shift as the market balances a rapid recovery in Middle Eastern supply against unresolved long-term transit costs
Сообщаем вам, что в связи с празднованием Дня независимости США торговые часы по ряду инструментов будут временно изменены.
The asset remains inside an ascending channel but is currently in its downward phase.
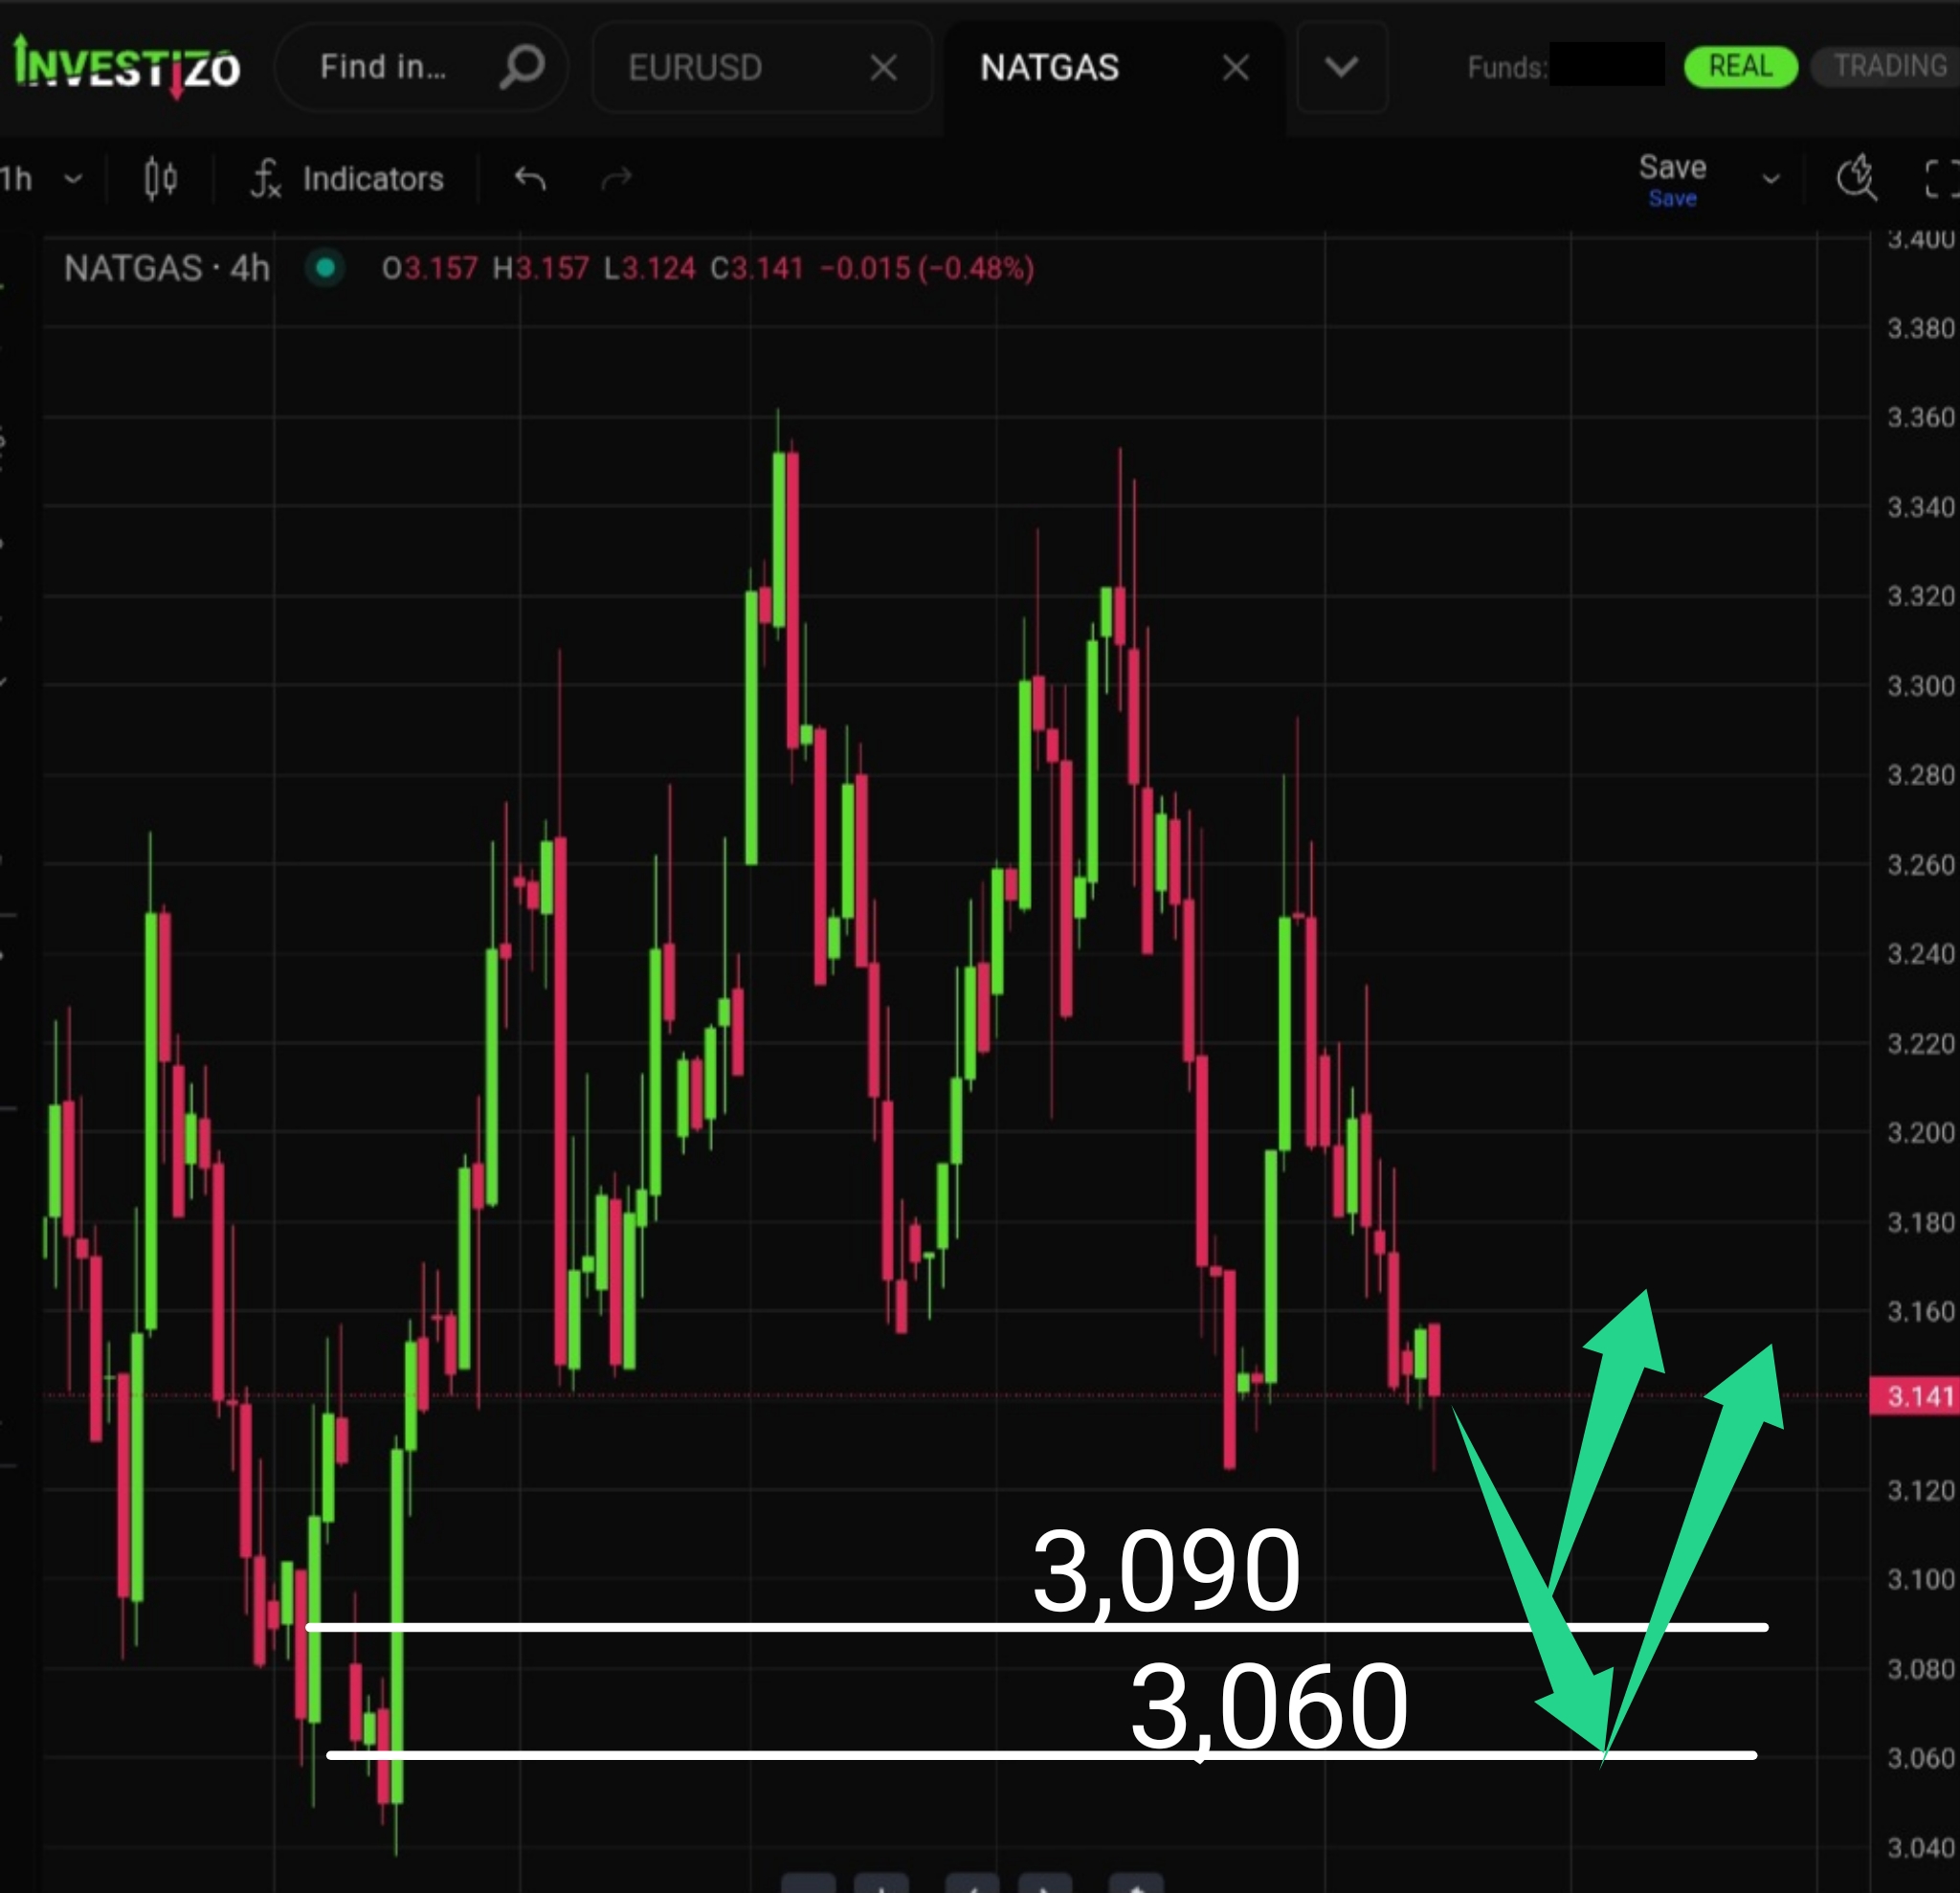
The asset continues its steady decline toward the key support zone at 3.060.
The pair remains within the broader bullish trend, yet early signs of a potential breakdown are emerging on lower timeframes.
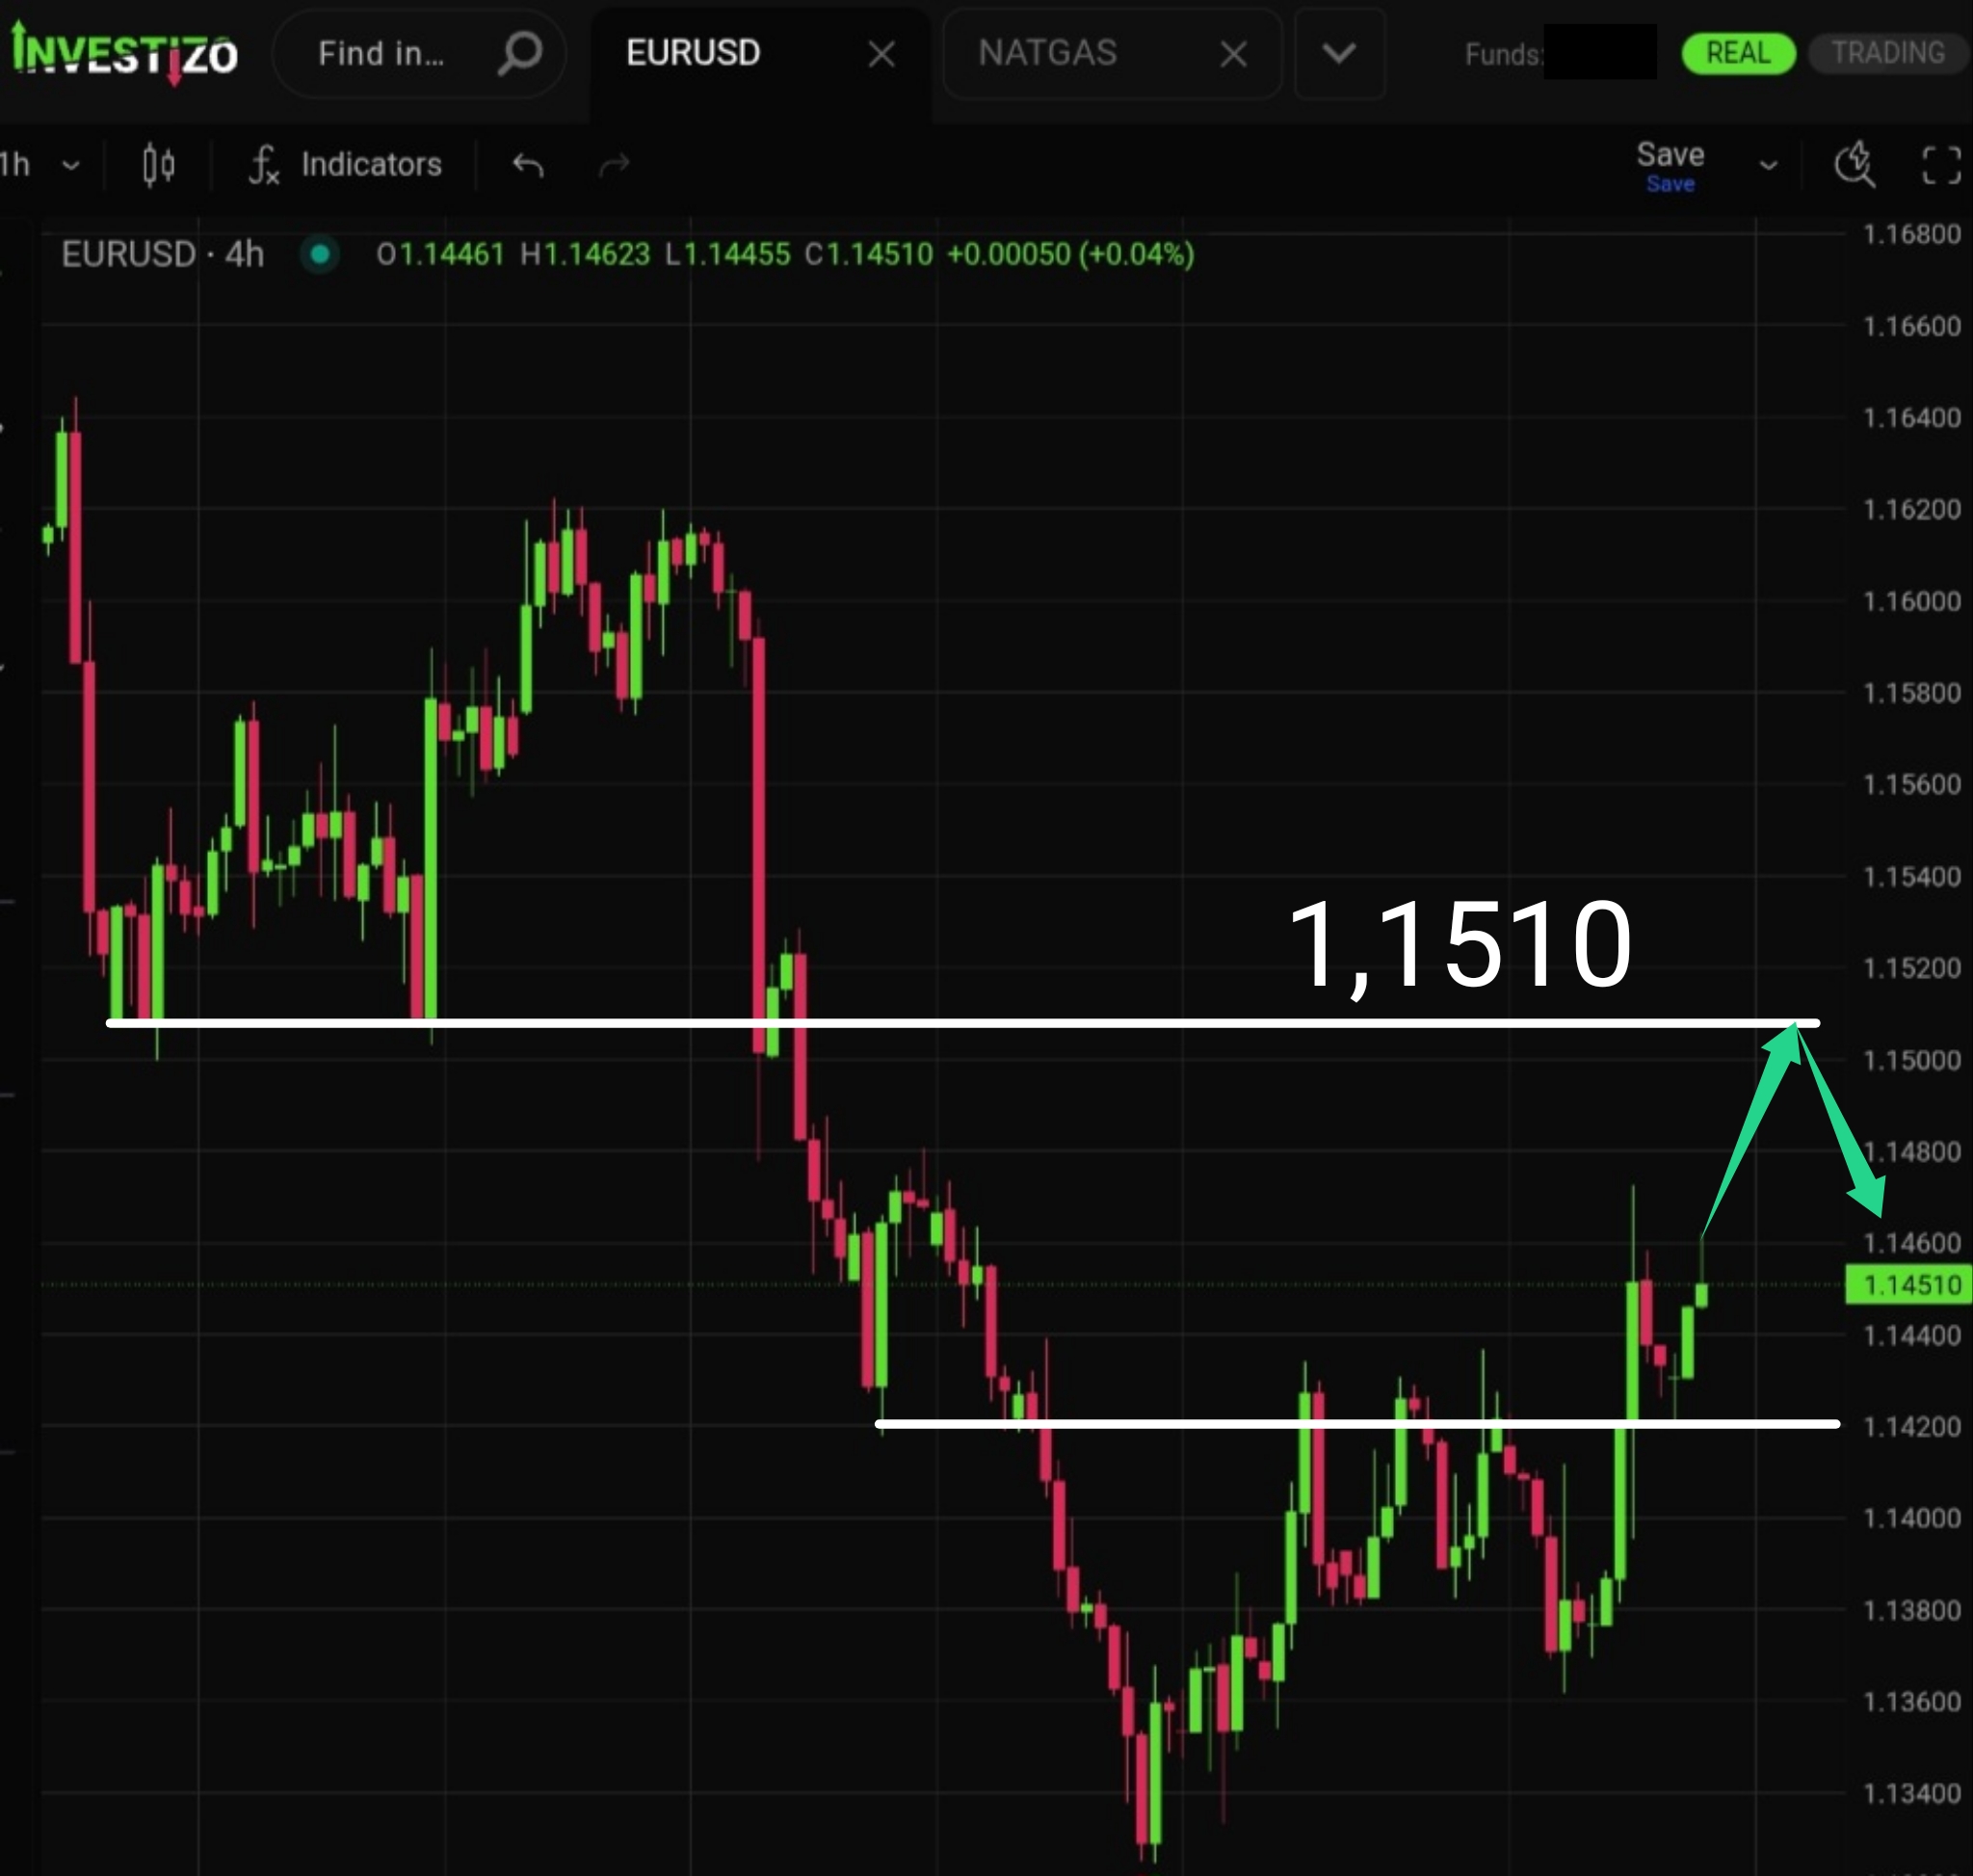
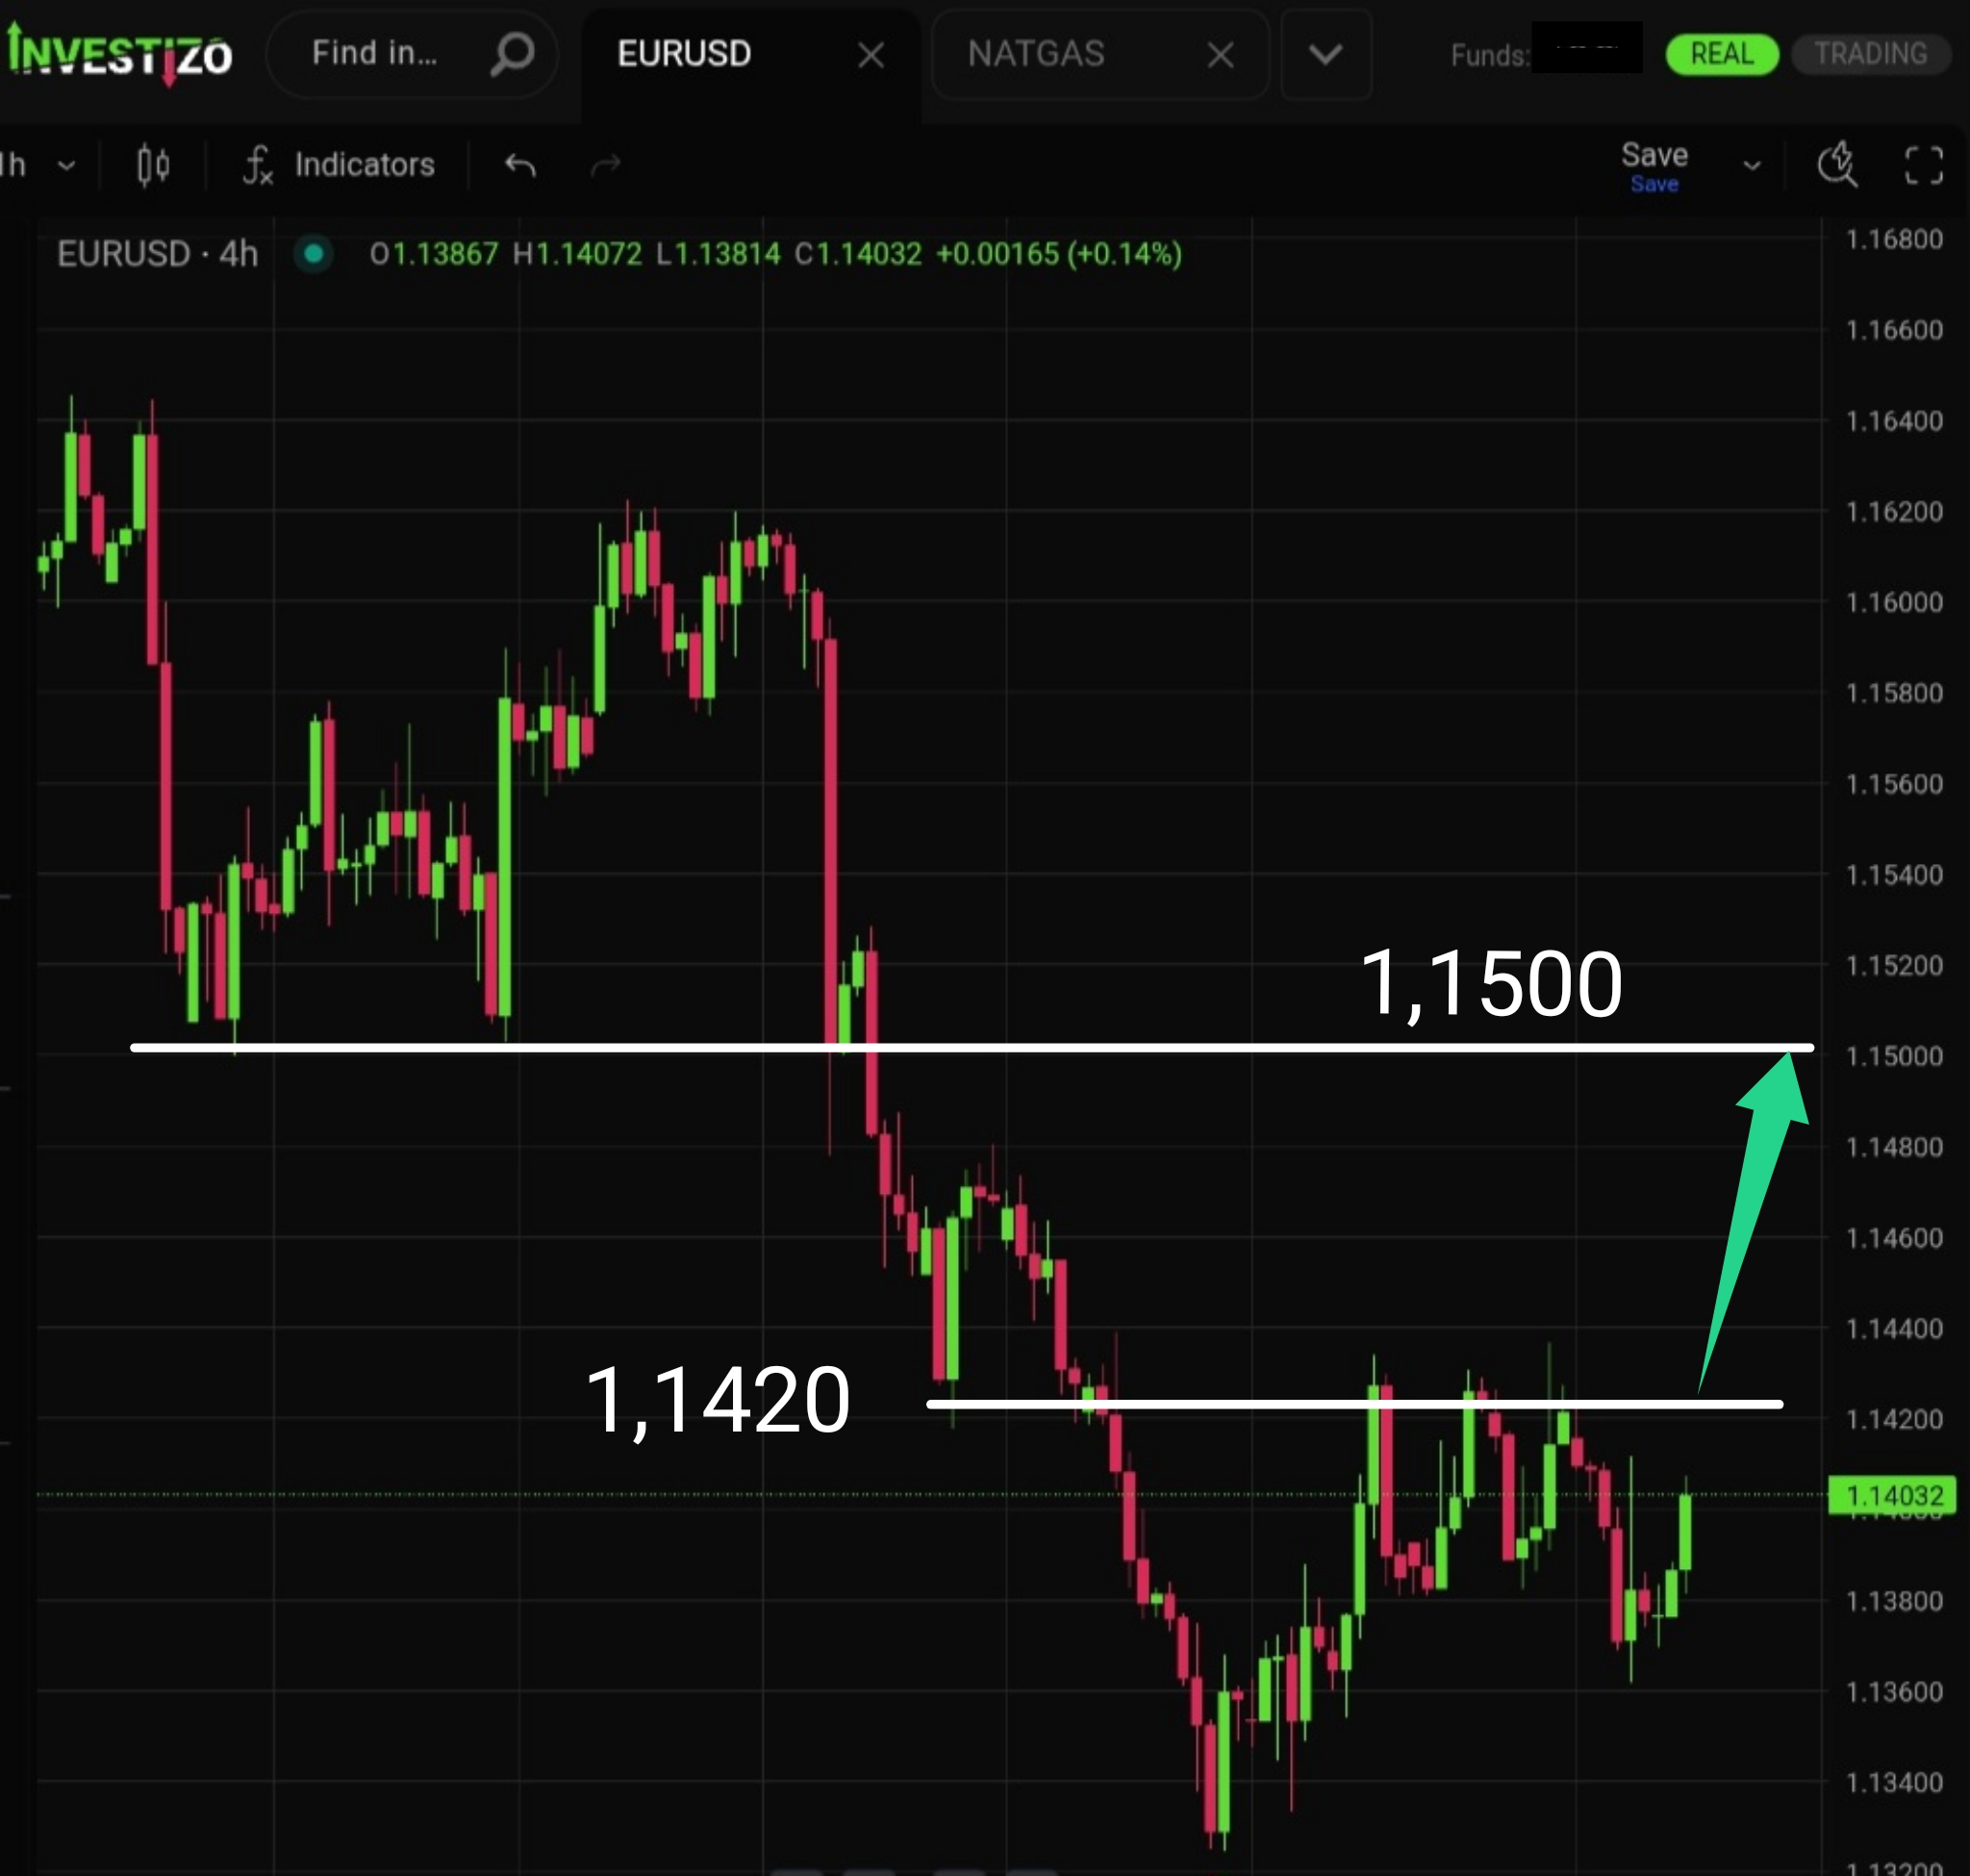
The pair is forming a steady upward reversal. The key resistance level is at 1.1420.
Despite a solid surge yesterday that enabled Bitcoin to reclaim the key psychological level of $60,000, the asset still needs to accomplish significantly more to establish convincing conditions for a genuine trend reversal.
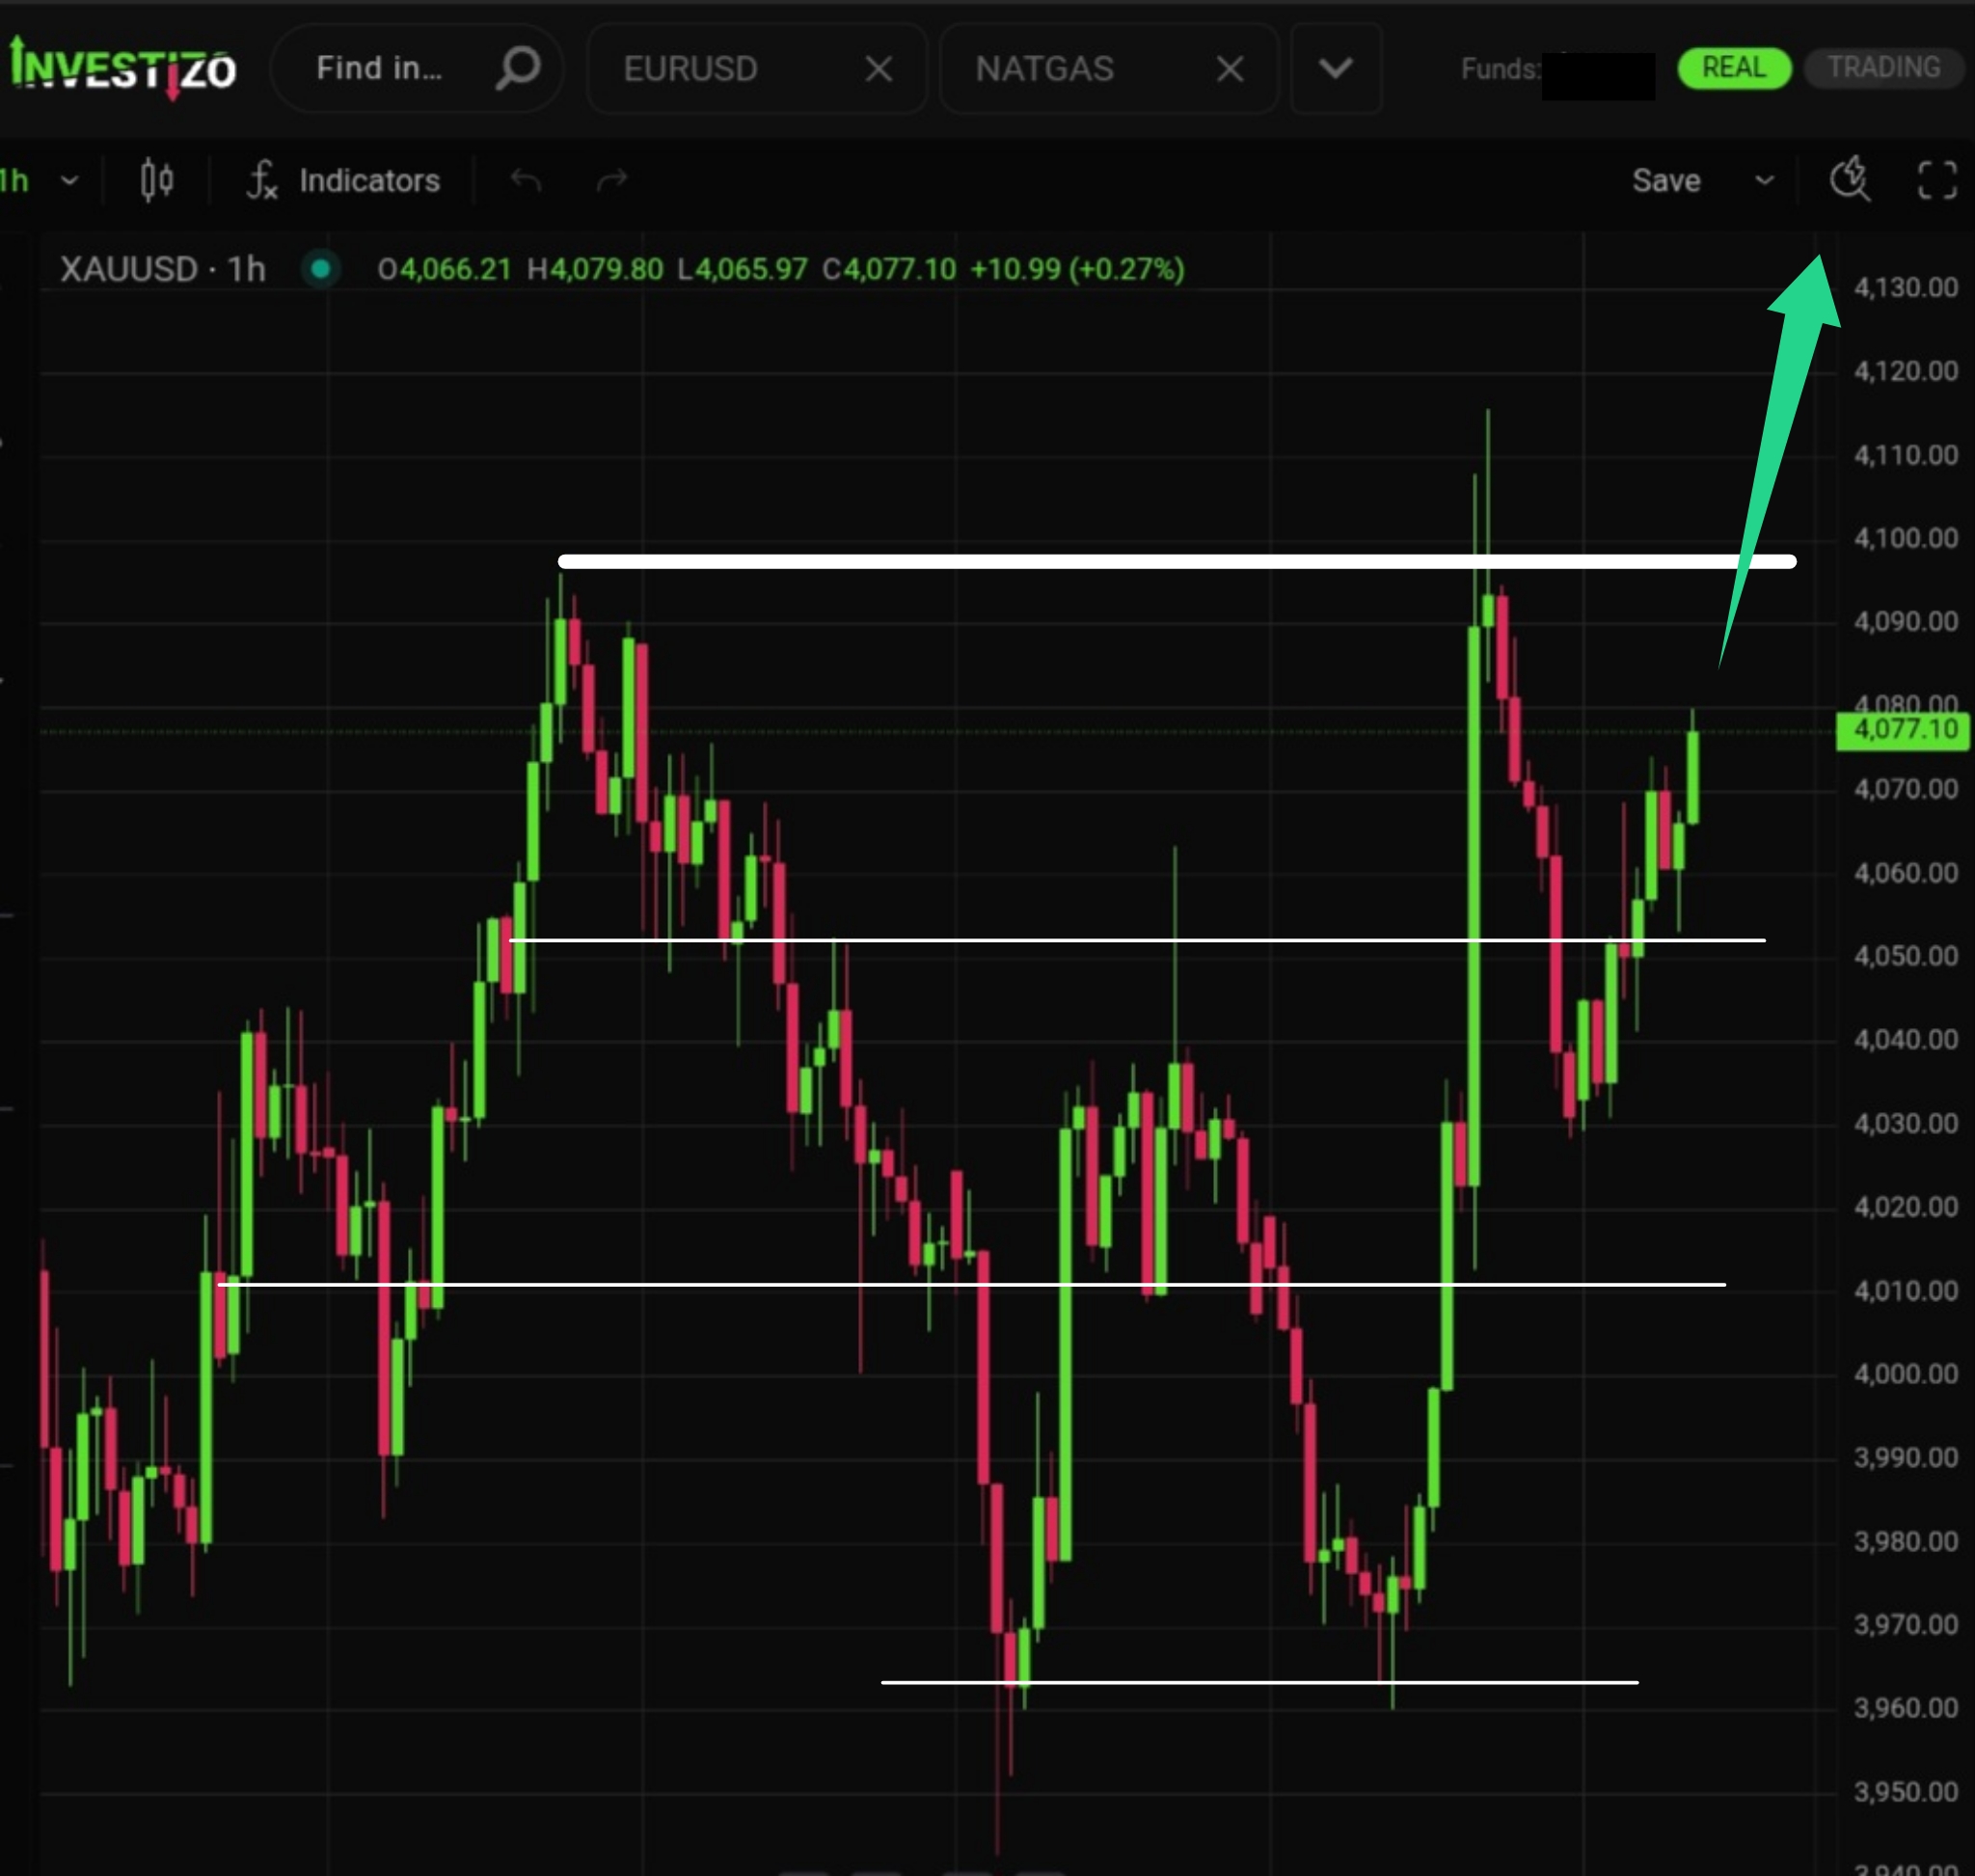
Spot Gold starts the morning session trading firmly at $4,077, maintaining its historic secular ascent as macro asset allocators continue to seek systemic protection.
Brent Crude enters the morning session trading at $70.86, reflecting sustained downward pressure as the market actively searches for a firm structural floor.
The downtrend remains intact. However, the recent formation of a new low opens the door for an upward technical correction.