
Fundamental analysis of WTI
WTI crude oil prices have recently declined amid growth in previous trading.
Investors are cautious ahead of the upcoming OPEC+ meeting. OPEC+ is also expected to discuss additional production cuts depending on the state of the global economy and oil demand forecasts. At the center of the dispute is whether Saudi Arabia's main oil producer should ask other OPEC+ members to join the production cuts. Given the complexity of negotiating quota agreements, individual producers can make their own changes.
Oil prices have fallen 16% since late September amid concerns about the stability of U.S. oil production and demand, especially from China. The US is forecast to fall into recession by 2024, and recession warnings are coming from major US retailers. Further impacting market conditions will be reports of crude oil and gasoline futures in the US.
The slowdown in global economic growth appears to be dampening the chances of a recovery from the expected OPEC+ production cuts. Economic indicators reflect concerns about rising inflation, higher interest rates and lower consumer spending. Given current market conditions, the short-term outlook remains bearish.
Investors and traders look to global economic indicators and OPEC+ decisions for upcoming events such as the Federal Open Market Committee (FOMC) meeting minutes and the oil price index. US crude oil will have a significant impact on WTI prices.
Technical Analysis and Scenarios:
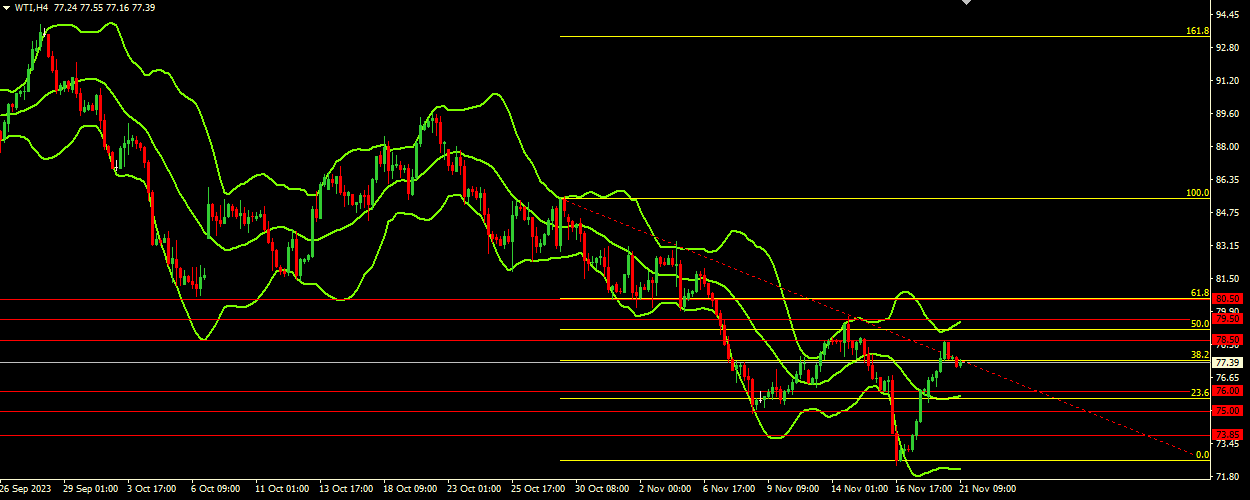
The Bollinger Bands are pointing horizontally, indicating a widening price range. The current price is in the upper range of the Bollinger Bands, indicating an uptrend. The current price position near the upper Bollinger Band indicates that the upward momentum is still in place. However, as the price is near the upper band, it may encounter resistance near the levels of $78.50 and $79.50. Technical indicators point to the possibility of continued upward momentum in the short term and key resistance levels are at $78.50, $79.50 and $80.50. However, traders should be cautious of a possible reversal or consolidation, especially if price starts to approach or cross support levels at $76.00, $75.00 and $73.85.
Main Scenario (SELL)
Recommended entry level : 76.00
Take Profit: 75.00
Stop Loss: 76.50
Alternative scenario (BUY)
Recommended entry level: 78.50
Take Profit: 79.50
Stop loss: 78.00