Technical analysis USDCAD for 06.12.2023
٠٦.١٢.٢٠٢٣ ١٦:٣٠
خلال اليوم
فني
The Tenkan-sen line is located above the Kijun-sen line. Both lines are horizontal. Confirmatory line Chikou Span is above the price chart. In this case, the cloud is descending. Instrument is trading below the Tenkan-se and Kijun-sen lines. The closest support is the level 1.35525. The closest resistance is the level 1.35725
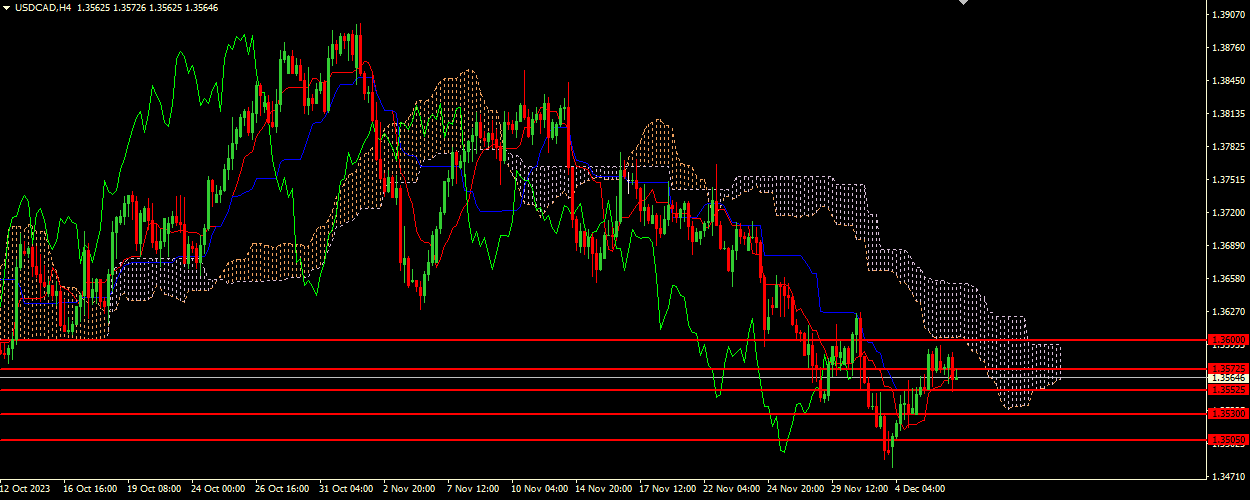
Key levels
- 1.36000, 1.35725, 1.35525, 1.35300, 1.35050
Trading scenario
- Recommended opening short positions (Sell Stop) from the level of 1.35525, with Take Profit of 1.35300 and Stop Loss of 1.35725
Alternative scenario
- Recommended opening long positions (Buy Stop) from the level of 1.35725, with Take Profit of 1.36000 and Stop Loss of 1.35525
السيناريوهات
التوصيات
SELL STOP
نقطة الدخول
1.35525
جني الأرباح
1.35300
إيقاف الخسارة
1.35725
المستويات الرئيسية
1.36000, 1.35725, 1.35525, 1.35300, 1.35050
السيناريو البديل
التوصيات
BUY STOP
نقطة الدخول
1.35725
جني الأرباح
1.36000
إيقاف الخسارة
1.35525