Technical analysis USDCAD for 23.04.2024
٢٣.٠٤.٢٠٢٤ ١٨:٣٨
خلال اليوم
فني
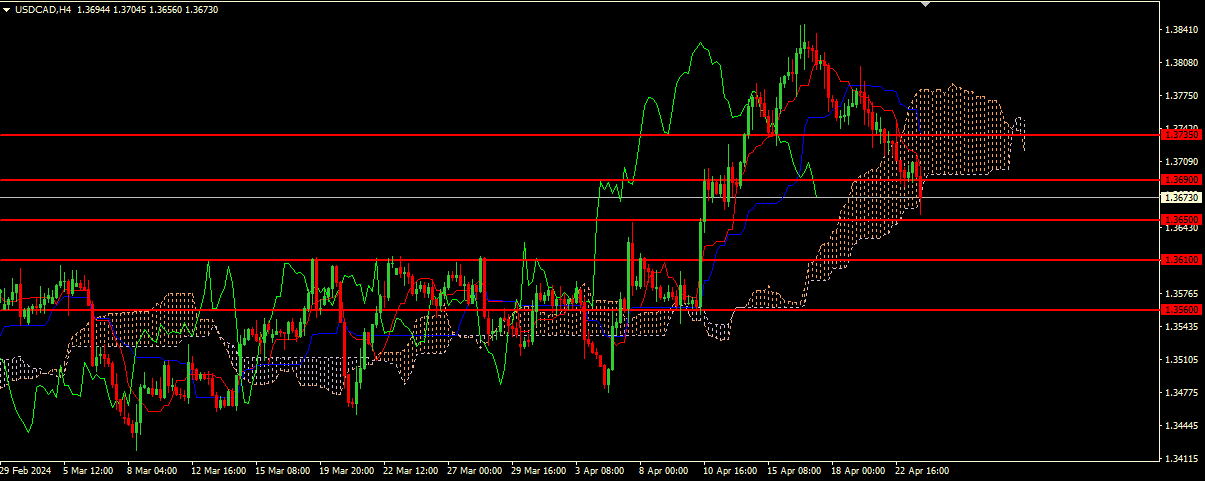
The Tenkan-sen line is located below the Kijun-sen line. Both lines are directed downward. Confirmatory line Chikou Span is below the price chart. In this case, the cloud is descending. Instrument is trading below the Tenkan-se and Kijun-sen lines. The closest support is the level 1.36500. The closest resistance is the level 1.36900
Key levels
- 1.37350, 1.36900, 1.36500, 1.36100, 1.35600
Trading scenario
- Recommended opening short positions (Sell Stop) from the level of 1.36500, with Take Profit of 1.36100 and Stop Loss of 1.36900
Alternative scenario
- Recommended opening long positions (Buy Stop) from the level of 1.36900, with Take Profit of 1.37350 and Stop Loss of 1.36500
السيناريوهات
التوصيات
SELL STOP
نقطة الدخول
1.36500
جني الأرباح
1.36100
إيقاف الخسارة
1.36900
المستويات الرئيسية
1.37350, 1.36900, 1.36500, 1.36100, 1.35600
السيناريو البديل
التوصيات
BUY STOP
نقطة الدخول
1.36900
جني الأرباح
1.37350
إيقاف الخسارة
1.36500