
XAUUSD H1: The Chaos Theory Forecast for the American Session on 27.12.2024
Technical
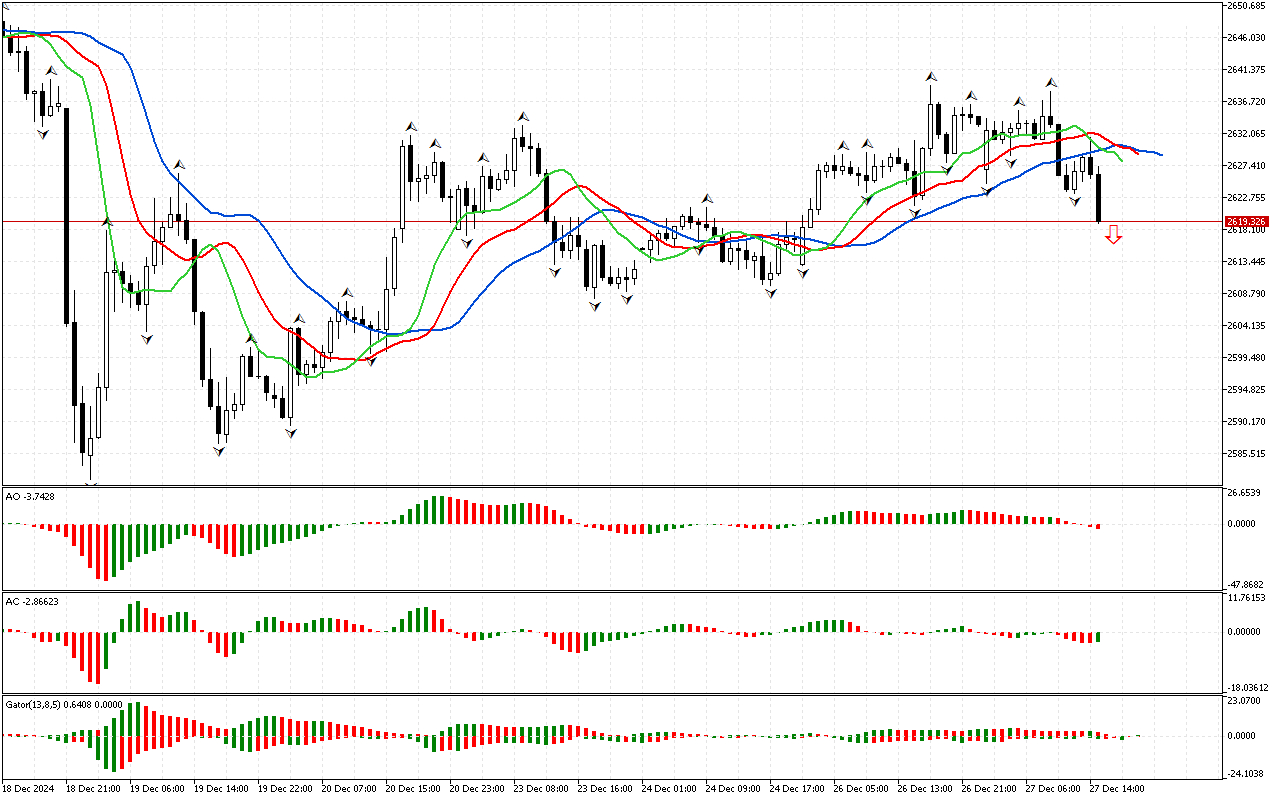
The price has fallen below the lower fractal on the chart. This defines the phase space as southern. Accordingly, the most probable scenario for the price change is its decrease....
The price has fallen below the lower fractal on the chart. This defines the phase space as southern. Accordingly, the most probable scenario for the price change is its decrease. To assess the prospects for the development of this movement, other market dimensions will be analyzed.
At the same time, the AO indicator remains in the negative zone.
The two red bars located below the zero line on the Accelerator Oscillator indicator show an increase in energy in the southern phase of the market.
Signals from the AC and AO indicators indicate that the market has sufficient strength and energy to reduce the price further.
The color of the histograms of the Gator indicator changes, so this indicator has not formed a clear signal yet.
As an epilogue to the analysis, the southern direction of price movement is noted to be considered as a priority. At the same time, the indicators contain signals about the possible development of a correction, which should be used to search for entry points at more beneficial prices.
📊 Sell Stop 2618.973
❌ Stop Loss 2631.084
After entering the market, Stop Loss is moved along the red line after closing each candle. The profit is fixed by moving Stop Loss, or when opposite signals appear on the AO, AC, Gator indicators.
At the same time, the AO indicator remains in the negative zone.
The two red bars located below the zero line on the Accelerator Oscillator indicator show an increase in energy in the southern phase of the market.
Signals from the AC and AO indicators indicate that the market has sufficient strength and energy to reduce the price further.
The color of the histograms of the Gator indicator changes, so this indicator has not formed a clear signal yet.
As an epilogue to the analysis, the southern direction of price movement is noted to be considered as a priority. At the same time, the indicators contain signals about the possible development of a correction, which should be used to search for entry points at more beneficial prices.
📊 Sell Stop 2618.973
❌ Stop Loss 2631.084
After entering the market, Stop Loss is moved along the red line after closing each candle. The profit is fixed by moving Stop Loss, or when opposite signals appear on the AO, AC, Gator indicators.

Author
Nikolai Krishtopov
Market Analyst & Marketing Manager, Investizo
Nikolai Krishtopov is a Market Analyst at Investizo with more than 15 years of experience in the financial markets industry and over a decade of trading experience. His areas of focus include forex and crypto markets, technical analysis, intraday trading and market behaviour.