
USDJPY H1: The Ichimoku Forecast for the European Session at 26.3.2025
Technical
The most significant signal of the previous trading sessions was the intersection of the Tenkan and Kijun lines, which is considered as a signal of a change in trend in...
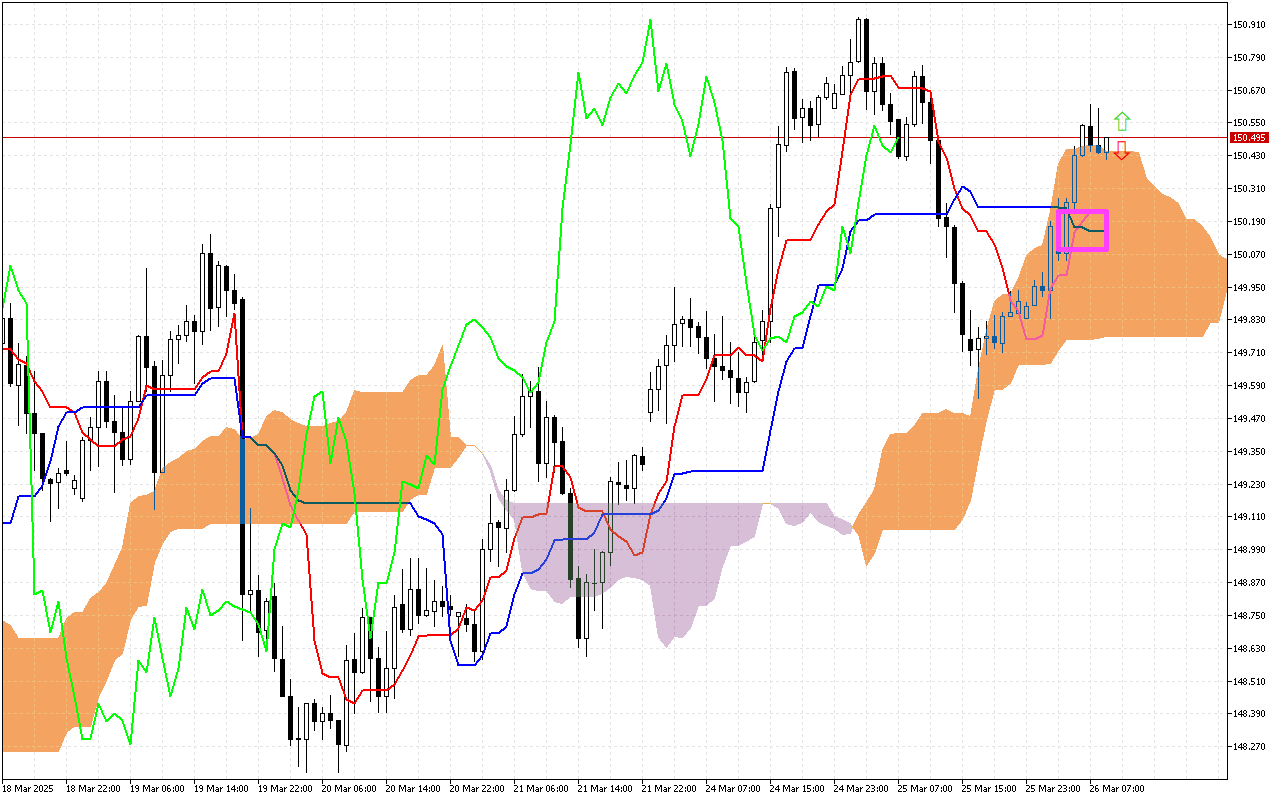
The most significant signal of the previous trading sessions was the intersection of the Tenkan and Kijun lines, which is considered as a signal of a change in trend in the market.
The second important signal is a change in the color of the Kumo cloud, which is marked with a vertical purple line on the graph. The appearance of a lilac color in the cloud indicates a change in the priority direction of movement to downward.
The current situation
Let's carefully look at the current values of the main components of the Ichimoku indicator to assess the current state of the market:
The market price remains above the Tenkan and the Kijun lines, indicating a prevailing positive market sentiment.
Now the Kumo cloud is tinted lilac, which indicates a possible change in price dynamics in a negative direction.
The price is between the SenkouA and SenkouB lines, which act as support and resistance levels. To clarify the market situation, it is worth waiting until the price goes beyond the Kumo cloud.
The Chikou line, which displays the closing price with a lag of 26 periods, is above the current price.
Trading recommendations:
Dynamic support levels are located on the Tenkan line, around the 150.228, the Kijun line, around the 150.153, and the SenkouB line, around the 149.762.
The dynamic resistance level is on the SenkouA line, around the 150.468 mark.
The second important signal is a change in the color of the Kumo cloud, which is marked with a vertical purple line on the graph. The appearance of a lilac color in the cloud indicates a change in the priority direction of movement to downward.
The current situation
Let's carefully look at the current values of the main components of the Ichimoku indicator to assess the current state of the market:
The market price remains above the Tenkan and the Kijun lines, indicating a prevailing positive market sentiment.
Now the Kumo cloud is tinted lilac, which indicates a possible change in price dynamics in a negative direction.
The price is between the SenkouA and SenkouB lines, which act as support and resistance levels. To clarify the market situation, it is worth waiting until the price goes beyond the Kumo cloud.
The Chikou line, which displays the closing price with a lag of 26 periods, is above the current price.
Trading recommendations:
Dynamic support levels are located on the Tenkan line, around the 150.228, the Kijun line, around the 150.153, and the SenkouB line, around the 149.762.
The dynamic resistance level is on the SenkouA line, around the 150.468 mark.

Author
Nikolai Krishtopov
Market Analyst & Marketing Manager, Investizo
Nikolai Krishtopov is a Market Analyst at Investizo with more than 15 years of experience in the financial markets industry and over a decade of trading experience. His areas of focus include forex and crypto markets, technical analysis, intraday trading and market behaviour.