
Natural Gas, Technical Analysis – H1
Natural gas is forming a “double bottom” pattern, which could serve as the foundation for a more significant reversal formation (such as an inverted Head and Shoulders).
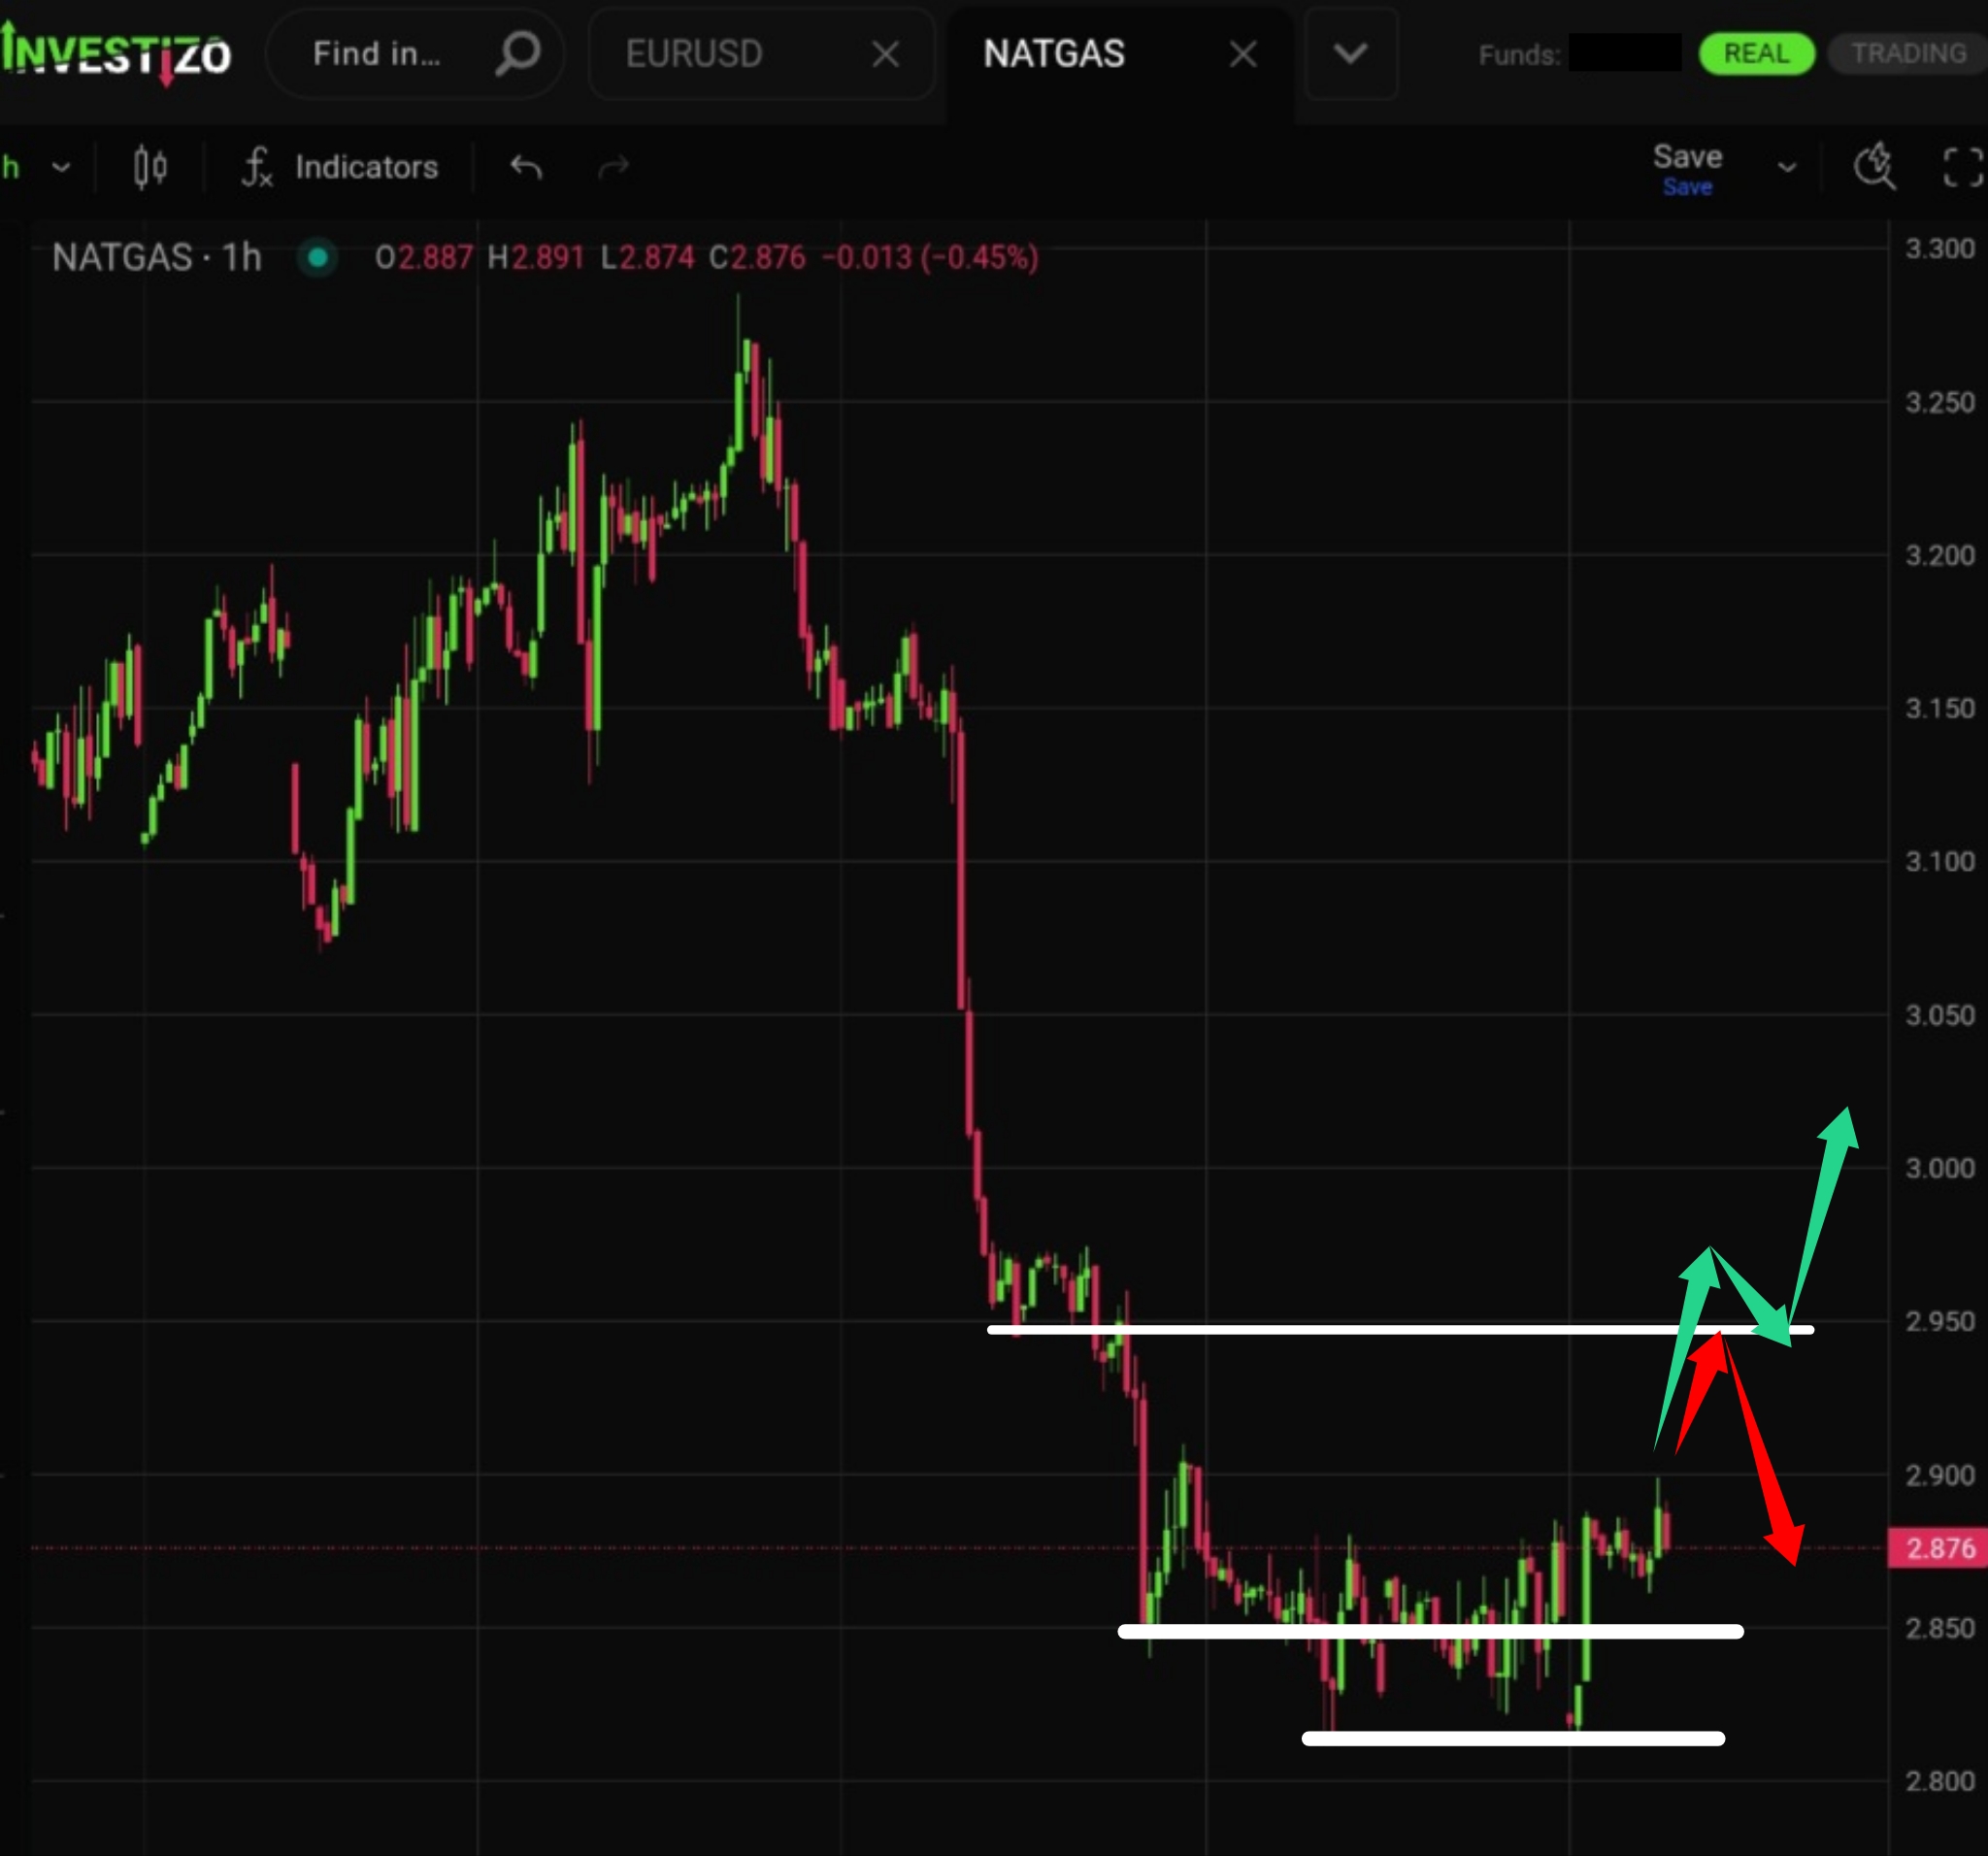
Natural gas is forming a “double bottom” pattern, which could serve as the foundation for a more significant reversal formation (such as an inverted Head and Shoulders). The key resistance level for pattern confirmation is 2.950. A successful break above this level (green scenario on the chart) would validate the reversal pattern and open the way for a full trend reversal. Conversely, if buyers show weakness (red scenario), the prevailing downtrend will remain intact.
Key Levels:
□ 2.950 — key resistance / pattern confirmation level
Primary Scenario:
Upward move toward 2.950.
Alternative Scenario:
Low-volatility sideways consolidation at current levels.
Analyst Commentary:
The market remains highly sensitive to news, statements, and developments related to the Middle East.

Nikolai Krishtopov is a Market Analyst at Investizo with more than 15 years of experience in the financial markets industry and over a decade of trading experience. His areas of focus include forex and crypto markets, technical analysis, intraday trading and market behaviour.