
USDJPY H1: The Chaos Theory Forecast for the American Session on 10.1.2025
10.01.2025 16:16
Technical
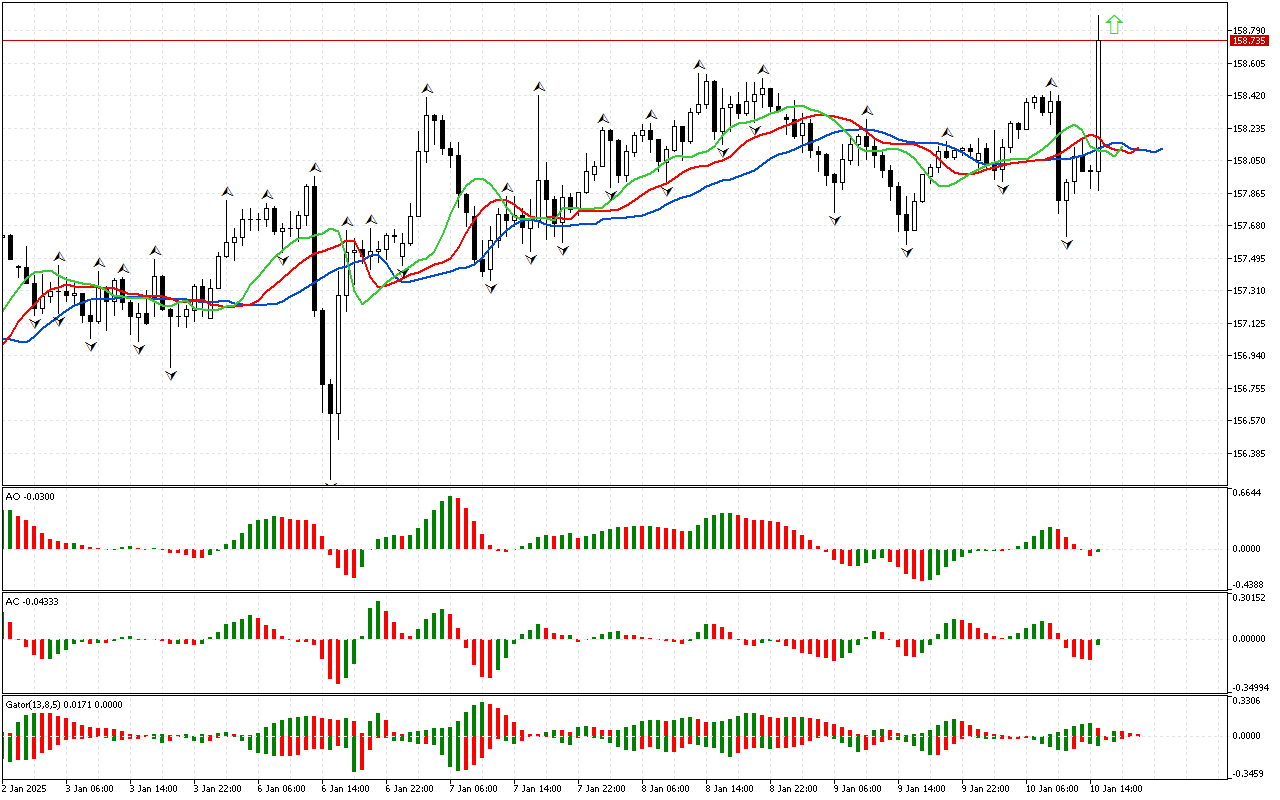
An analysis of the first phase of the market begins the review. The price is noted to have risen above the upper fractal on the chart. It determines the direction of the phase as northern. This signal indicates the possible start of an upward movement.
Despite the fact that the phase space is defined as northern, the trend of the Alligator lines is horizontal. This does not replace the previous signal, but indicates continued uncertainty in the market because the Alligator is sleeping.
At the same time, the AO indicator remains in the negative zone.
The latest bars on the AC and AO charts are colored red. This is a signal that the strength and energy of the upward movement have deceleration. This signal does not contradict the prevalence of the upward movement, but indicates the development of a correction.
The red bars located below the zero mark on the Accelerator Oscillator indicator show a decrease in the energy of the upward movement. However, as long as the price remains above the Alligator’s red line, the price growth is expected.
The color of the histograms of the Gator indicator changes, so this indicator has not formed a clear signal yet.
Several red columns have been formed on the Gator indicator. This is a signal that may indicate the development of a corrective movement in the near future.
To summarize, the indicator signals predominantly prove the upward vector of price movement. But there are also signals that a corrective pullback for this instrument may be observed in the near future. This opportunity should be used to search for entry points into the market at better prices.
📊 Buy Stop 158.875
❌ Stop Loss 158.077
After entering the market, Stop Loss is carried along the red line after the closing of each candle. The profit is fixed by moving Stop Loss, or when opposite signals appear on the AO, AC, Gator indicators.
Despite the fact that the phase space is defined as northern, the trend of the Alligator lines is horizontal. This does not replace the previous signal, but indicates continued uncertainty in the market because the Alligator is sleeping.
At the same time, the AO indicator remains in the negative zone.
The latest bars on the AC and AO charts are colored red. This is a signal that the strength and energy of the upward movement have deceleration. This signal does not contradict the prevalence of the upward movement, but indicates the development of a correction.
The red bars located below the zero mark on the Accelerator Oscillator indicator show a decrease in the energy of the upward movement. However, as long as the price remains above the Alligator’s red line, the price growth is expected.
The color of the histograms of the Gator indicator changes, so this indicator has not formed a clear signal yet.
Several red columns have been formed on the Gator indicator. This is a signal that may indicate the development of a corrective movement in the near future.
To summarize, the indicator signals predominantly prove the upward vector of price movement. But there are also signals that a corrective pullback for this instrument may be observed in the near future. This opportunity should be used to search for entry points into the market at better prices.
📊 Buy Stop 158.875
❌ Stop Loss 158.077
After entering the market, Stop Loss is carried along the red line after the closing of each candle. The profit is fixed by moving Stop Loss, or when opposite signals appear on the AO, AC, Gator indicators.