
General analysis USDCAD for 13.06.2022

The USD/CAD pair rose at the beginning of todays trading session. The pair continued to maintain its gains for the fourth consecutive session.
Current Dynamics.
The USD/CAD pair rose at the beginning of todays trading session. The pair continued to maintain its gains for the fourth consecutive session.
Some may refer the main reason for the rise of the US dollar to the recent macroeconomic data, which showed the great inflationary pressures facing the US economy, which increased expectations that the Federal Reserve will accelerate the pace in raising interest rates at a faster pace in the upcoming meetings to hold down inflation.
The data of the US Census Bureau showed that the consumer price inflation index in the country rose on a monthly basis by 1% during last May, exceeding expectations for an increase of 0.7%, and the index rose by its basic value when excluding energy and food prices by 0.6% last month, exceeding expectations for a 0.5% increase.
On an annual basis, the US consumer price index rose 8.6% on an annual basis in May, the highest level since 1981, and exceeded expectations for a rise of 8.3%.
Commenting on the latest economic data, former US Treasury Secretary Lawrence Summers said that the Federal Reserve had failed to correct its mistakes on inflation, which damaged its credibility, after the recent inflation data ended hopes for a peak. Summers warned of the Federal Reserve’s delay in raising the interest rate to control inflation, noting that discussions should be about raising interest rates between 50 to 75 basis points in the coming period. Besides that, US President Joe Biden said, “We will live with this inflation for a while, it will gradually decrease, but we will live with it for a while.”
Besides the statements, the numbers confirm that US inflation has not reached its peak yet, and that the Federal Reserve, which has committed to raise interest rates at each of its next two meetings, starting next week, will have to maintain this hawkish attitude during its September meeting.
In view of the most important events that may affect the performance of the pair, the US macroeconomic data will be present and strongly through the Producer price index for the month of May, along with the most important event which is the interest rate decision by the Federal Reserve.
Support and resistance levels.
On the 4-hour chart, the instrument is trading on the upper side of the Bollinger Bands. As the price range expands, indicating that the instrument is in an uptrend. The momentum chart is above the 100 level, which gives sell signals. The Envelopes indicator gives clear buy signals.
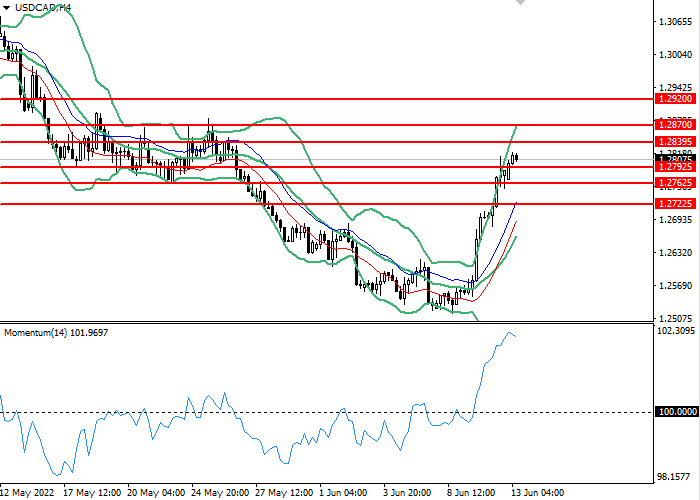
- Support levels: 1.27925, 1.27625, 1.27225.
- Resistance levels: 1.28395, 1.28700, 1.29200.
Trading scenarios
- Long positions should be opened at the 1.27925 with a target of 1.28395 and a stop loss at 1.27625. Implementation period: 1-2 days.
- Short positions can be opened at the level of 1.27625 with a target of 1.27225 and a stop-loss at the level of 1.27925. Implementation period: 1-2 days.
Nikolai Krishtopov is a Market Analyst at Investizo with more than 15 years of experience in the financial markets industry and over a decade of trading experience. His areas of focus include forex and crypto markets, technical analysis, intraday trading and market behaviour.
Award history
More about awards
2023—2025 - 8 awards archived