
Technical analysis USDJPY for 13.03.2023
The Tenkan-sen line is located below the Kijun-sen line. Both lines are directed downward. Confirmatory line Chikou Span is below the price chart
The Tenkan-sen line is located below the Kijun-sen line. Both lines are directed downward. Confirmatory line Chikou Span is below the price chart. In this case, the cloud is descending. Instrument is trading below the Tenkan-se and Kijun-sen lines. The closest resistance is the level 135.280. The closest support is the level 134.030
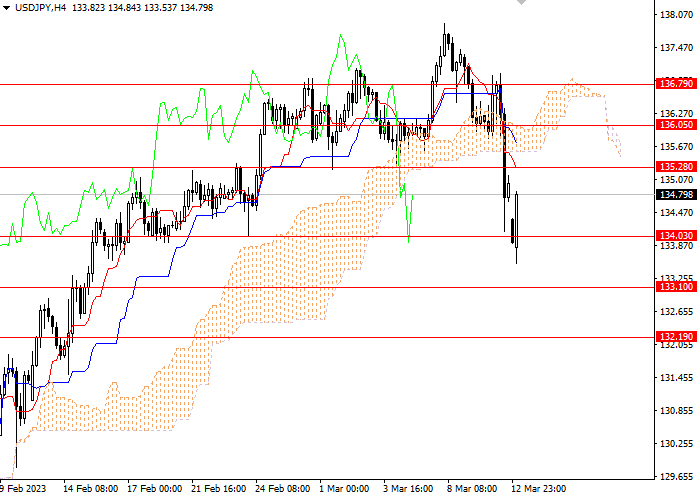
Key levels
- 136.790, 136.050, 135.280, 134.030, 133.100, 132.190
Trading scenario
- Recommended opening long positions (Buy Stop) from the level of 135.280, with Take Profit of 136.050 and Stop Loss of 134.550
Alternative scenario
- Recommended opening short positions (Sell Stop) from the level of 134.030, with Take Profit of 133.100 and Stop Loss of 134.550

Nikolai Krishtopov is a Market Analyst at Investizo with more than 15 years of experience in the financial markets industry and over a decade of trading experience. His areas of focus include forex and crypto markets, technical analysis, intraday trading and market behaviour.