
Technical analysis USDJPY for 31.10.2024
Intraday
Technical
The Tenkan-sen line is located above the Kijun-sen line. Both lines are horizontal. Confirmatory line Chikou Span is above the price chart
The Tenkan-sen line is located above the Kijun-sen line. Both lines are horizontal. Confirmatory line Chikou Span is above the price chart. In this case, the cloud is ascending. Instrument is traded between Tenkan-se and Kijun-sen lines. The closest support is the level 152.850. The closest resistance is the level 153.900
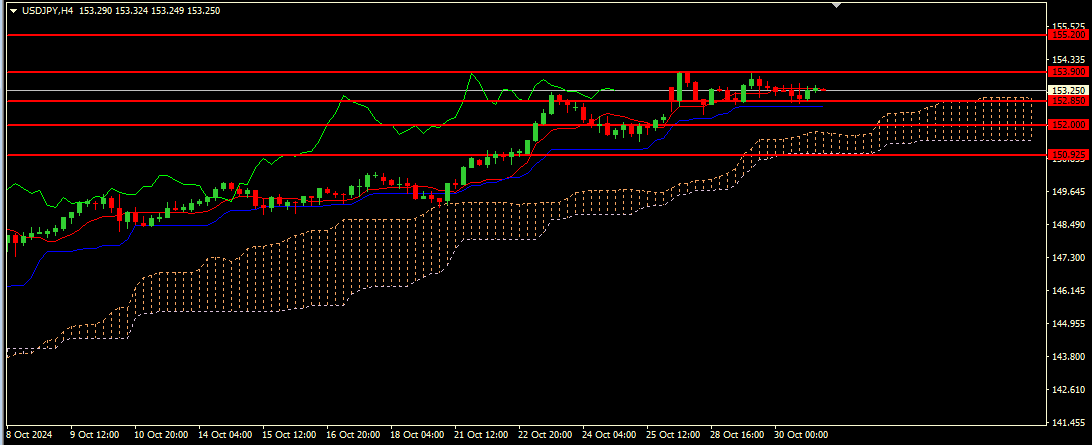
Key levels
- 155.200, 153.900, 152.850, 152.000, 150.925
Trading scenario
- Recommended opening long positions (Buy Limit) from the level of 152.850, with Take Profit of 153.900 and Stop Loss of 152.000
Alternative scenario
- Recommended opening short positions (Sell Stop) from the level of 152.000, with Take Profit of 150.925 and Stop Loss of 152.850
Scenario
Recommendation
BUY LIMIT
Entry Point
152.850
Take Profit
153.900
Stop Loss
152.000
Key Levels
155.200, 153.900, 152.850, 152.000, 150.925
Alternative scenario
Recommendation
SELL STOP
Entry Point
152.000
Take Profit
150.925
Stop Loss
152.850

Author
Nikolai Krishtopov
Market Analyst & Marketing Manager, Investizo
Nikolai Krishtopov is a Market Analyst at Investizo with more than 15 years of experience in the financial markets industry and over a decade of trading experience. His areas of focus include forex and crypto markets, technical analysis, intraday trading and market behaviour.