
Gold Price Forecast for Today, Tomorrow, Next Week, and 30-Day Forecast

Gold price forecast and analysis for today, tomorrow, next week and the next 30 days, including key technical levels and market drivers.
Gold is one of the most actively traded financial instruments because of its high liquidity and sensitivity to interest rates, the US dollar, inflation, and global risk. XAU/USD analysis helps traders assess the current market direction, key support and resistance levels, and potential price scenarios.
Key Takeaways
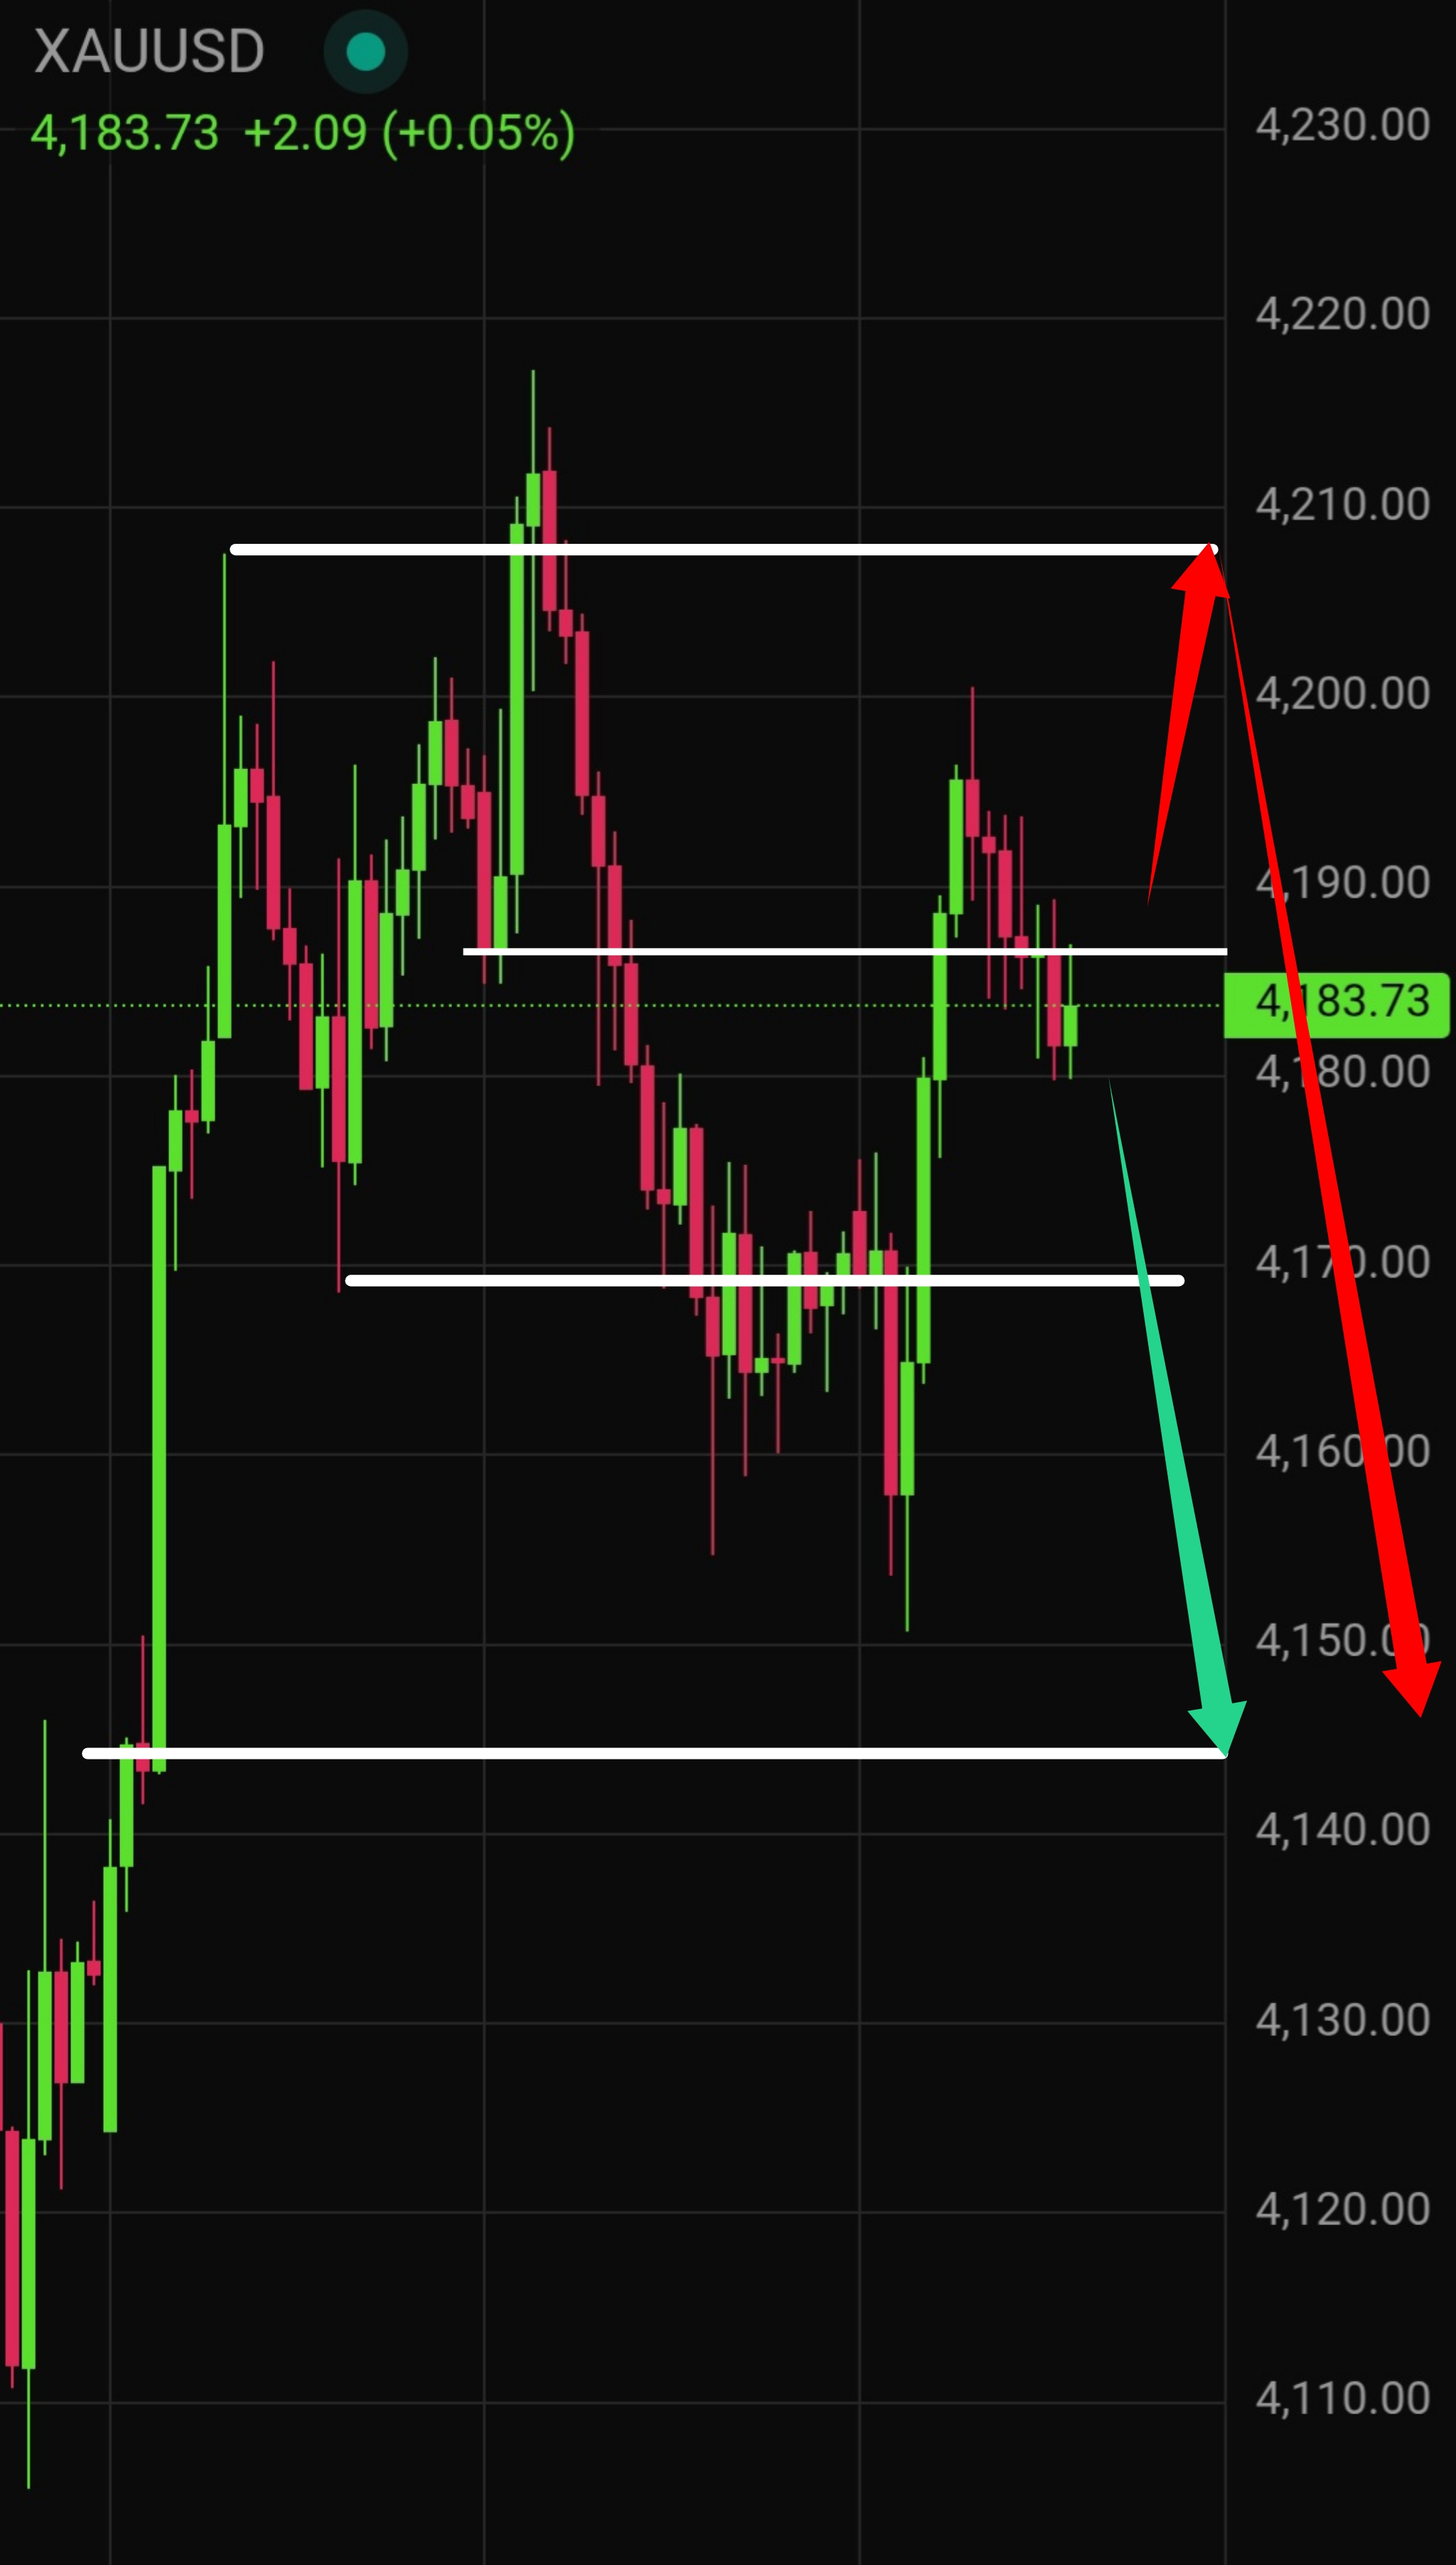
Intraday: Sell setups are preferred on a move toward the $4,210 zone with stops above $4,230. Buy opportunities appear near $4,150–$4,140 support with tight risk control.
The base scenario: A decline toward $4,170 and then $4,140.
The alternative scenario: A swing higher to $4,210 followed by a sharp reversal lower.
This week: Volatility centers on U.S. inflation data; stronger numbers favor the dollar and pressure gold, while softer prints support a rebound.
30-day outlook: Gold is expected to consolidate mainly between $4,100 and $4,240, with the Fed decision at the end of October acting as the primary directional catalyst.
Latest Gold (XAU/USD) Technical Analysis for Today
Gold price today is showing a local Over & Under reversal pattern on the H1 chart, opening the door for a move toward $4,140. The technical entry zone for this setup sits near the prior high around $4,210, so a brief swing higher cannot be ruled out first.
RSI: 54,55
MACD: Bearish
MA: 4,188
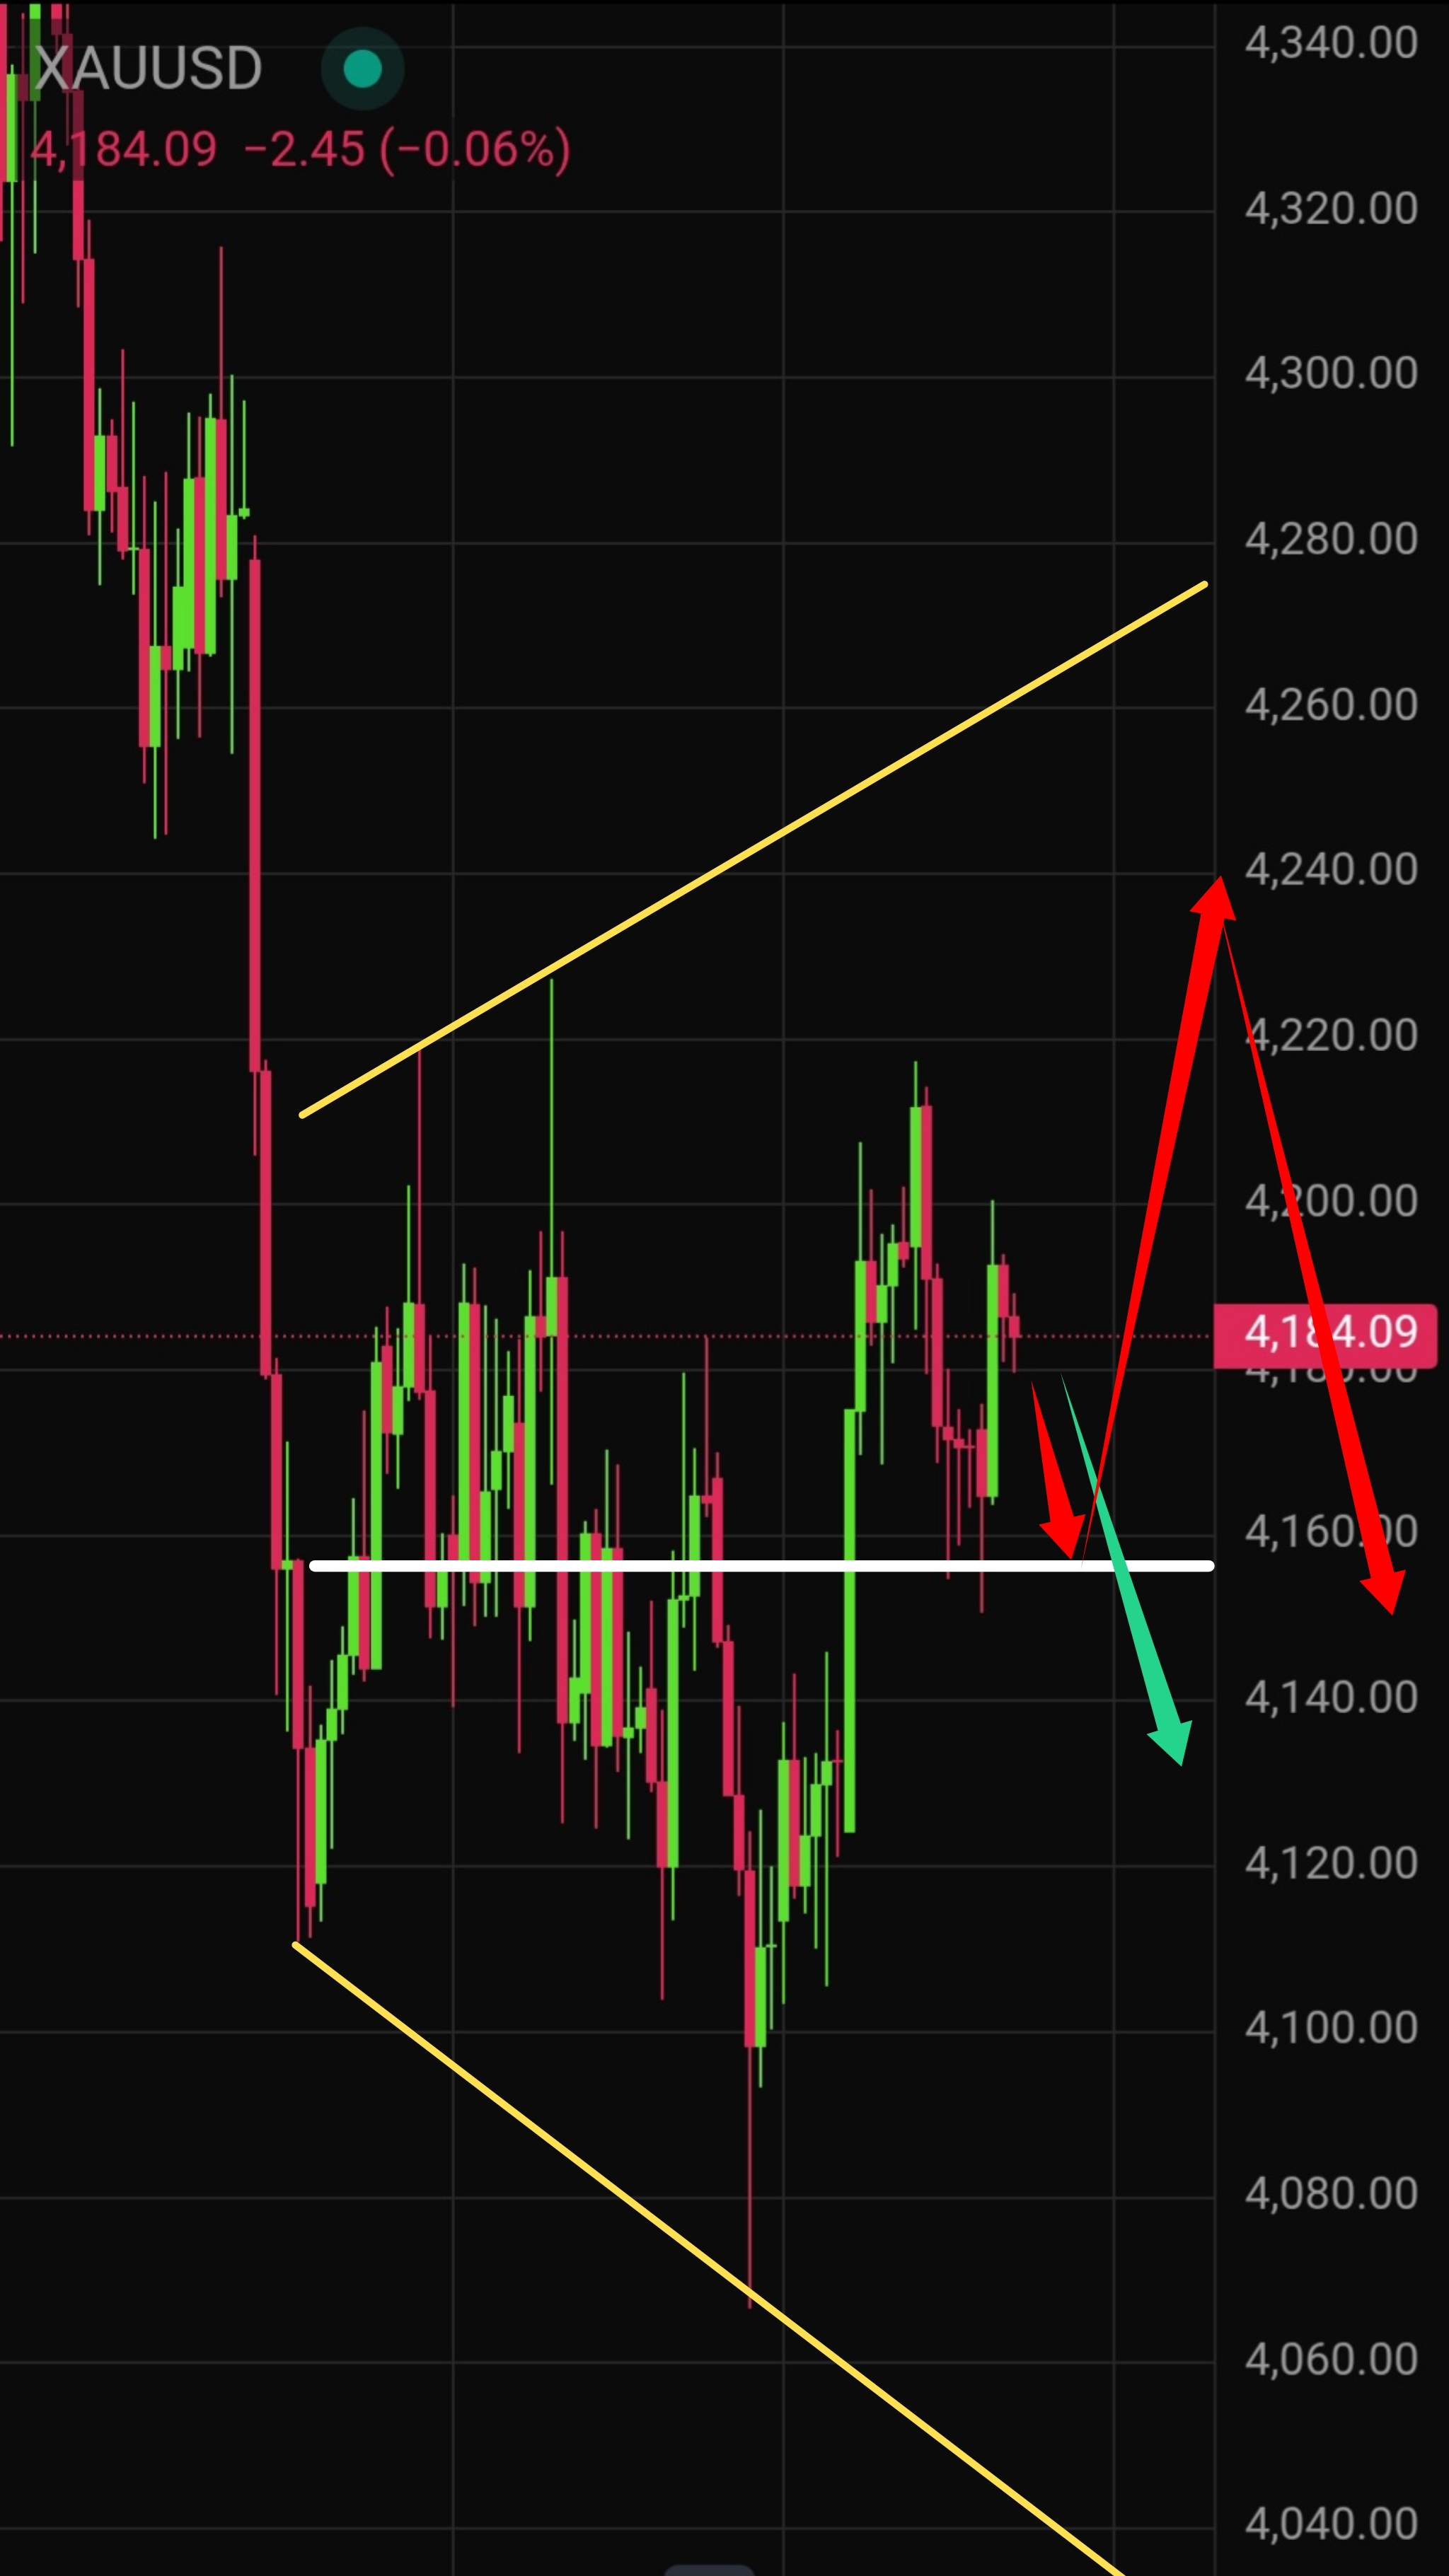
On the H4 timeframe, price continues to consolidate inside an expanding megaphone formation with mixed triggers, calling for caution. Overall gold technical analysis today points to a two-sided but slightly softer near-term bias.
RSI: 55,83
MACD: Bearish
MA: 4,178
Key gold support and resistance levels:
- Supports: 4,140, 4,180
- Resistances: 4,220
Gold (XAU/USD) Trading Plan for Today
The base scenario is a decline toward $4,170–$4,140.
The alternative is a push up to $4,210 before a sharp reversal lower. Stops for short positions sit above $4,230.
Gold (XAU/USD) Live Price Today
XAUUSD live price action reflected heightened safe-haven demand after Houthi attacks on Saudi Arabia, yet the dollar strengthened on geopolitical uncertainty and U.S. inflation expectations.
Cleveland Fed President Beth Hammack advocated relatively rapid policy tightening to contain broad inflationary pressures, adding rate-hike risk and weighing on gold.
Christopher Waller’s speech later today remains a key watch point.
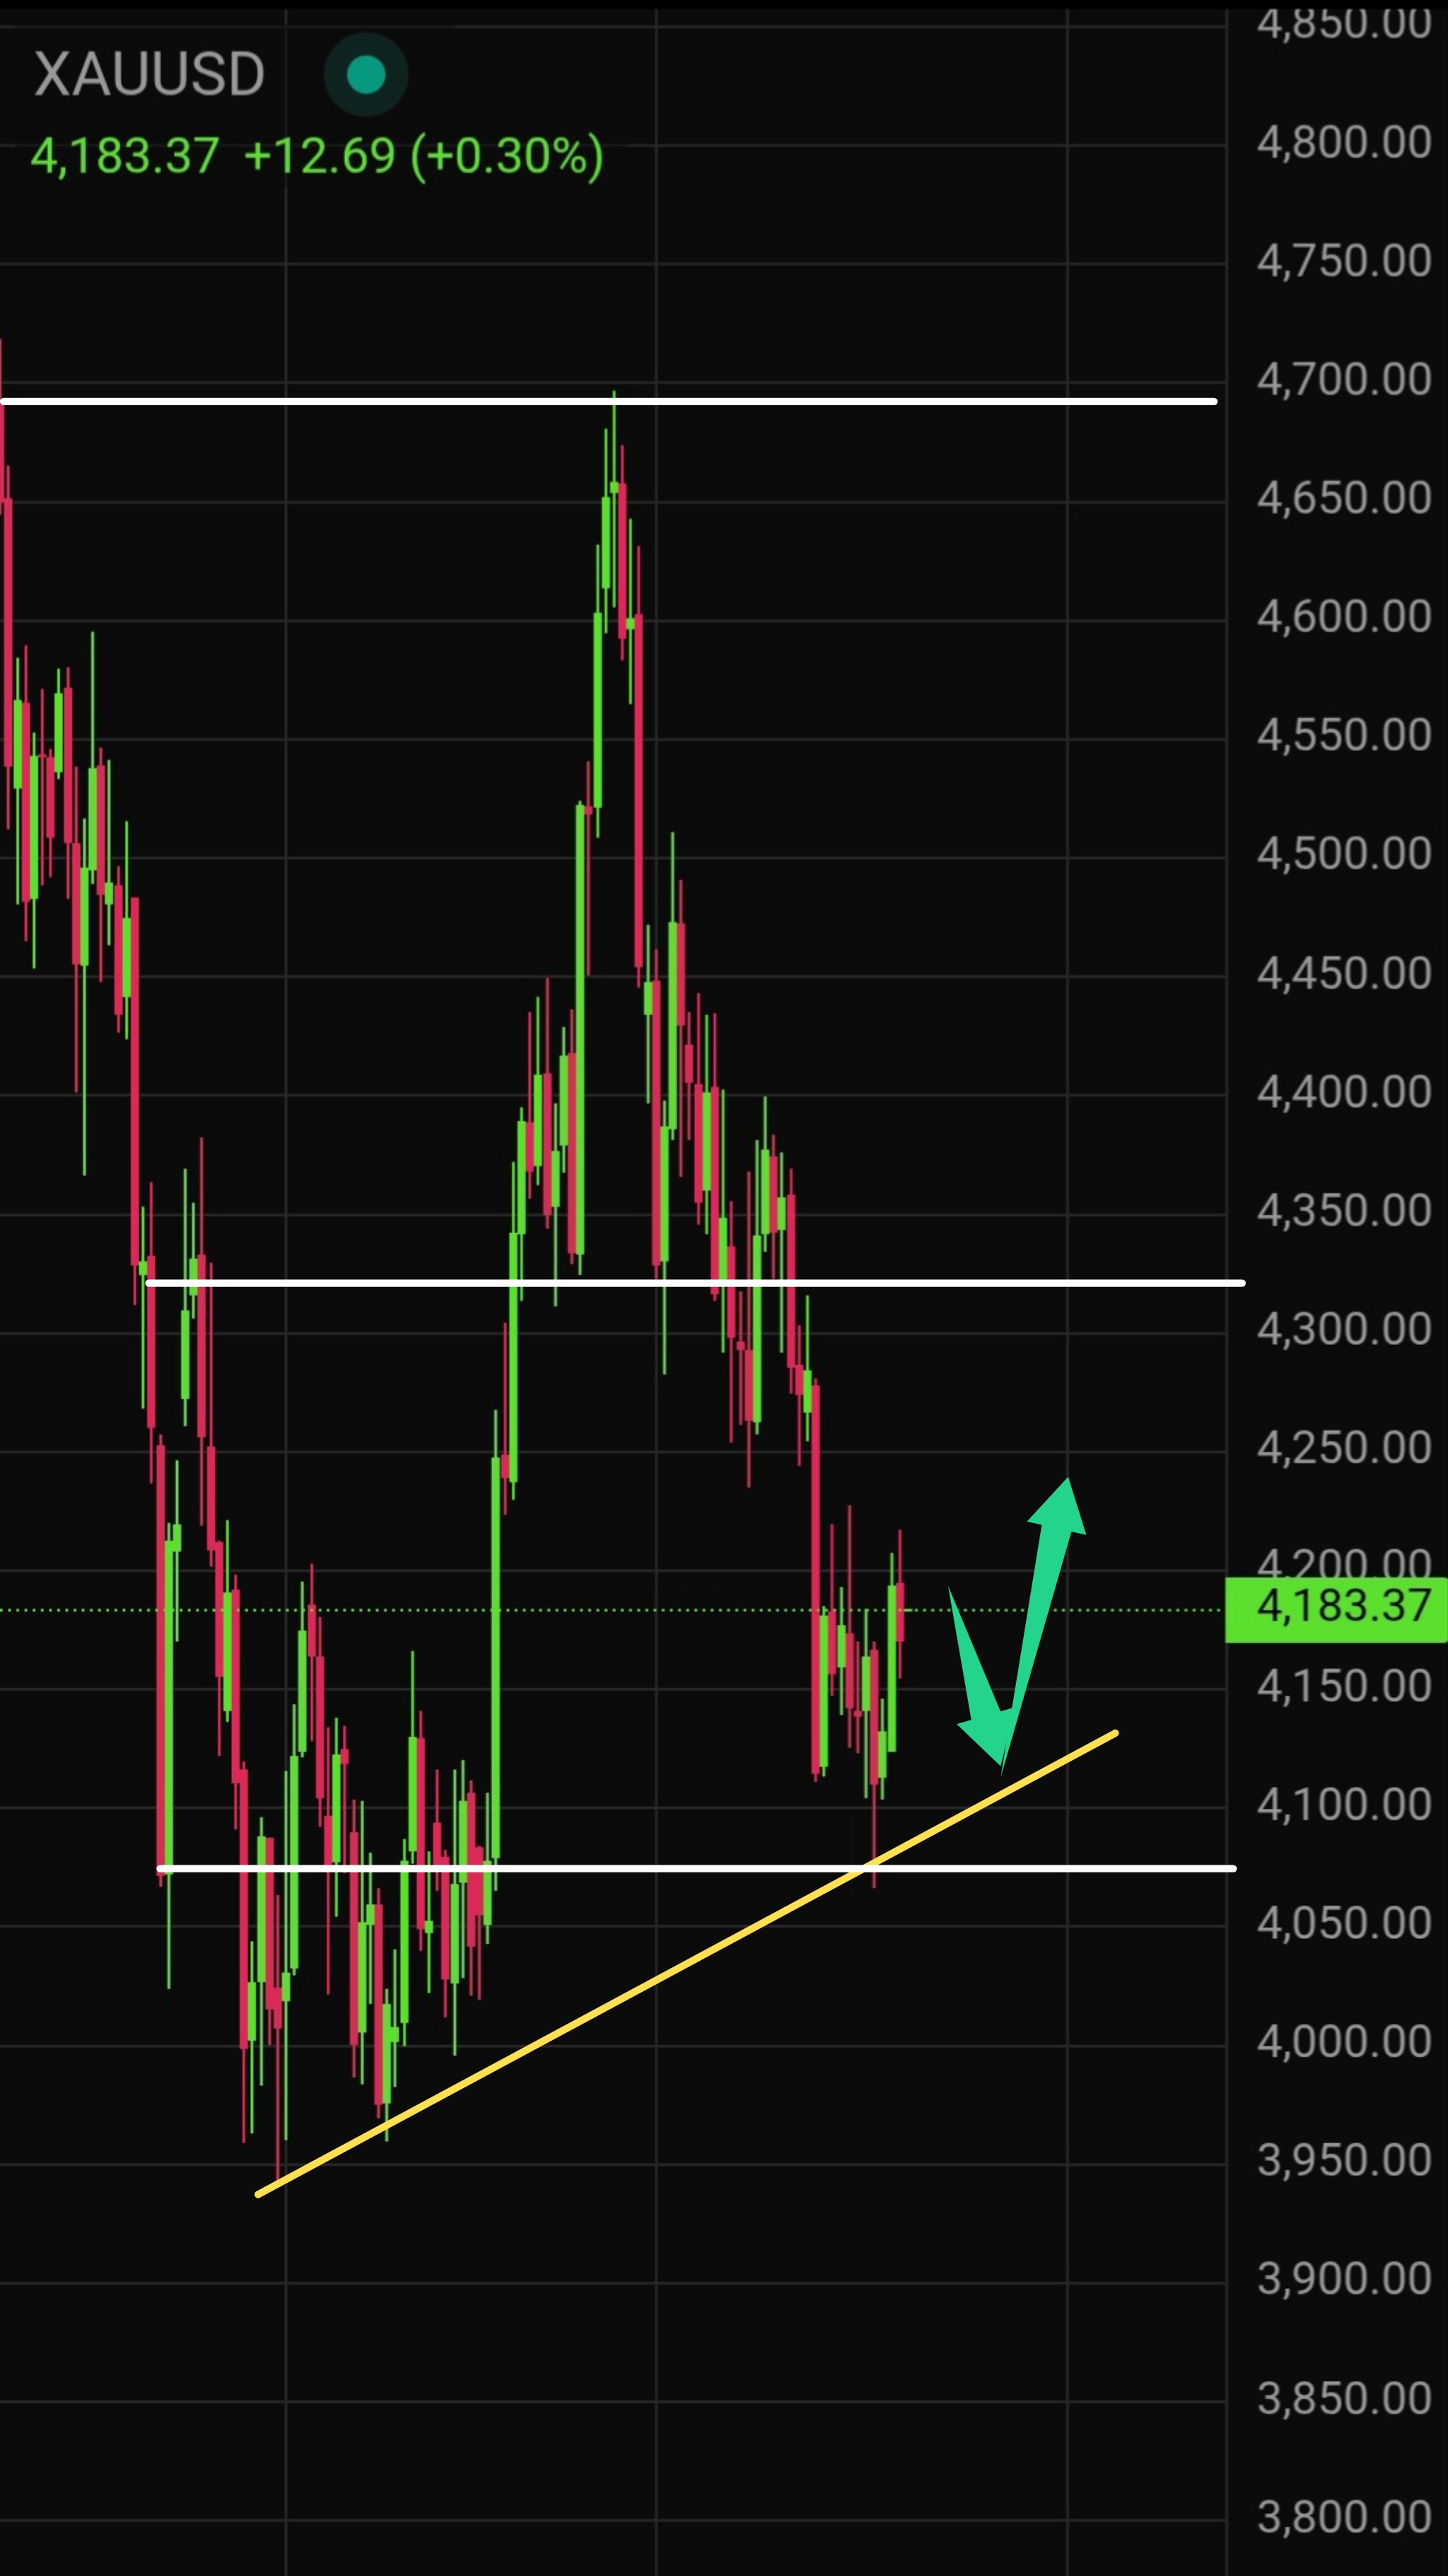
Strong demand still exists in the $4,100–$4,150 zone, supporting bounces on approaches.

Gold (XAU/USD) Price Forecast for Tomorrow
Tomorrow’s main event is U.S. CPI at 12:30 UTC. Hotter core inflation would reinforce Fed hawkishness and pressure gold; softer data could support a rebound. If today’s decline into the $4,140 area is completed cleanly, the bias leans higher.
Will gold go up tomorrow? Yes — provided the pullback toward $4,140 finishes and buyers reappear in that zone.
| Date | October 13, 2026 |
| Minimum | $4,151 |
| Average | $4,197 |
| Maximum |
$4,201 |
Gold (XAU/USD) Price Forecast for This Week
The gold weekly outlook is dominated by U.S. inflation releases: CPI on 14 October at 13:30 UTC, followed by PPI and retail sales on 15 October at 13:30 UTC. Additional Fed speakers may appear on the calendar.
Strong inflation and consumer data tend to lift the dollar and yields, pressuring gold; weaker numbers can produce the opposite effect.
Gold price this week is likely to remain volatile inside a $4,100–$4,240 range.
| Date range | October 12–October 16, 2026 |
| Minimum | $4,151 |
| Average | $4,185 |
| Maximum | $4,218 |
Gold (XAU/USD) Price Forecast for the Next 30 Days
Major calendar items are:
- U.S. CPI (14 Oct)
- PPI and Retail Sales (15 Oct)
- Import/Export Price Indexes (16 Oct),
- the Fed meeting (27–28 Oct)
- Q3 GDP plus Personal Income/Outlays and PCE (29 Oct),
- Employment Cost Index (30 Oct).
The gold price outlook next month stays bidirectional. Elevated energy prices and geopolitical uncertainty provide a floor for gold as a safe-haven asset, yet a still-hawkish Fed and firm CPI/PPI readings would lift yields and the dollar, capping the XAU/USD 30-day forecast.
The critical sequence runs from CPI on 14 October through the Fed decision at the end of the month — the window most likely to set a new XAU/USD price target.
| Date | Event | Potential impact |
| October 7 | FOMC Minutes | High |
|
October, 14 |
U.S. CPI | High |
| October 15 | PPI and Retail Sales | High |
| October 16 | Import/Export Price Indexes | High |
| October 27-28 | the Fed meeting | High |
30-Day Scenarios
Base case remains consolidation between $4,150 and $4,200.
A bullish scenario targets $4,240.
A bearish scenario would open a decline toward $4,100.
Gold Price Analysis and Forecasting Methodology
Our gold forecast methodology combines technical analysis, fundamental analysis and market sentiment. Technical analysis evaluates price action, trends, support and resistance, RSI, MACD and other indicators across multiple timeframes. Fundamental analysis considers interest rates, inflation, the US dollar, Treasury yields and major economic events. Sentiment analysis helps identify changes in investor positioning and risk appetite. The final forecast represents a scenario-based assessment of potential market movements and is not a guarantee of future prices.
Is Gold a Good Investment?
Is gold a good investment? Gold can play an important role in a diversified portfolio because it may provide diversification and help hedge against certain market and economic risks. Investors should consider their investment horizon, risk tolerance and current market conditions before making an investment decision.
You can start trading gold and other financial instruments with Investizo.
Summary
Gold is consolidating inside a widening range after forming a local H1 reversal pattern. Near-term direction hinges on whether $4,140 support holds and how U.S. inflation data reshape Fed expectations. The late-October FOMC meeting remains the decisive event for the coming month.
Gold (XAU/USD) Price Forecast FAQs
What is the current price of XAU/USD now?
October 13, 2026
$
Will Gold Go Up Tomorrow?
A rebound remains possible if buyers continue to defend the $4,180 support. A clean hold of this level or a successful test of the $4,140–$4,150 zone would open the door for a move back toward $4,200.
Will Gold Rise or Fall Next Week?
The weekly bias is neutral-to-slightly constructive inside the $4,120–$4,240 range. Direction will largely depend on the U.S. CPI and PPI releases; softer inflation data would favor higher prices, while stronger readings could pressure gold lower.
What Could Trigger a Short-Term Drop in Gold (XAU/USD)?
A decisive break below $4,180, combined with a stronger-than-expected CPI print or a sharp rise in Treasury yields, would likely trigger a short-term decline toward the $4,140–$4,100 area.
How Do We Do Gold Technical Analysis?
We analyze price action, trends, support and resistance levels, moving averages, RSI and MACD across H1, H4 and higher timeframes. Major events that can affect XAU/USD volatility are also considered.
How to Trade Gold Technical Analysis?
Technical analysis can help identify potential entry points, targets and stop-loss levels. A trading setup should be based on confirmation of the market scenario and predefined risk rather than a single indicator.
Nikolai Krishtopov is a Market Analyst at Investizo with more than 15 years of experience in the financial markets industry and over a decade of trading experience. His areas of focus include forex and crypto markets, technical analysis, intraday trading and market behaviour.
Award history
More about awards
2023—2025 - 8 awards archived