
Bitcoin Price Forecast for Today, Tomorrow, Next Week and 30-Day Forecast

Bitcoin is the reference crypto asset, and its dollar price tracks Fed policy, real yields and risk appetite. This page sets out our bias, key levels and volatility ranges for BTC/USD.
Bitcoin is the reference crypto asset, and its dollar price tracks Fed policy, real yields and risk appetite. This page sets out our bias, key levels and volatility ranges for BTC/USD.
Key Takeaways
- As of 4 Nov 2026, 05:00 UTC, BTC/USD trades at $77,559 with a bearish bias.
- Base case (1–3 days): sell at market near $77,559, target $76,390; a move above $77,903 invalidates it.
- Alternative: sell a rebound into $77,693, same target $76,390, invalid above $78,405.
- For 5 Nov our volatility range is $75,215–79,672; the week of 4–8 Nov spans $72,578–81,827.
- The 30-day volatility range to 3 Dec is $61,015–88,980, and the path of least resistance points lower.
Bitcoin (BTC/USD) Live Price Today
Live price: $77,896.14
As of 4 Nov 2026, 05:00 UTC, Bitcoin trades at $77,559, 0.49% below the previous close. The Fed kept the funds-rate range at 3.75–4.00% (Federal Reserve, 28 Oct), and the 10-year yield was 4.91% (Federal Reserve, 3 Nov). PCE prices rose 3.6% from a year earlier and real GDP grew 3.4% (BEA, 29 Oct). ISM manufacturing printed 55.5 (ISM, 2 Nov), and job openings reached 7.52M (BLS, 3 Nov).

The daily chart is bearish, with price under EMA20 at $79,695 and EMA50 at $80,048. RSI (14) is at 39.4, MACD is below its signal line, and Wednesday's range so far is $75,733–78,027.
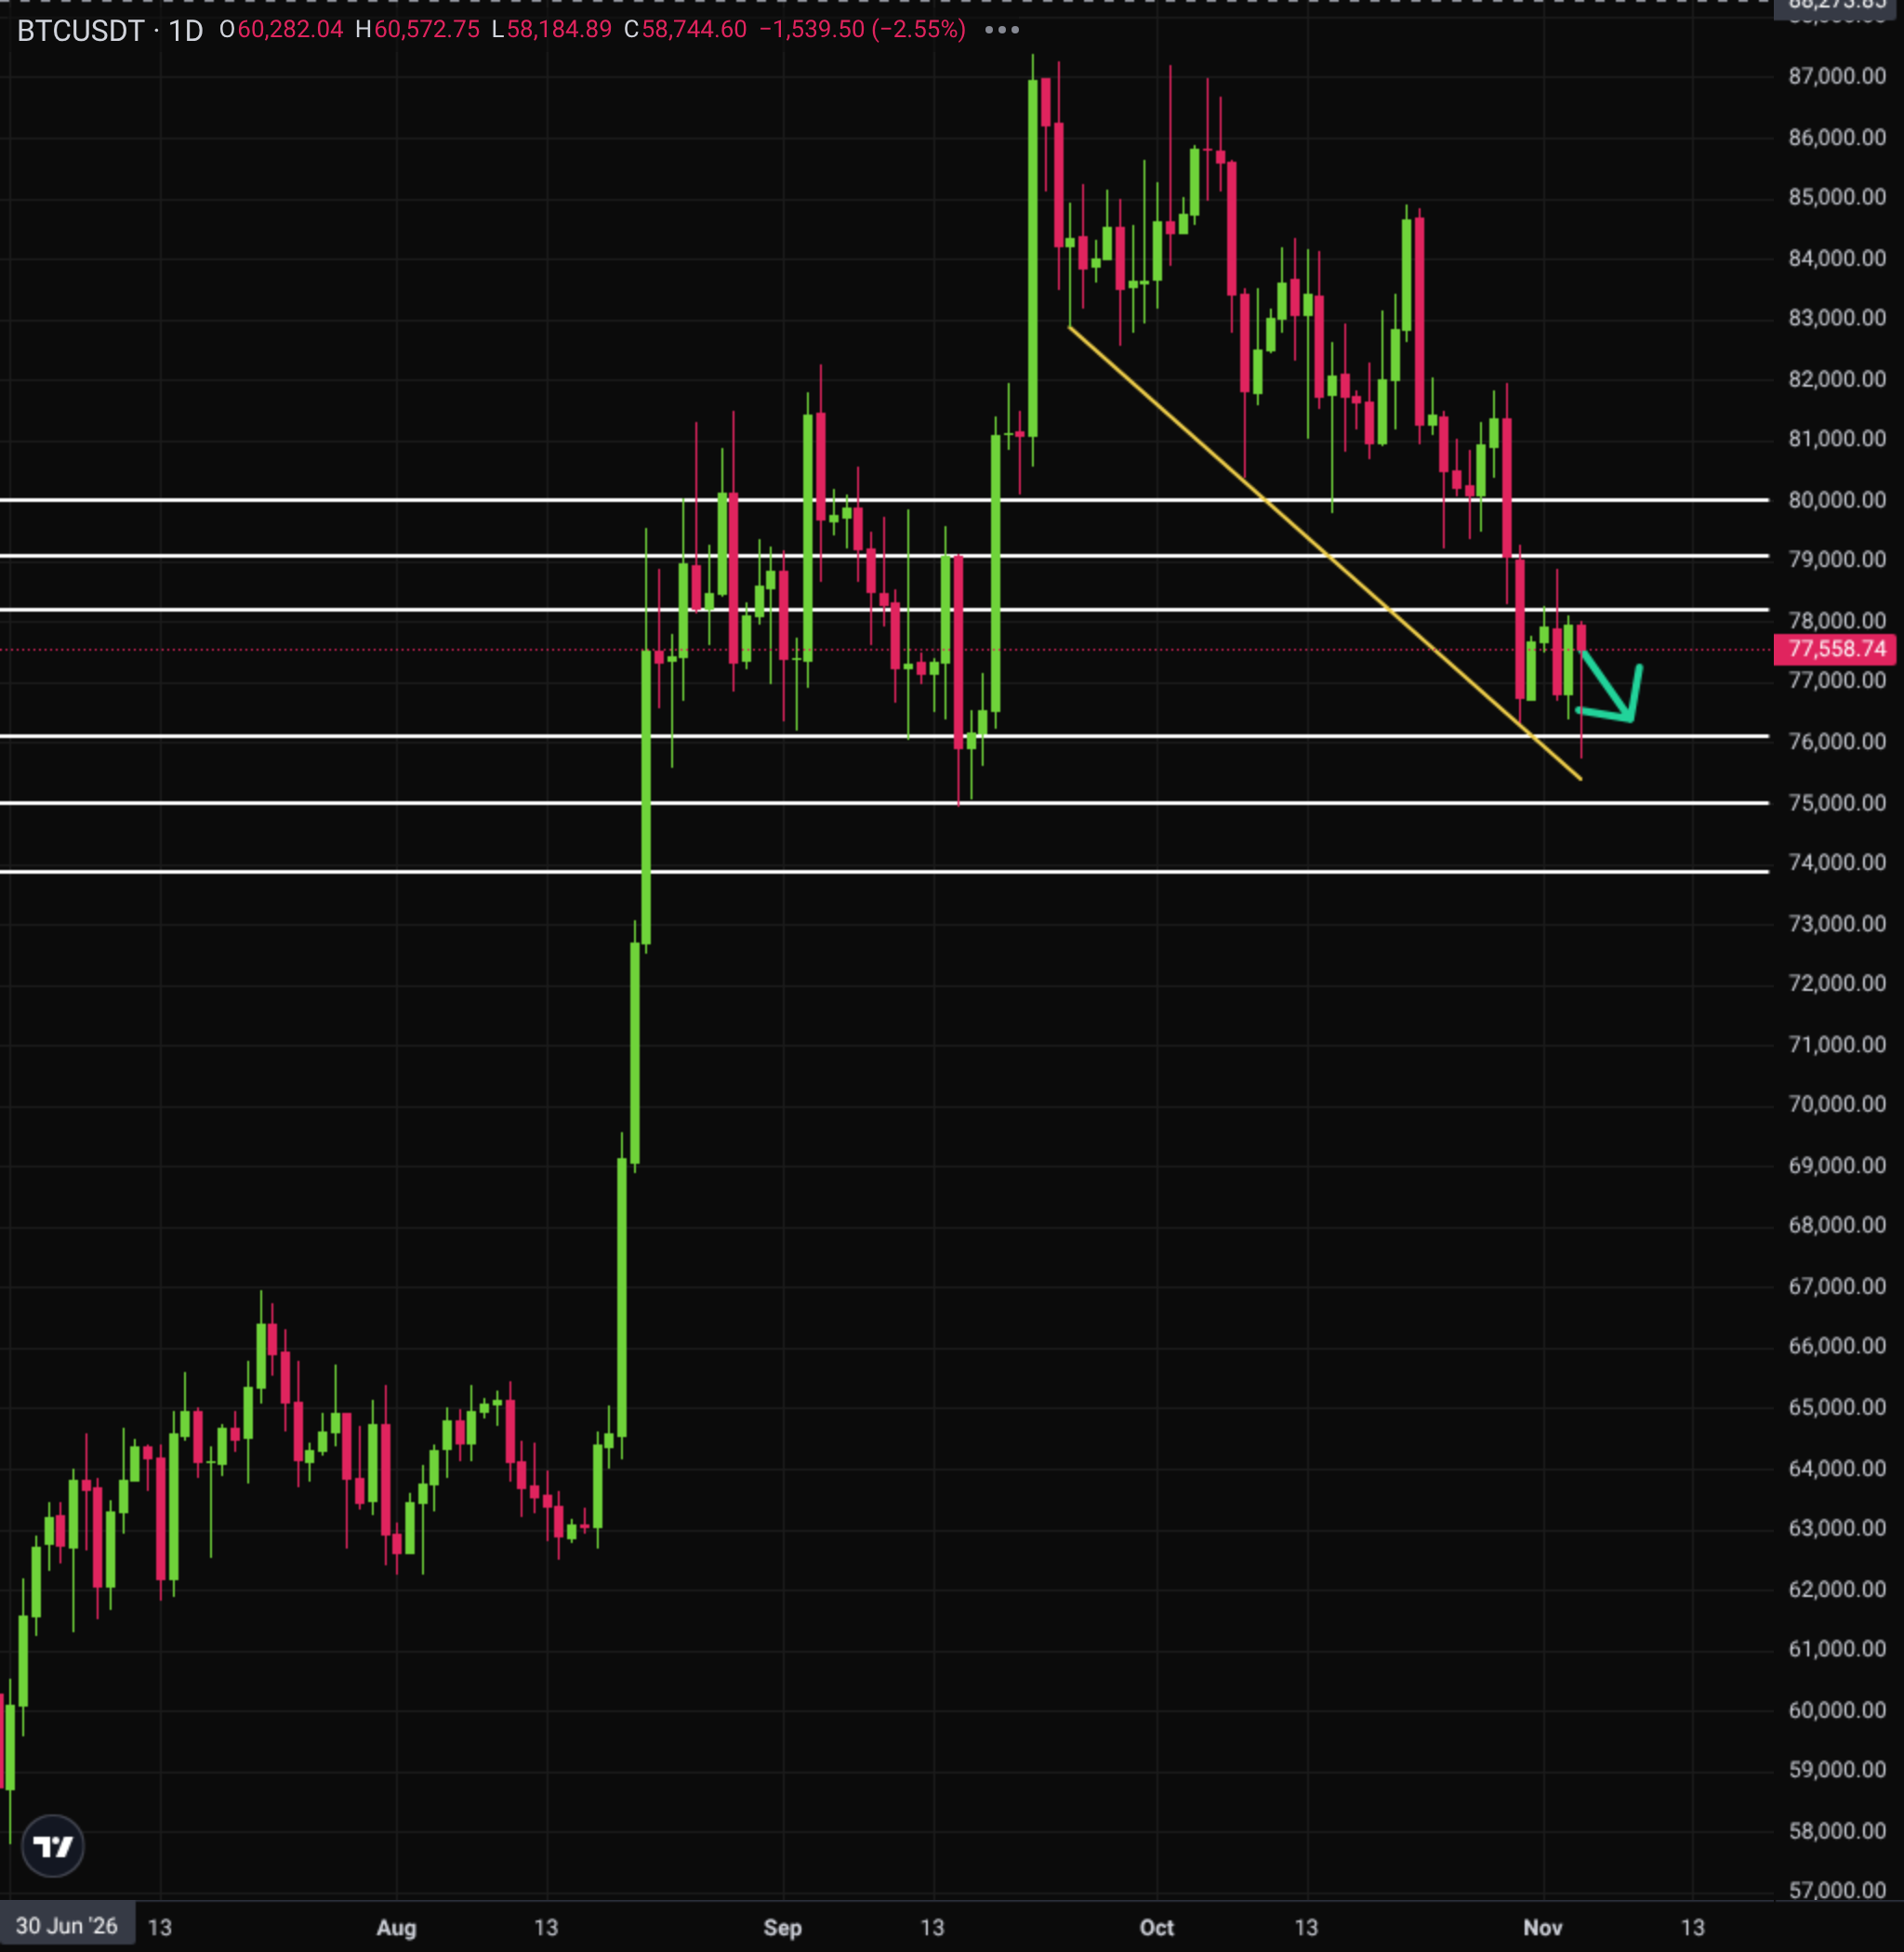
Latest Bitcoin (BTC/USD) Technical Analysis for Today
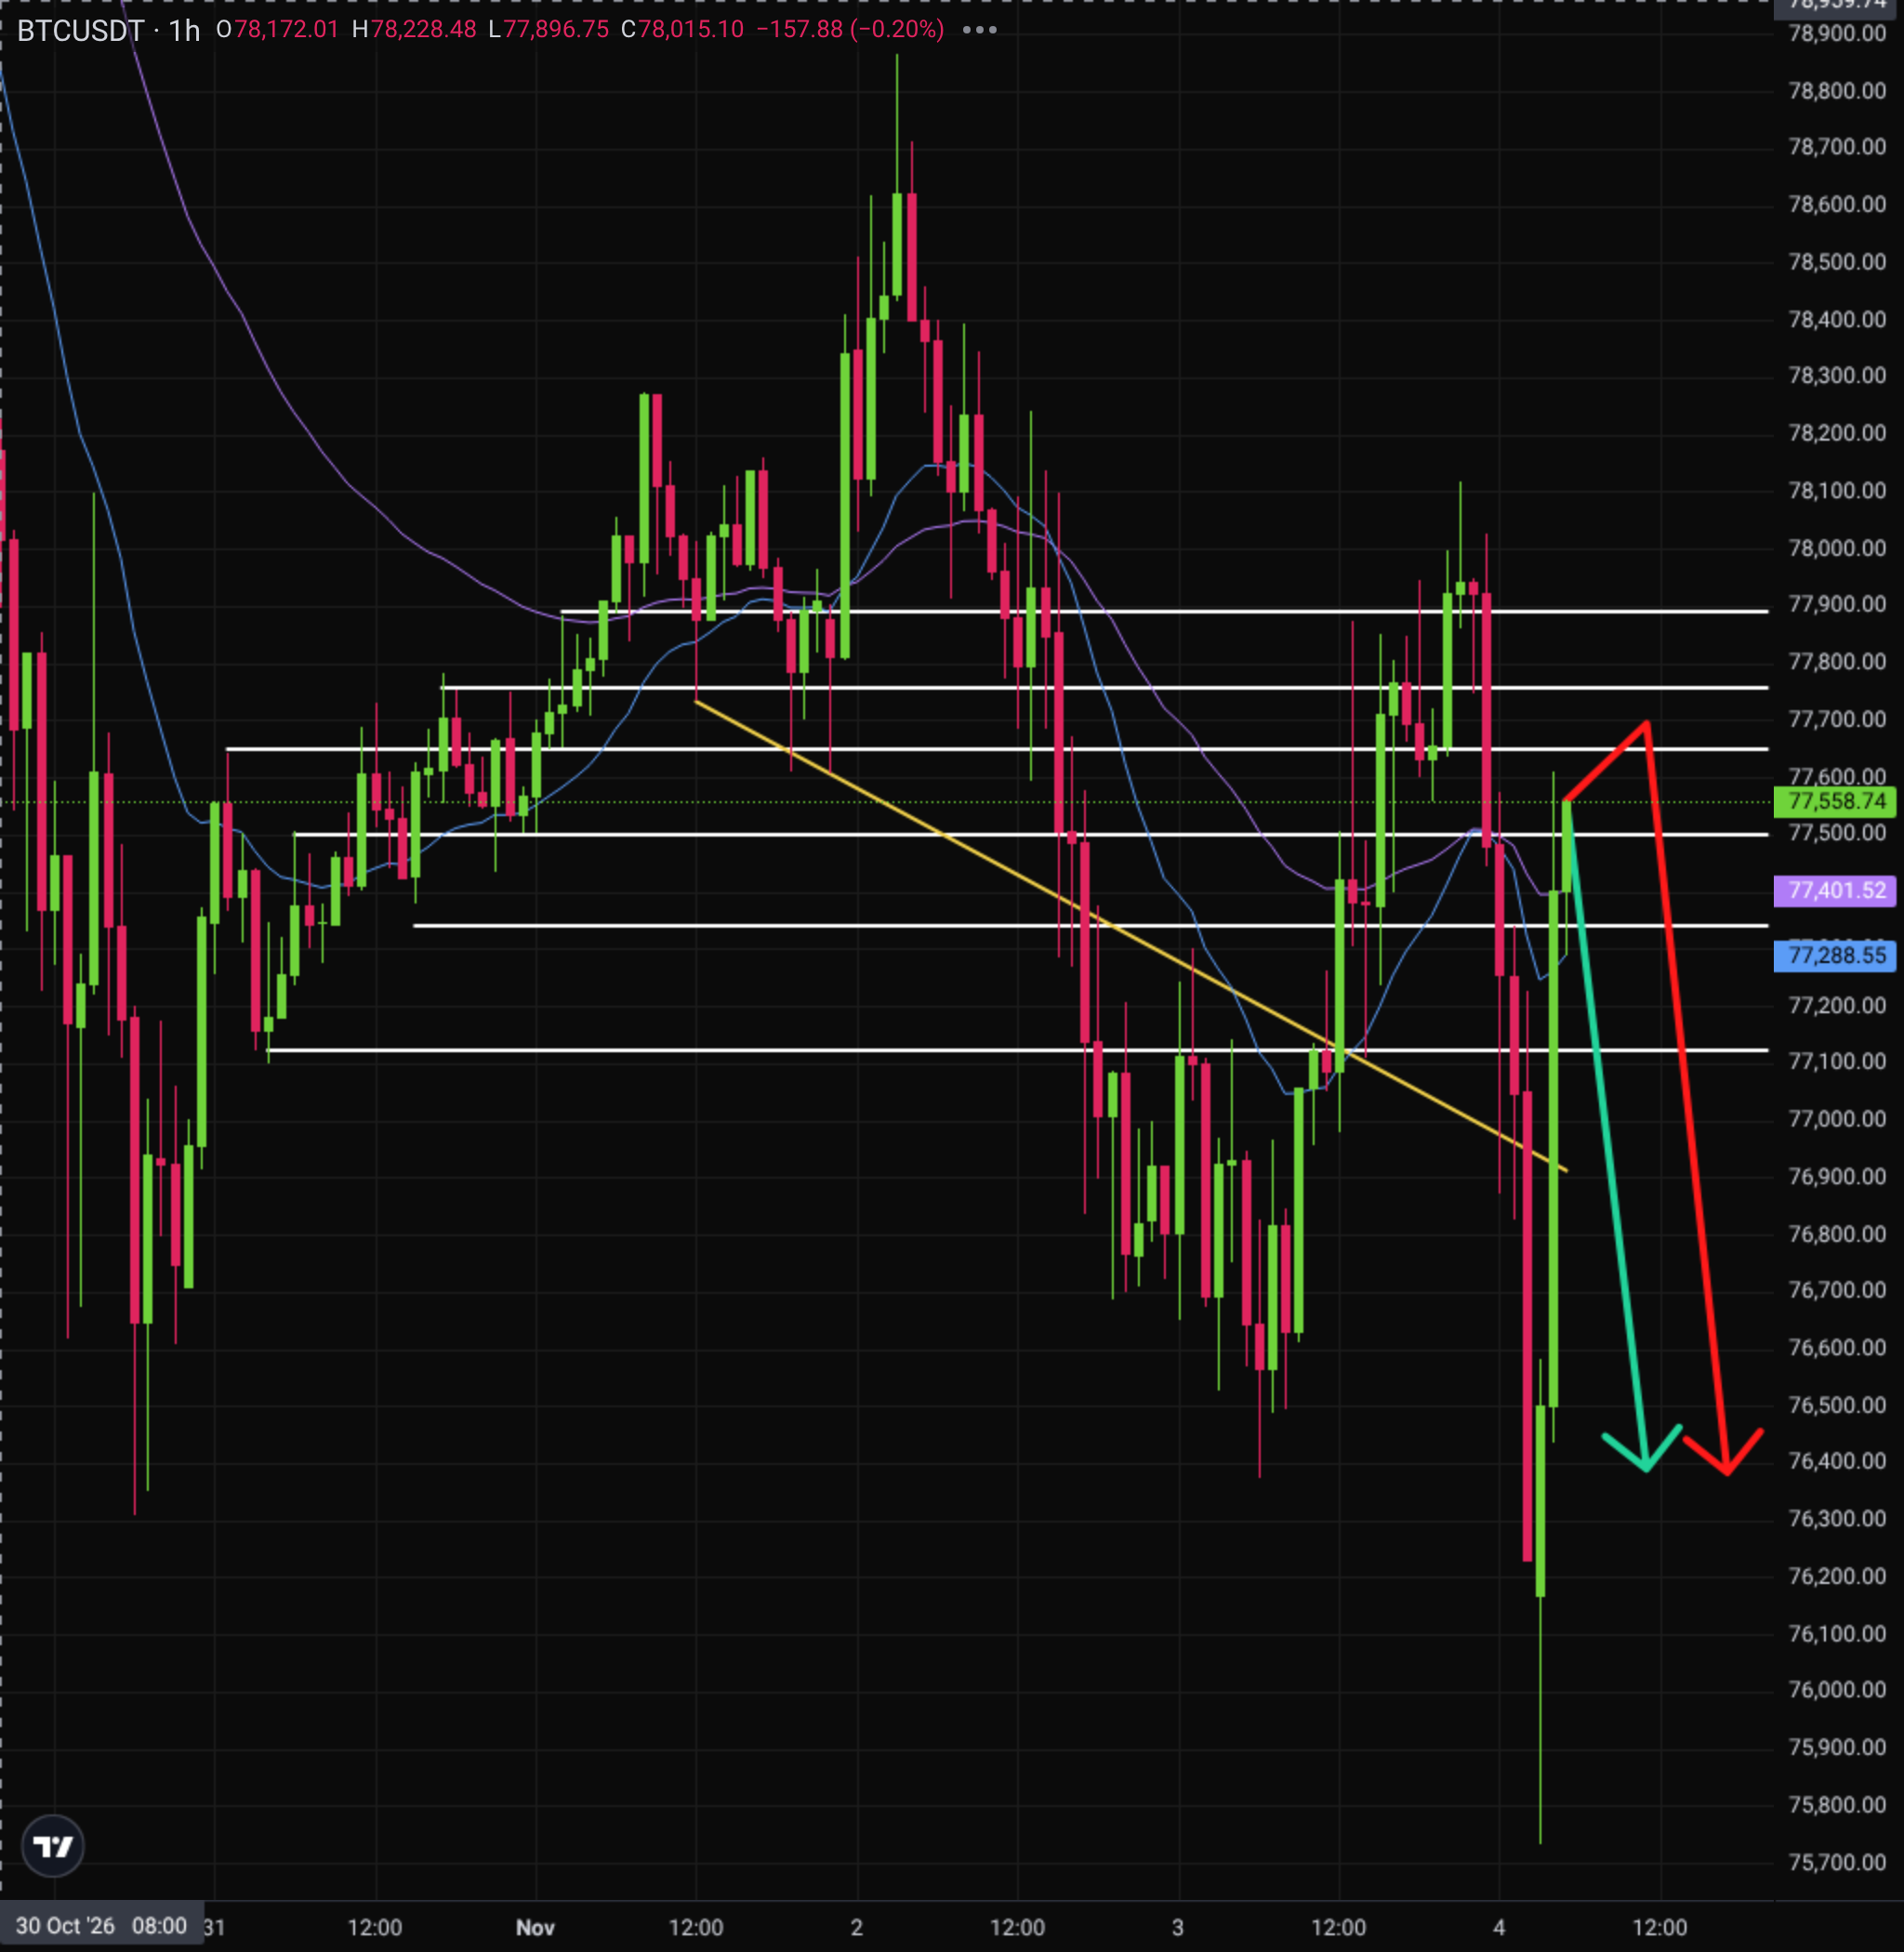
As of 4 Nov 2026, 05:00 UTC, BTC/USD trades at $77,559 in a neutral H1 trend, with support at $77,499 and resistance at $77,647. Sellers pressed through the descending support trendline, now near $76,912, and MACD is below its signal line. RSI (14) at 53.8 leaves the path of least resistance two-directional while price holds below $77,647.
RSI (14): 53.8 · MACD: below signal · EMA20: $77,289 · EMA50: $77,402 · ATR (14): $505
As of 4 Nov 2026, 05:00 UTC, BTC/USD sits at $77,560 on the H4 chart, and the bearish trend holds while price stays below EMA20 at $77,621 and EMA50 at $78,467. Sellers pressed through a descending support trendline (now near $76,935), leaving $76,390 as the nearest support and $77,693 as the first resistance. RSI (14) at 47.6 is mid-range and MACD is above its signal line, so a corrective bounce cannot be ruled out, but the path of least resistance still points lower.
RSI (14): 47.6 · MACD: above signal · EMA20: $77,621 · EMA50: $78,467 · ATR (14): $838
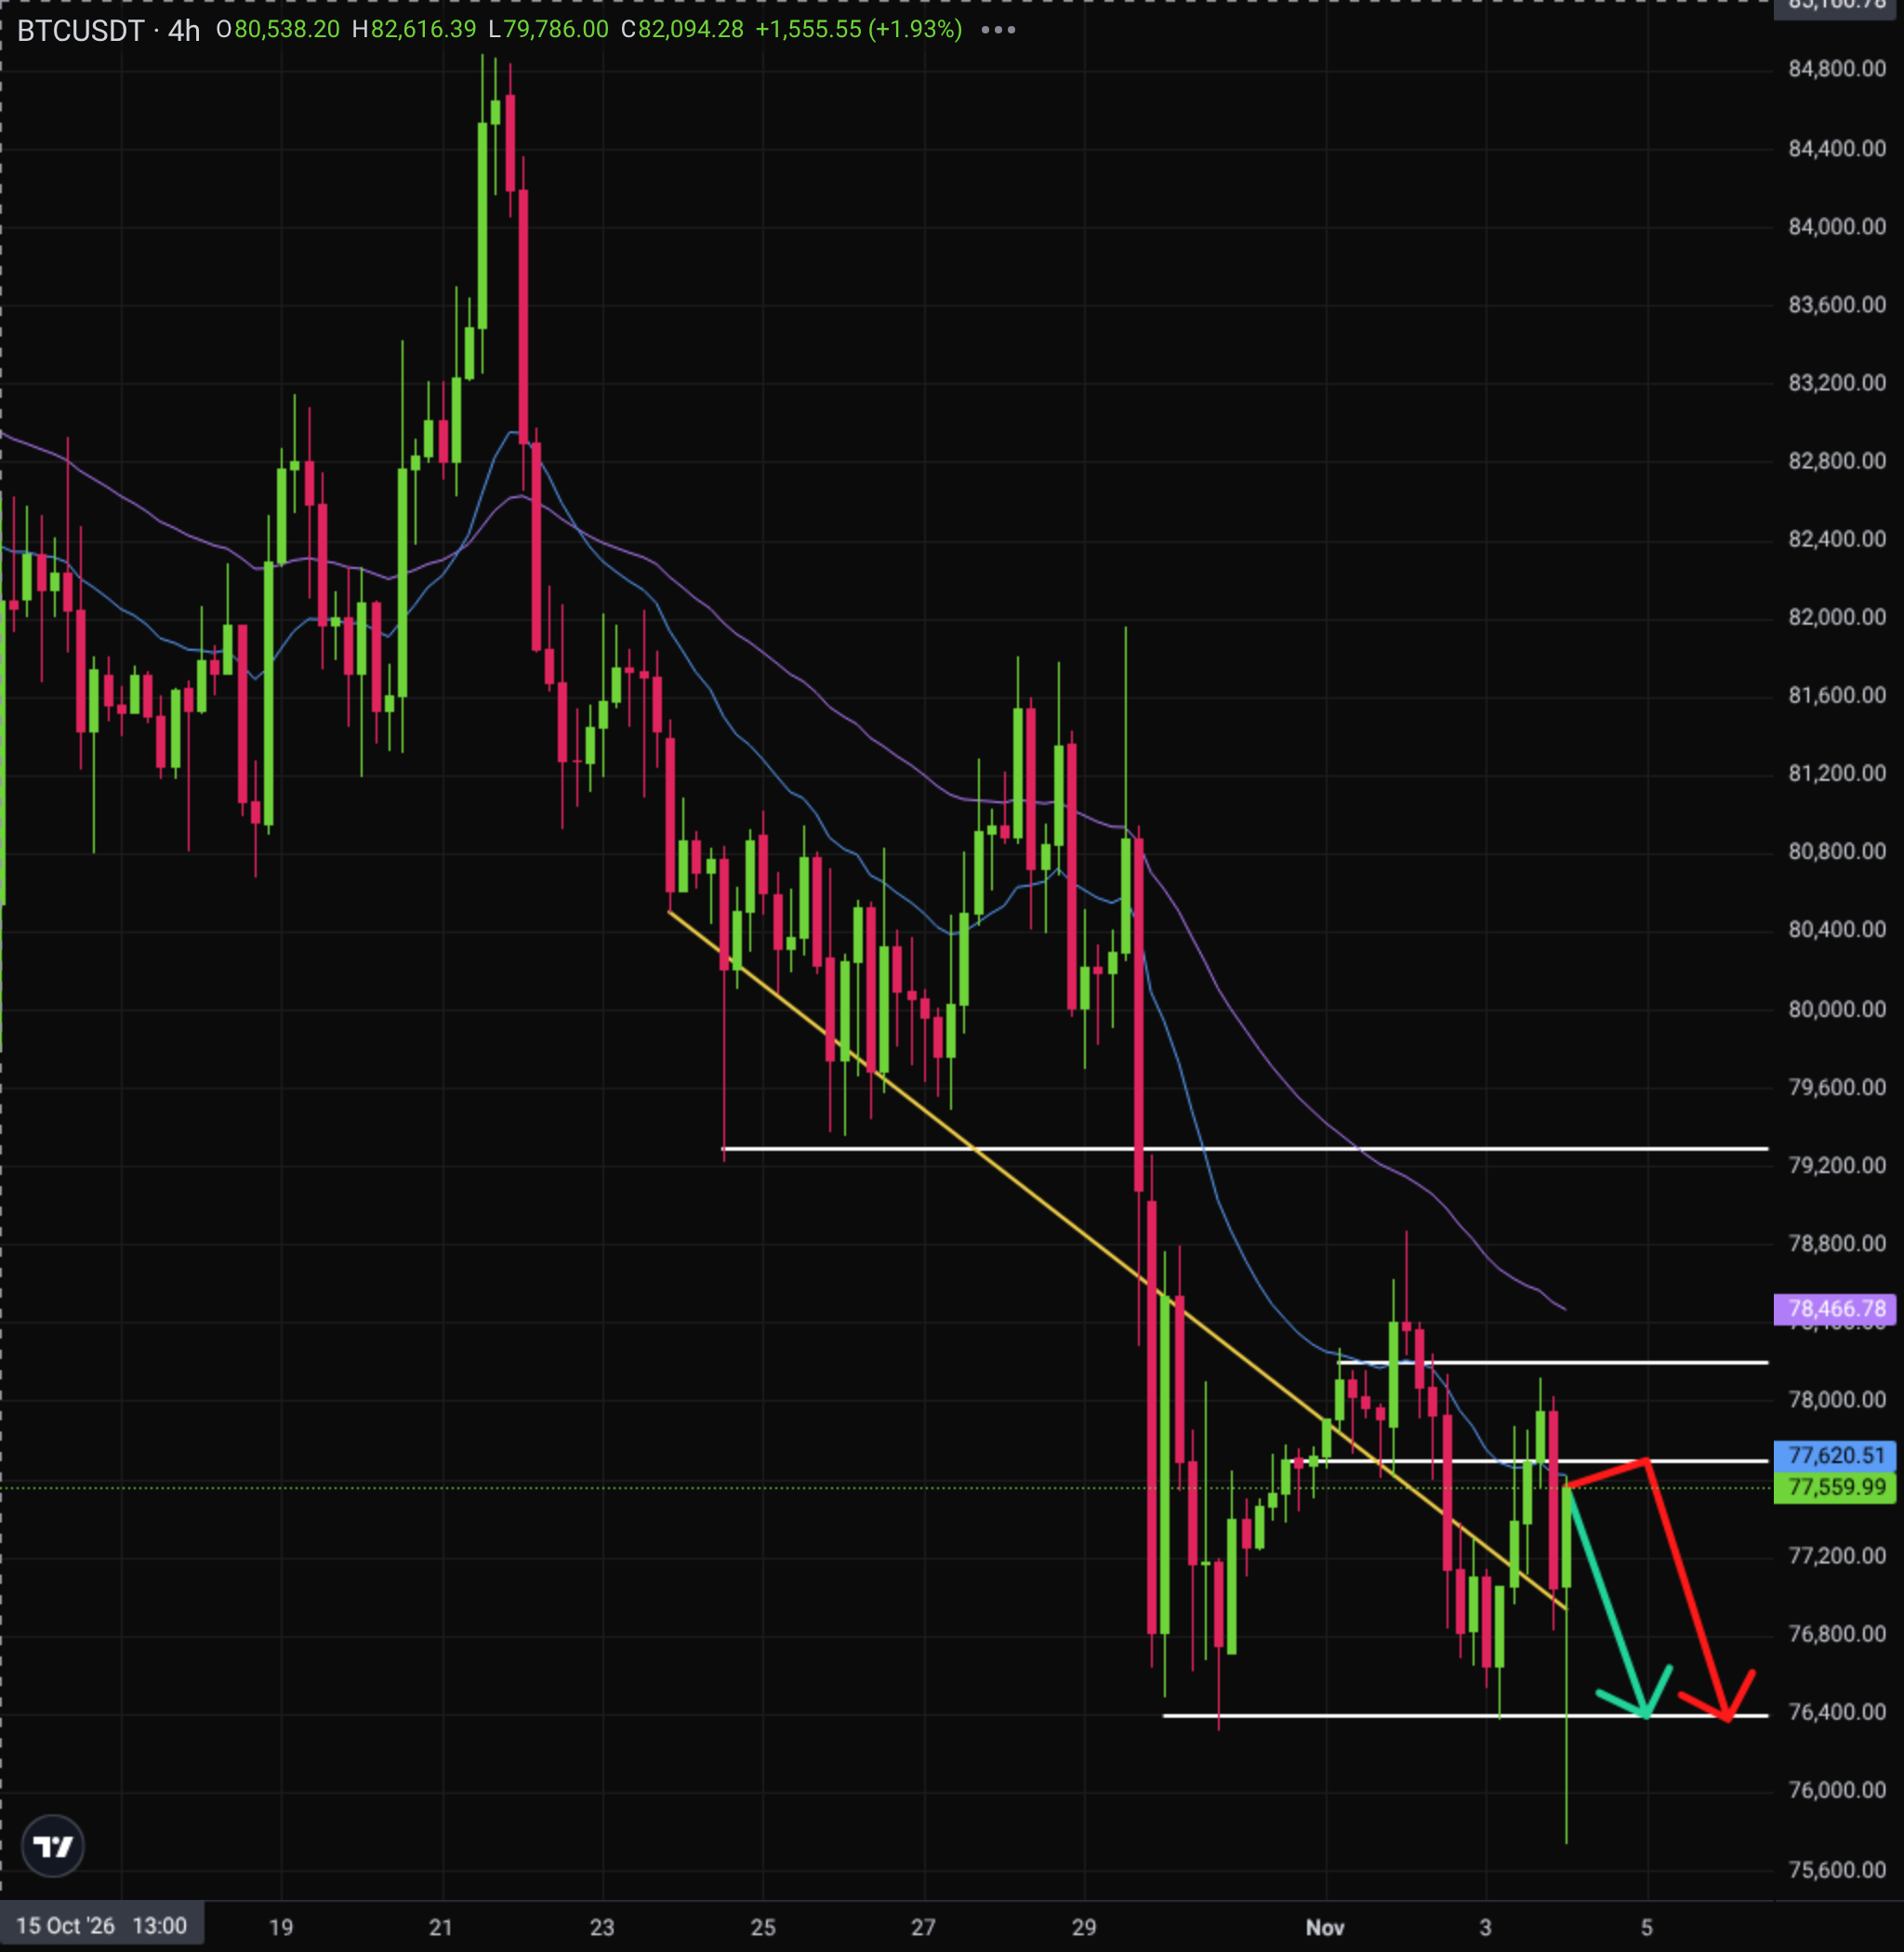
Key Bitcoin Support and Resistance Levels
Bitcoin (BTC/USD) Trading Plan for Today
Base case (1–3 days): sell at market from $77,559, target $76,390; a move above $77,903 invalidates it. Alternative: sell a rebound into $77,693, same target $76,390, with the stop above $78,405. The bearish H4 view holds over that horizon unless the base-case invalidation gives way.
Bitcoin (BTC/USD) Price Forecast for Tomorrow
Our volatility range for the next day, 5 Nov, runs from $75,215 to $79,672, with the average at $76,974; that band is a volatility estimate, not a price target. The path of least resistance points lower toward the $76,390 H4 support while BTC/USD holds below $77,903. No release sits on the calendar for 5 Nov, so the next day is likely to trade the reaction to ISM Services PMI (forecast 54.8, previous 54.9, ISM, 4 Nov).
Bitcoin (BTC/USD) Price Forecast for This Week
For 4–8 Nov our volatility range spans $72,578–81,827, average $76,974, again an estimate rather than a price target. ISM Services PMI is due on 4 Nov (forecast 54.8, previous 54.9, ISM), then nonfarm payrolls on 6 Nov (forecast 65K, previous 29K, BLS), with the unemployment rate seen at 4.2% (BLS) and Michigan sentiment prelim at 48 (University of Michigan). Our base case over 1–3 days looks for $76,390, and a firmer payrolls print could keep the week two-directional inside that range.
Upcoming Economic Events
Key USD events from the Investizo economic calendar; it lists events through 17 Nov 2026 so far.
Bitcoin (BTC/USD) Price Forecast for the Next 30 Days
Our base case into 3 Dec keeps Bitcoin heavy, with our 30-day volatility range at $61,015–88,980 and a midpoint near $76,969, not a price target. The dollar and real yields still set the backdrop after the Fed held the funds rate at 3.75–4.00% (Federal Reserve, 28 Oct). September PCE rose 3.6% y/y and core PCE 3.1% y/y, while GDP grew 3.4% in the advance estimate (BEA, 29 Oct). ISM manufacturing printed 55.5 (ISM, 2 Nov), and Treasury expects to borrow $618 billion this quarter (U.S. Treasury, 2 Nov). JOLTs openings are due on 3 Nov (forecast 7.13M, BLS) and ISM services on 4 Nov (forecast 54.8, ISM). Payrolls on 6 Nov (forecast 65K, previous 29K, BLS) and CPI on 10 Nov (previous 3.7% y/y, BLS) are the dates that can swing Fed expectations either way. On the weekly chart the trend is bearish; $80,000 is overhead resistance, while $75,000, $72,492 and $70,000 are the supports inside the range. A soft payrolls print cannot be ruled out as a bounce catalyst, but the path of least resistance points lower unless $77,870 gives way.
Volatility-based estimate, not a price target: 90th percentile of historical moves over the same number of days in the last 17 months of daily data, in ATR (14, D1) units, scaled by the current ATR; the average sits halfway to the base-case target.
As of 3 Nov 2026, 12:00 UTC, Bitcoin trades at $77,438.25 on a bearish weekly chart, below EMA50 at $78,306 and above EMA20 at $76,636. RSI (14) at 51.6 and MACD above its signal line leave the tape two-directional, with broken rising support near $84,903 overhead and $75,000 the nearest weekly support.
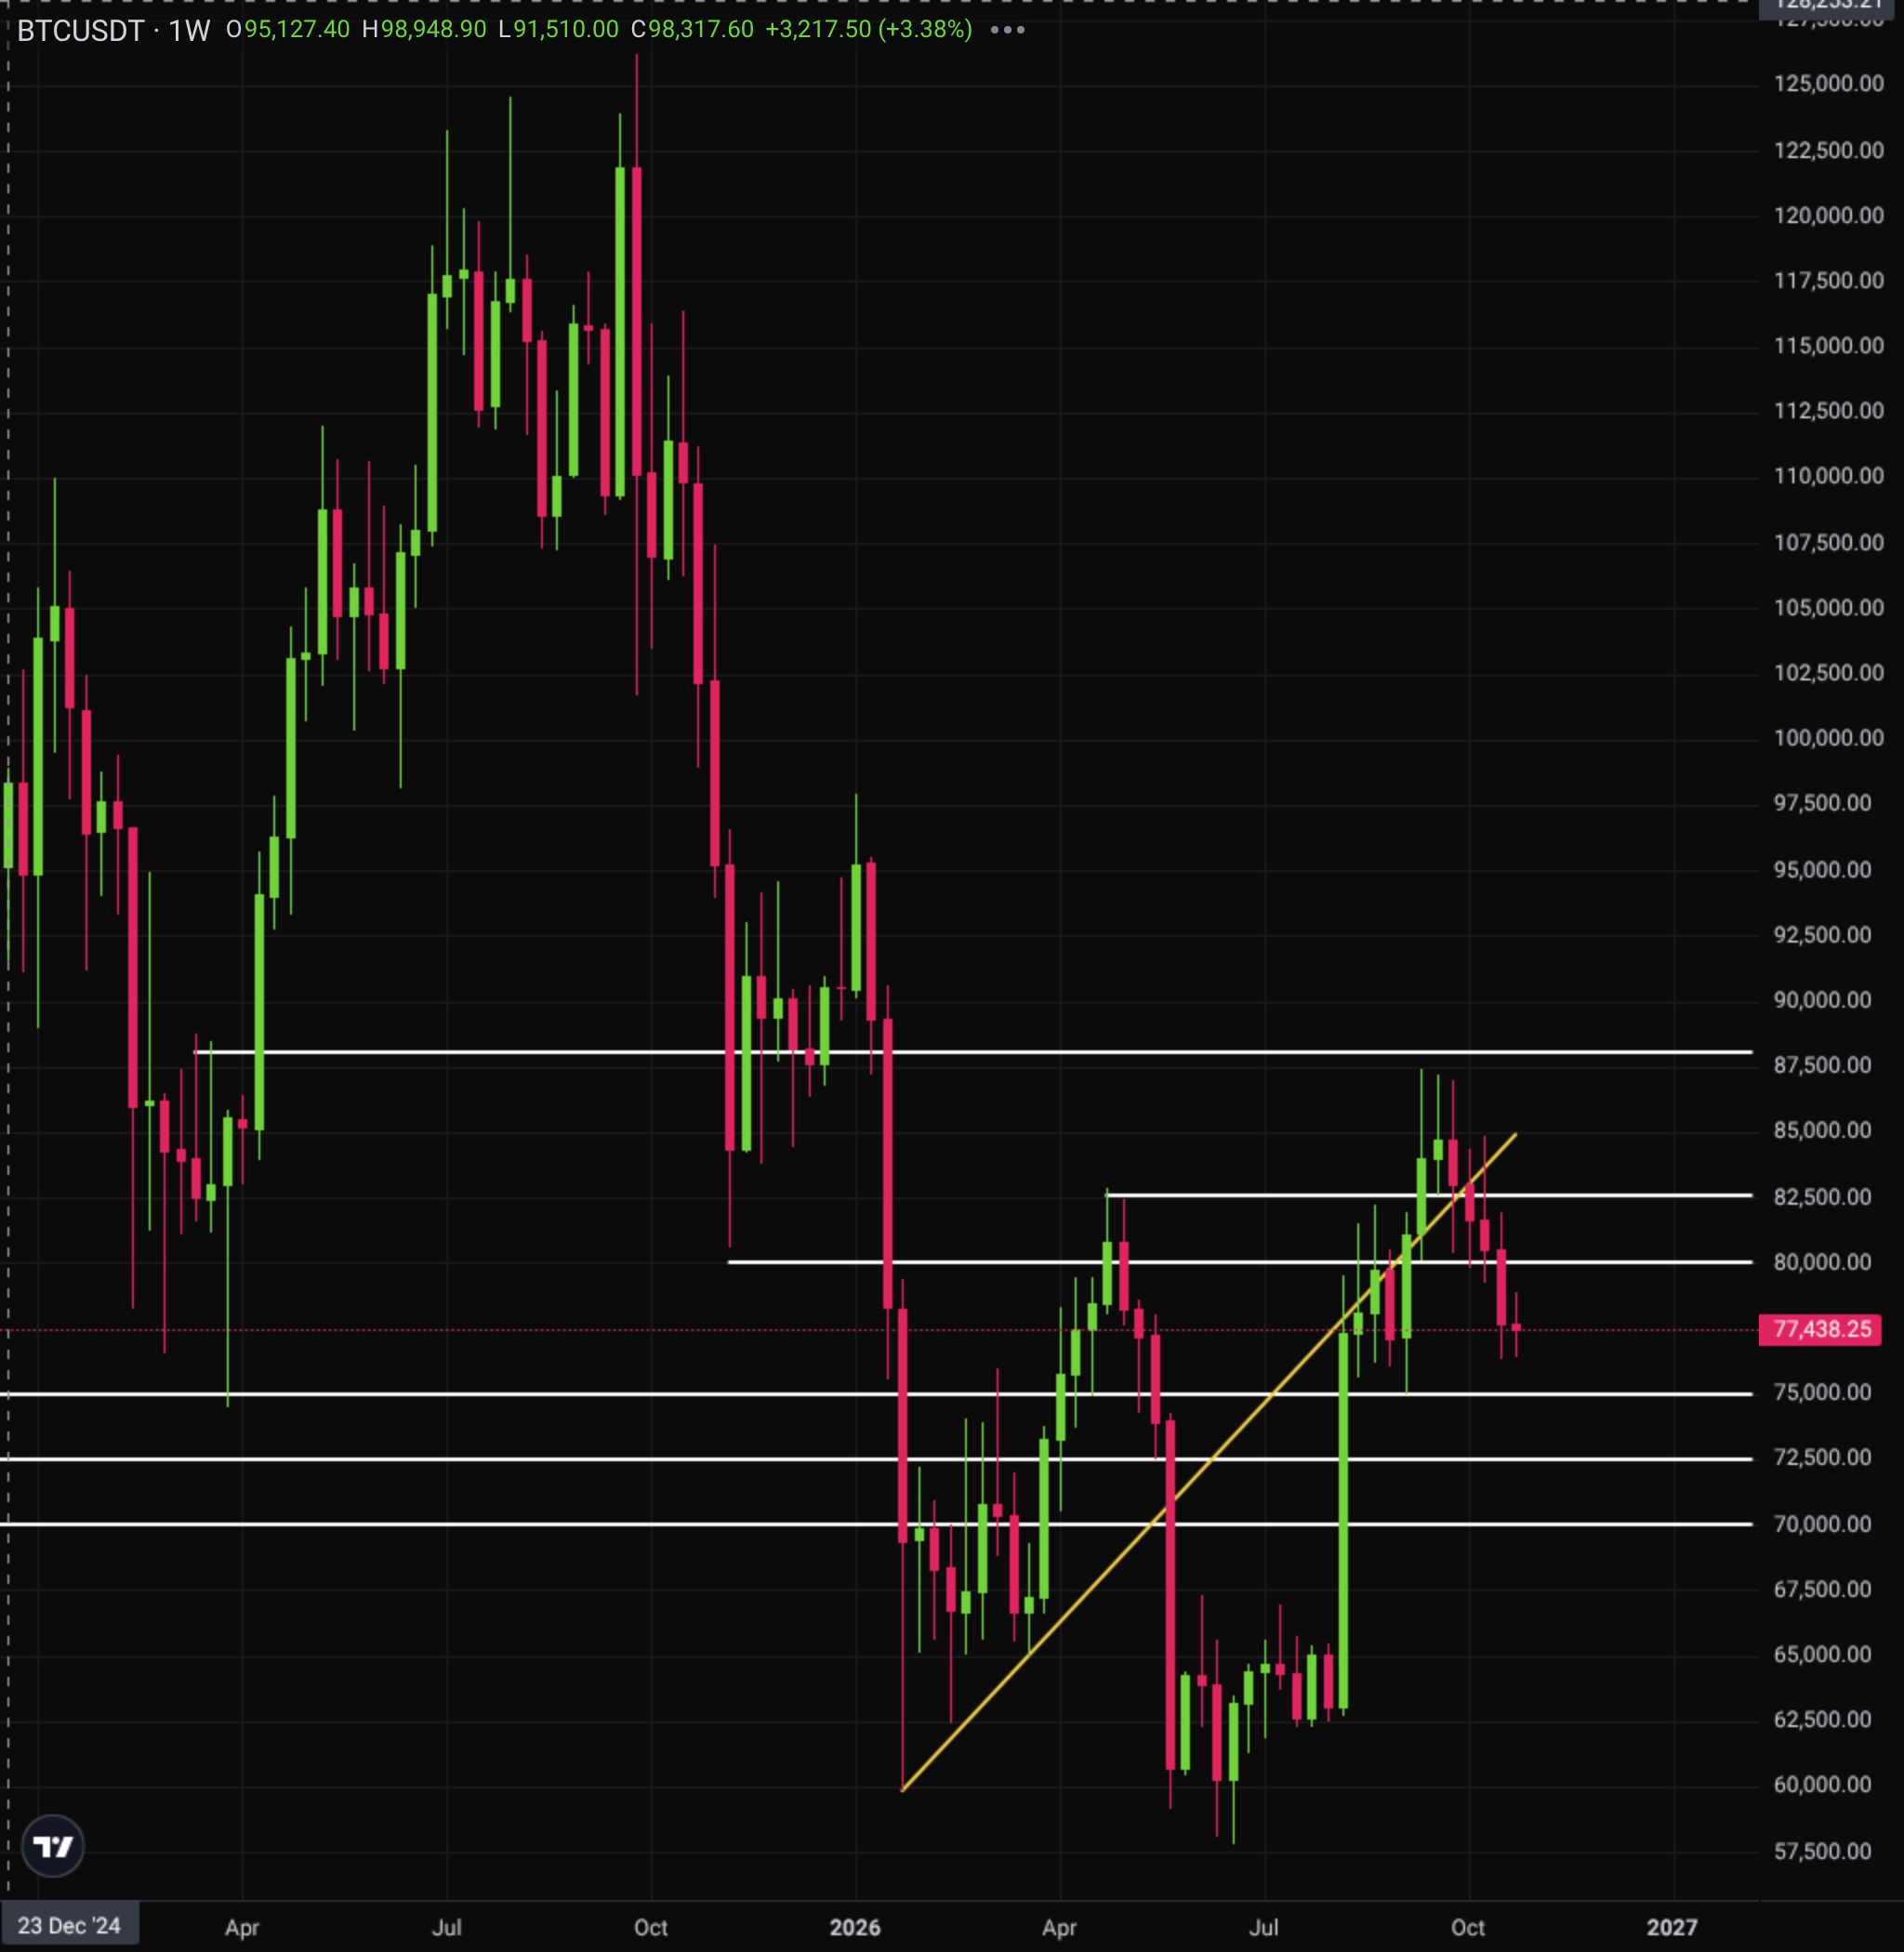
30-Day Scenarios
- Base case: while price holds below $77,870, we expect a drift toward $76,500 and then $75,000 by 3 Dec, inside the $61,015–88,980 volatility range.
- Bullish case: a breakout above $80,000 after payrolls on 6 Nov or CPI on 10 Nov opens $82,548, with $88,062 the upside target still inside the range.
- Bearish case: a breakdown below $75,000 on a firm payrolls or inflation print targets $72,492 and $70,000, above the range floor at $61,015.
Is Bitcoin a Good Investment?
Bitcoin still takes its direction from the dollar and Fed expectations rather than from a single crypto-specific catalyst. The FOMC kept the funds rate at 3.75–4.00% (Federal Reserve, 28 Oct), PCE inflation was 3.6% y/y (BEA, 29 Oct), and real GDP rose 3.4% in the third quarter (BEA, 29 Oct). Firm growth with sticky prices can leave real yields a headwind, unless payrolls on 6 Nov or the inflation data on 10 Nov soften the dollar. If you hold it, the risk is the swing itself: our 30-day volatility range of $61,015–88,980 is a historical-move estimate, not a price target.
Summary
BTC/USD is bearish as of 4 Nov 2026, 05:00 UTC, with Bitcoin at $77,558.74. Our base case looks for $76,390 over the next 1–3 days, and a move above $77,903 would invalidate that view. Payrolls on 6 Nov are the catalyst that could turn the near-term path the other way.
Bitcoin Price Analysis and Forecasting Methodology
Prices are Investizo MT4 quotes. Indicators: EMA20 and EMA50, RSI (14), MACD (12, 26, 9) and ATR (14), on H1, H4, D1 and weekly bars. Support and resistance come from swing highs and lows (clustered within a quarter of ATR) and round psychological numbers; trendlines connect swing points. The bias follows the H4 and daily trends (price and EMA20 against EMA50). Entries sit at a level, on a retest or on a break of a level; the stop is the level that invalidates the setup, and the target is the next level with at least 1.5 times the risk. Ranges for the next day, week and 30 days are volatility-based, as described under the 30-day table.
Sources
- Federal Reserve, 28 Oct 2026: The Federal Open Market Committee decided to maintain the target range for the federal funds rate at 3-3/4 to 4 percent.
- BEA, 29 Oct 2026: From the same month one year ago, the PCE price index for September increased 3.6 percent.
- BEA, 29 Oct 2026: Real gross domestic product (GDP) increased at an annual rate of 3.4 percent in the third quarter of 2026.
- BEA, 29 Oct 2026: Excluding food and energy, the PCE price index increased 3.1 percent from one year ago.
- Federal Reserve, 3 Nov 2026: The 10-year Treasury constant maturity yield was 4.91 percent on November 2, 2026.
- Federal Reserve, 28 Oct 2026: The Board of Governors voted unanimously to maintain the interest rate paid on reserve balances at 3.90 percent, effective October 29, 2026.
- Economic data: official statistics agencies and central banks via the Investizo economic calendar.
- Prices: Investizo MT4 quotes.
The trade levels, signals and forecasts in this article are calculated automatically from technical indicators and price history. They are not investment advice or a recommendation to buy or sell any financial instrument. Past performance and forecasts do not guarantee future results. Risk Warning: CFDs are complex financial products traded on margin. Trading CFDs is risky and may not be suitable for all investors. Ensure you understand the risks involved as you may lose all your invested capital.
Bitcoin (BTC/USD) Price Forecast FAQs
Will Bitcoin go up tomorrow?
Our base case does not point higher for 5 Nov. The volatility range for the next day is $75,215–79,672, and we expect selling pressure toward $76,390 while that setup holds. A stronger read from ISM Services PMI on 4 Nov (ISM) could still produce a corrective bounce.
What is the BTC/USD rate today?
As of 4 Nov 2026, 05:00 UTC, Bitcoin trades at $77,558.74, down 0.49% on the day. The market is open, and the day's range so far has run from $75,733 to $78,027. The weekly change is a smaller 0.14% decline.
What is the Bitcoin forecast for this week?
Our volatility range for 4–8 Nov is $72,578–81,827, with the average at $76,974; it is not a price target. The base case over 1–3 days is a decline toward $76,390. Nonfarm payrolls on 6 Nov (forecast 65K, previous 29K, BLS) are the main event inside that window.
Why has Bitcoin been under pressure?
Real yields and Fed expectations remain the macro drivers. The 10-year Treasury yield was 4.91% on 2 Nov (Federal Reserve, 3 Nov), and the Fed held the funds rate at 3.75–4.00% (Federal Reserve, 28 Oct). PCE inflation was 3.6% year on year and GDP grew 3.4% in the advance estimate (BEA, 29 Oct), which leaves less room for an early easing path.
What is the 30-day Bitcoin range?
Our 30-day volatility range, from 4 Nov to 3 Dec, runs from $61,015 to $88,980, with the average at $76,969. It is a volatility-based estimate, not a forecast that Bitcoin will trade the whole band. Inflation data on 10 Nov (BLS) and retail sales on 17 Nov (U.S. Census Bureau) sit inside that horizon.
Is Bitcoin a good investment right now?
Bitcoin can act as a liquid, high-volatility asset whose swings often track the dollar, real yields and risk appetite, so the same macro print can move it hard either way. You take gap risk around data such as payrolls on 6 Nov and CPI on 10 Nov, and the near-term bias is bearish rather than a settled uptrend. Nothing here is a promise of return, and the level that would change our base case is the one named in the trading plan.
Khaled Kamal is a Market Analyst & Business Development Manager at Investizo with several years of experience in the financial services industry. His areas of focus include forex markets, trading strategies, risk management, copy trading and the practical aspects of financial markets.
Award history
More about awards
2023—2026 - 8 awards archived