
Crude Oil Price Forecast for Today, Tomorrow, Next Week, and 30-Day Forecast

Clear oil prices forecast with key levels, market drivers and outlook for today, the week ahead and the next 30 days to guide trading decisions.
This WTI oil technical analysis covers the main factors driving oil prices: OPEC+ decisions, US inventory data, geopolitical risks, and global demand. See why Crude oil remains a highly liquid instrument for trading in the market, and follow the latest oil price forecast for crude oil.
Key Takeaways
Intraday buy setups favor a bounce from the $83.00 support zone, with stops below recent swing lows; sell opportunities open near the $86.50–87.00 resistance cluster.
On the weekly view, the prevailing downtrend remains intact while price stays below $87.00; a sustained break higher would shift the short-term bias.
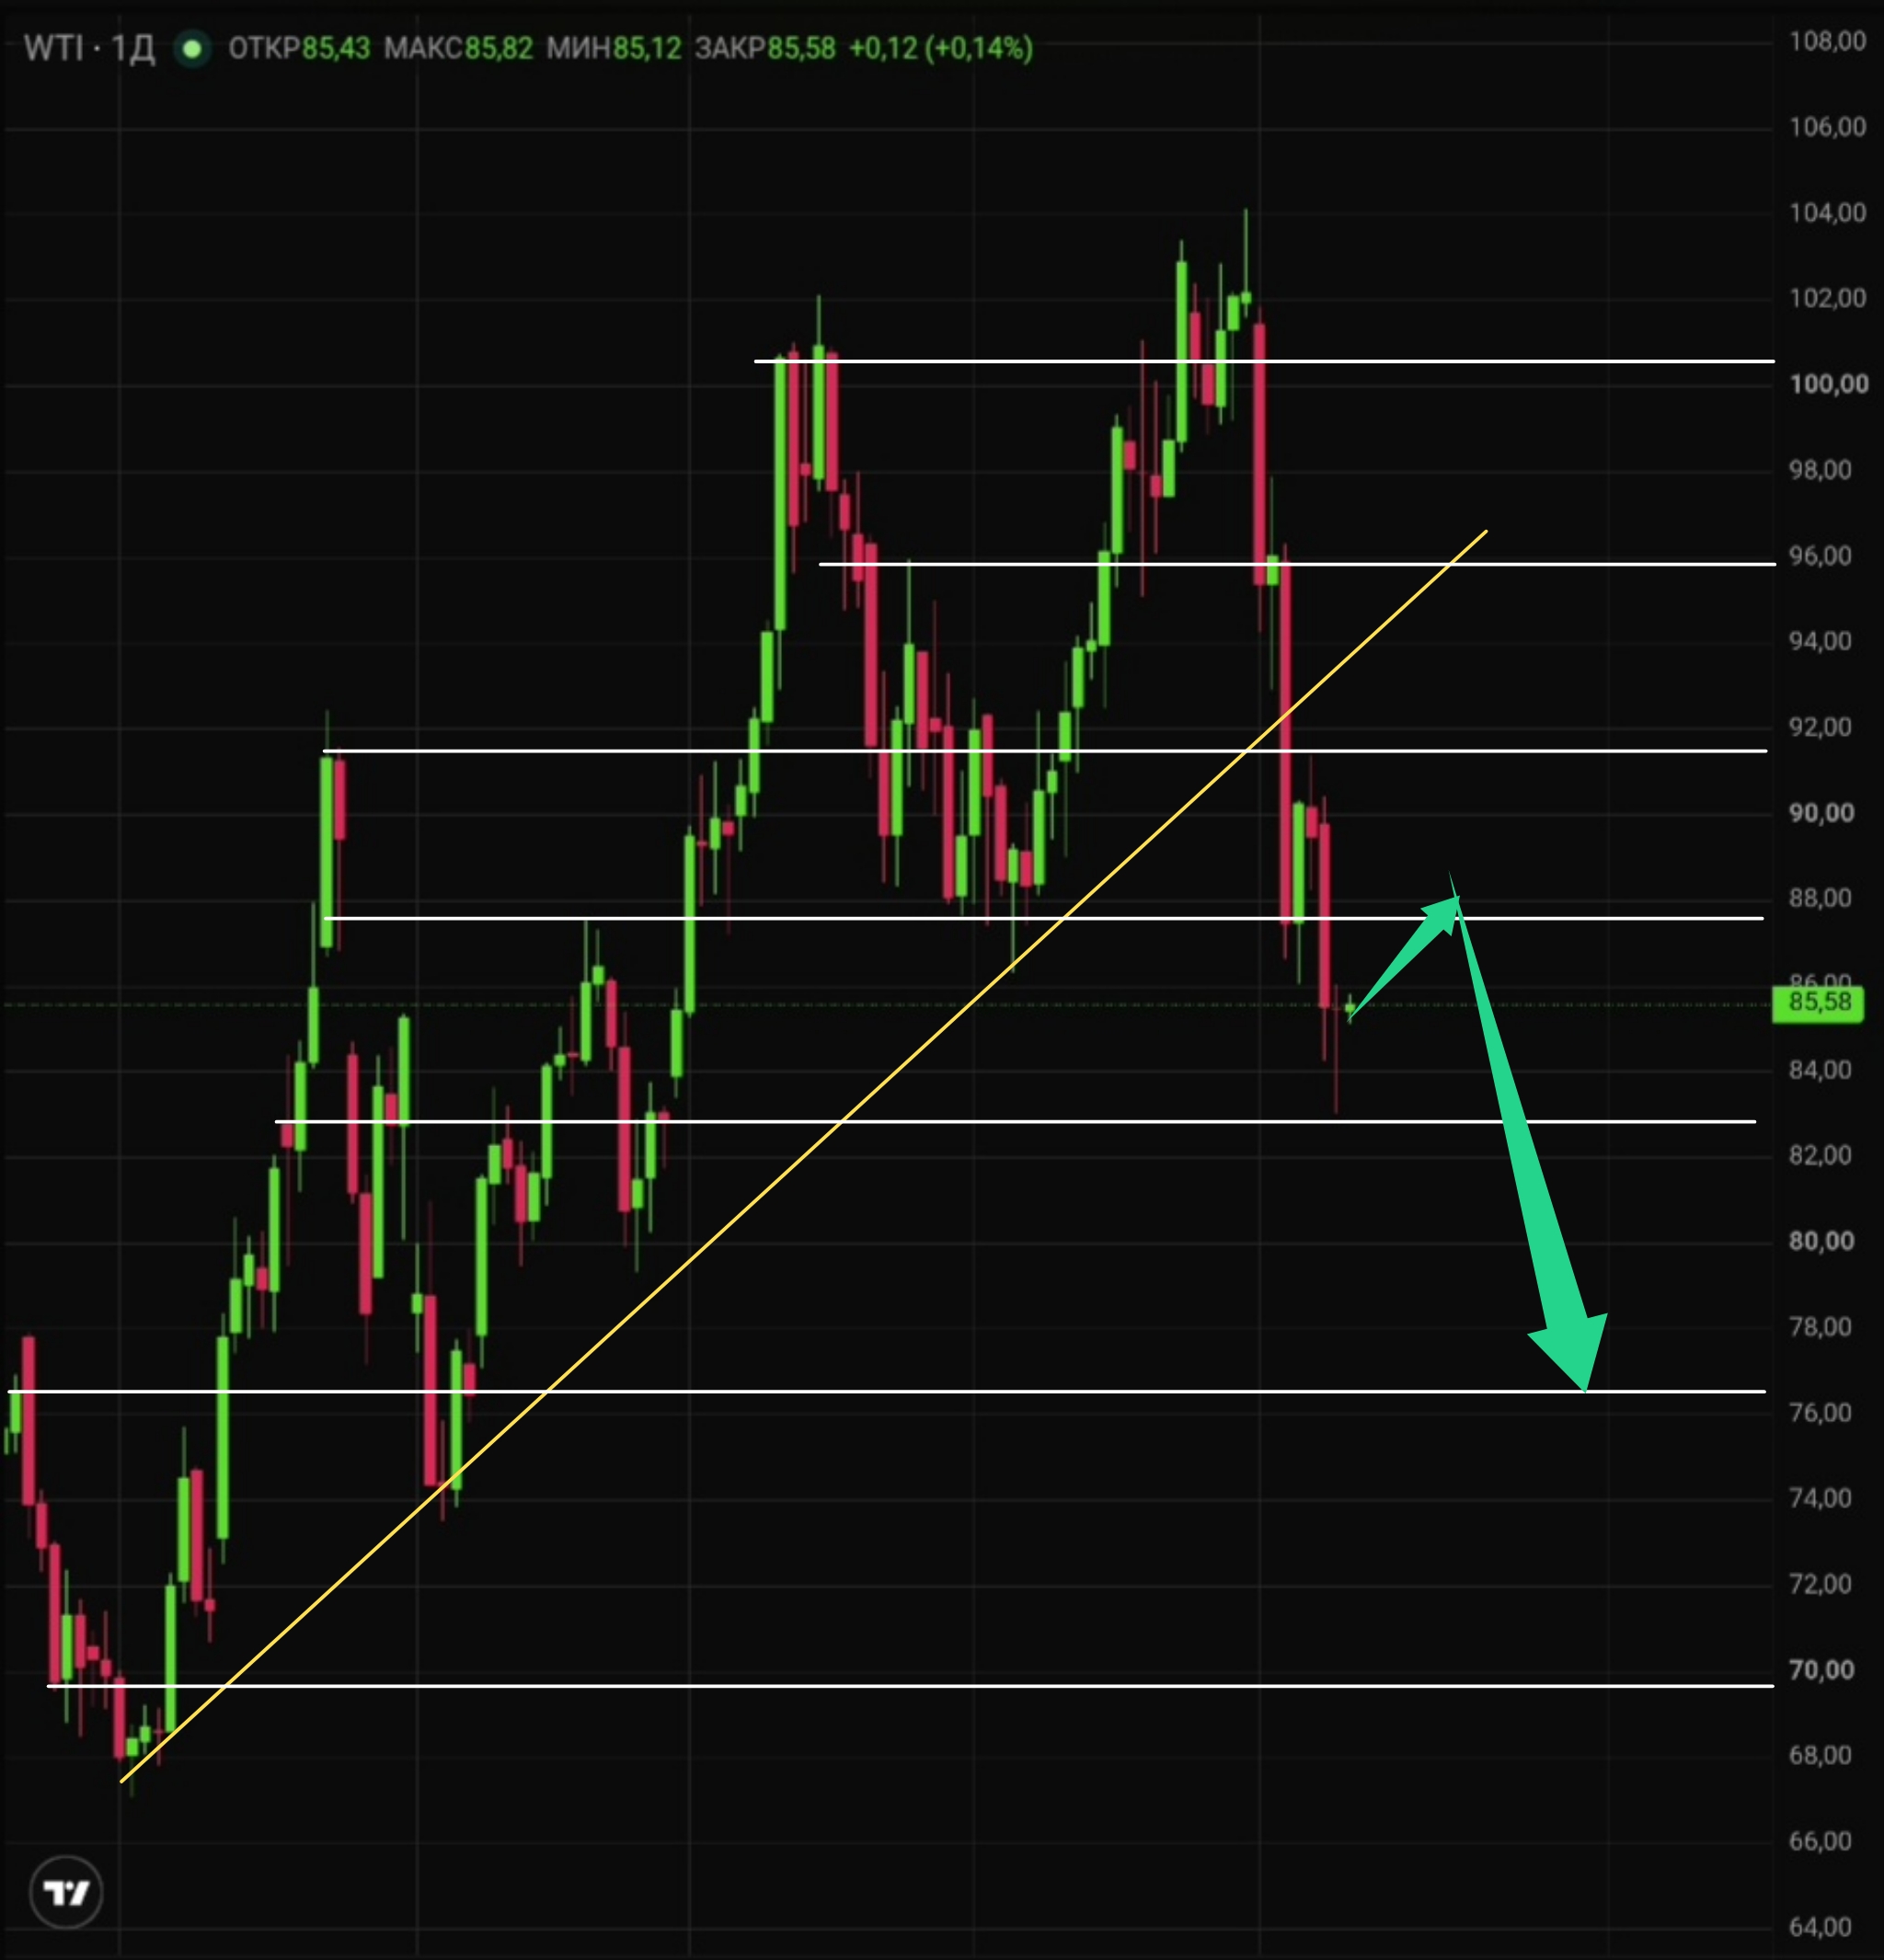
Over the next 30 days the primary downside target remains the $76.00 area if the $88.00 zone acts as fresh supply, while a confirmed move above $87.00 opens the path toward $88.00–89.00.
Latest WTI Crude Oil Technical Analysis for Today
H1: Local rebound signals are appearing from the $83.00 support. Price may test the $86.00 and $87.00 zones already today.
RSI: 47,68
MACD: Bullish
MA: $85,40
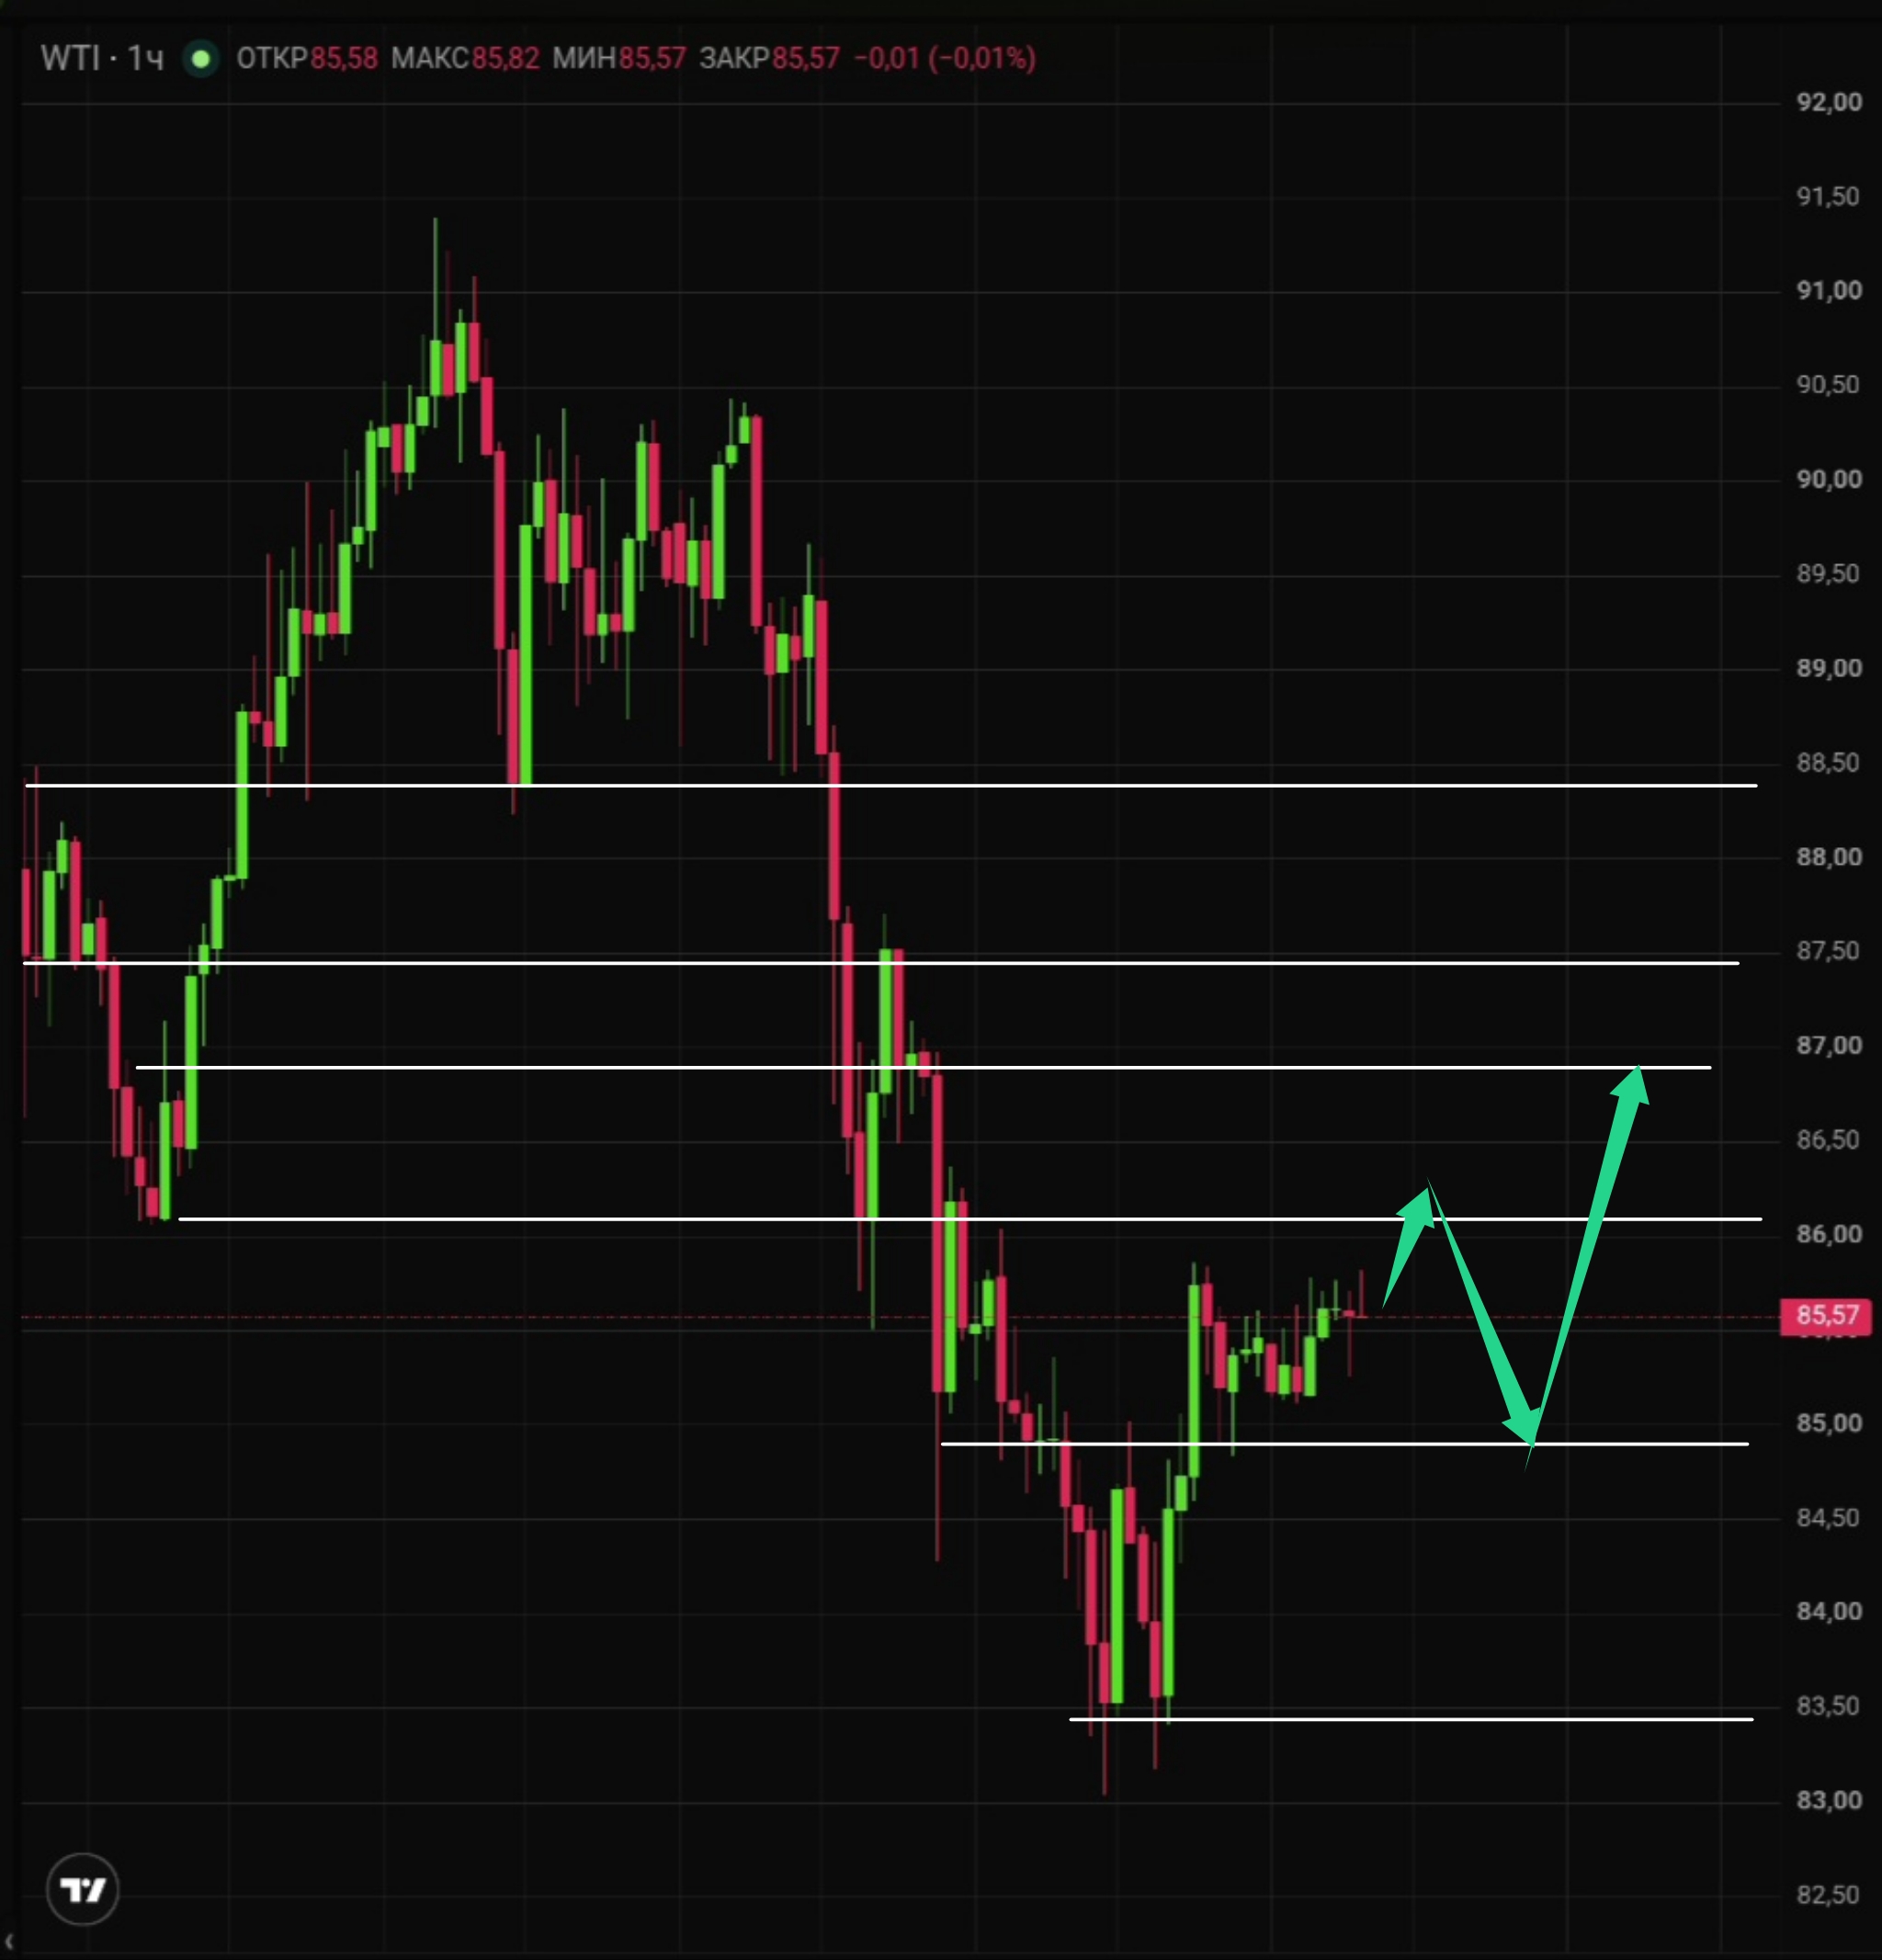
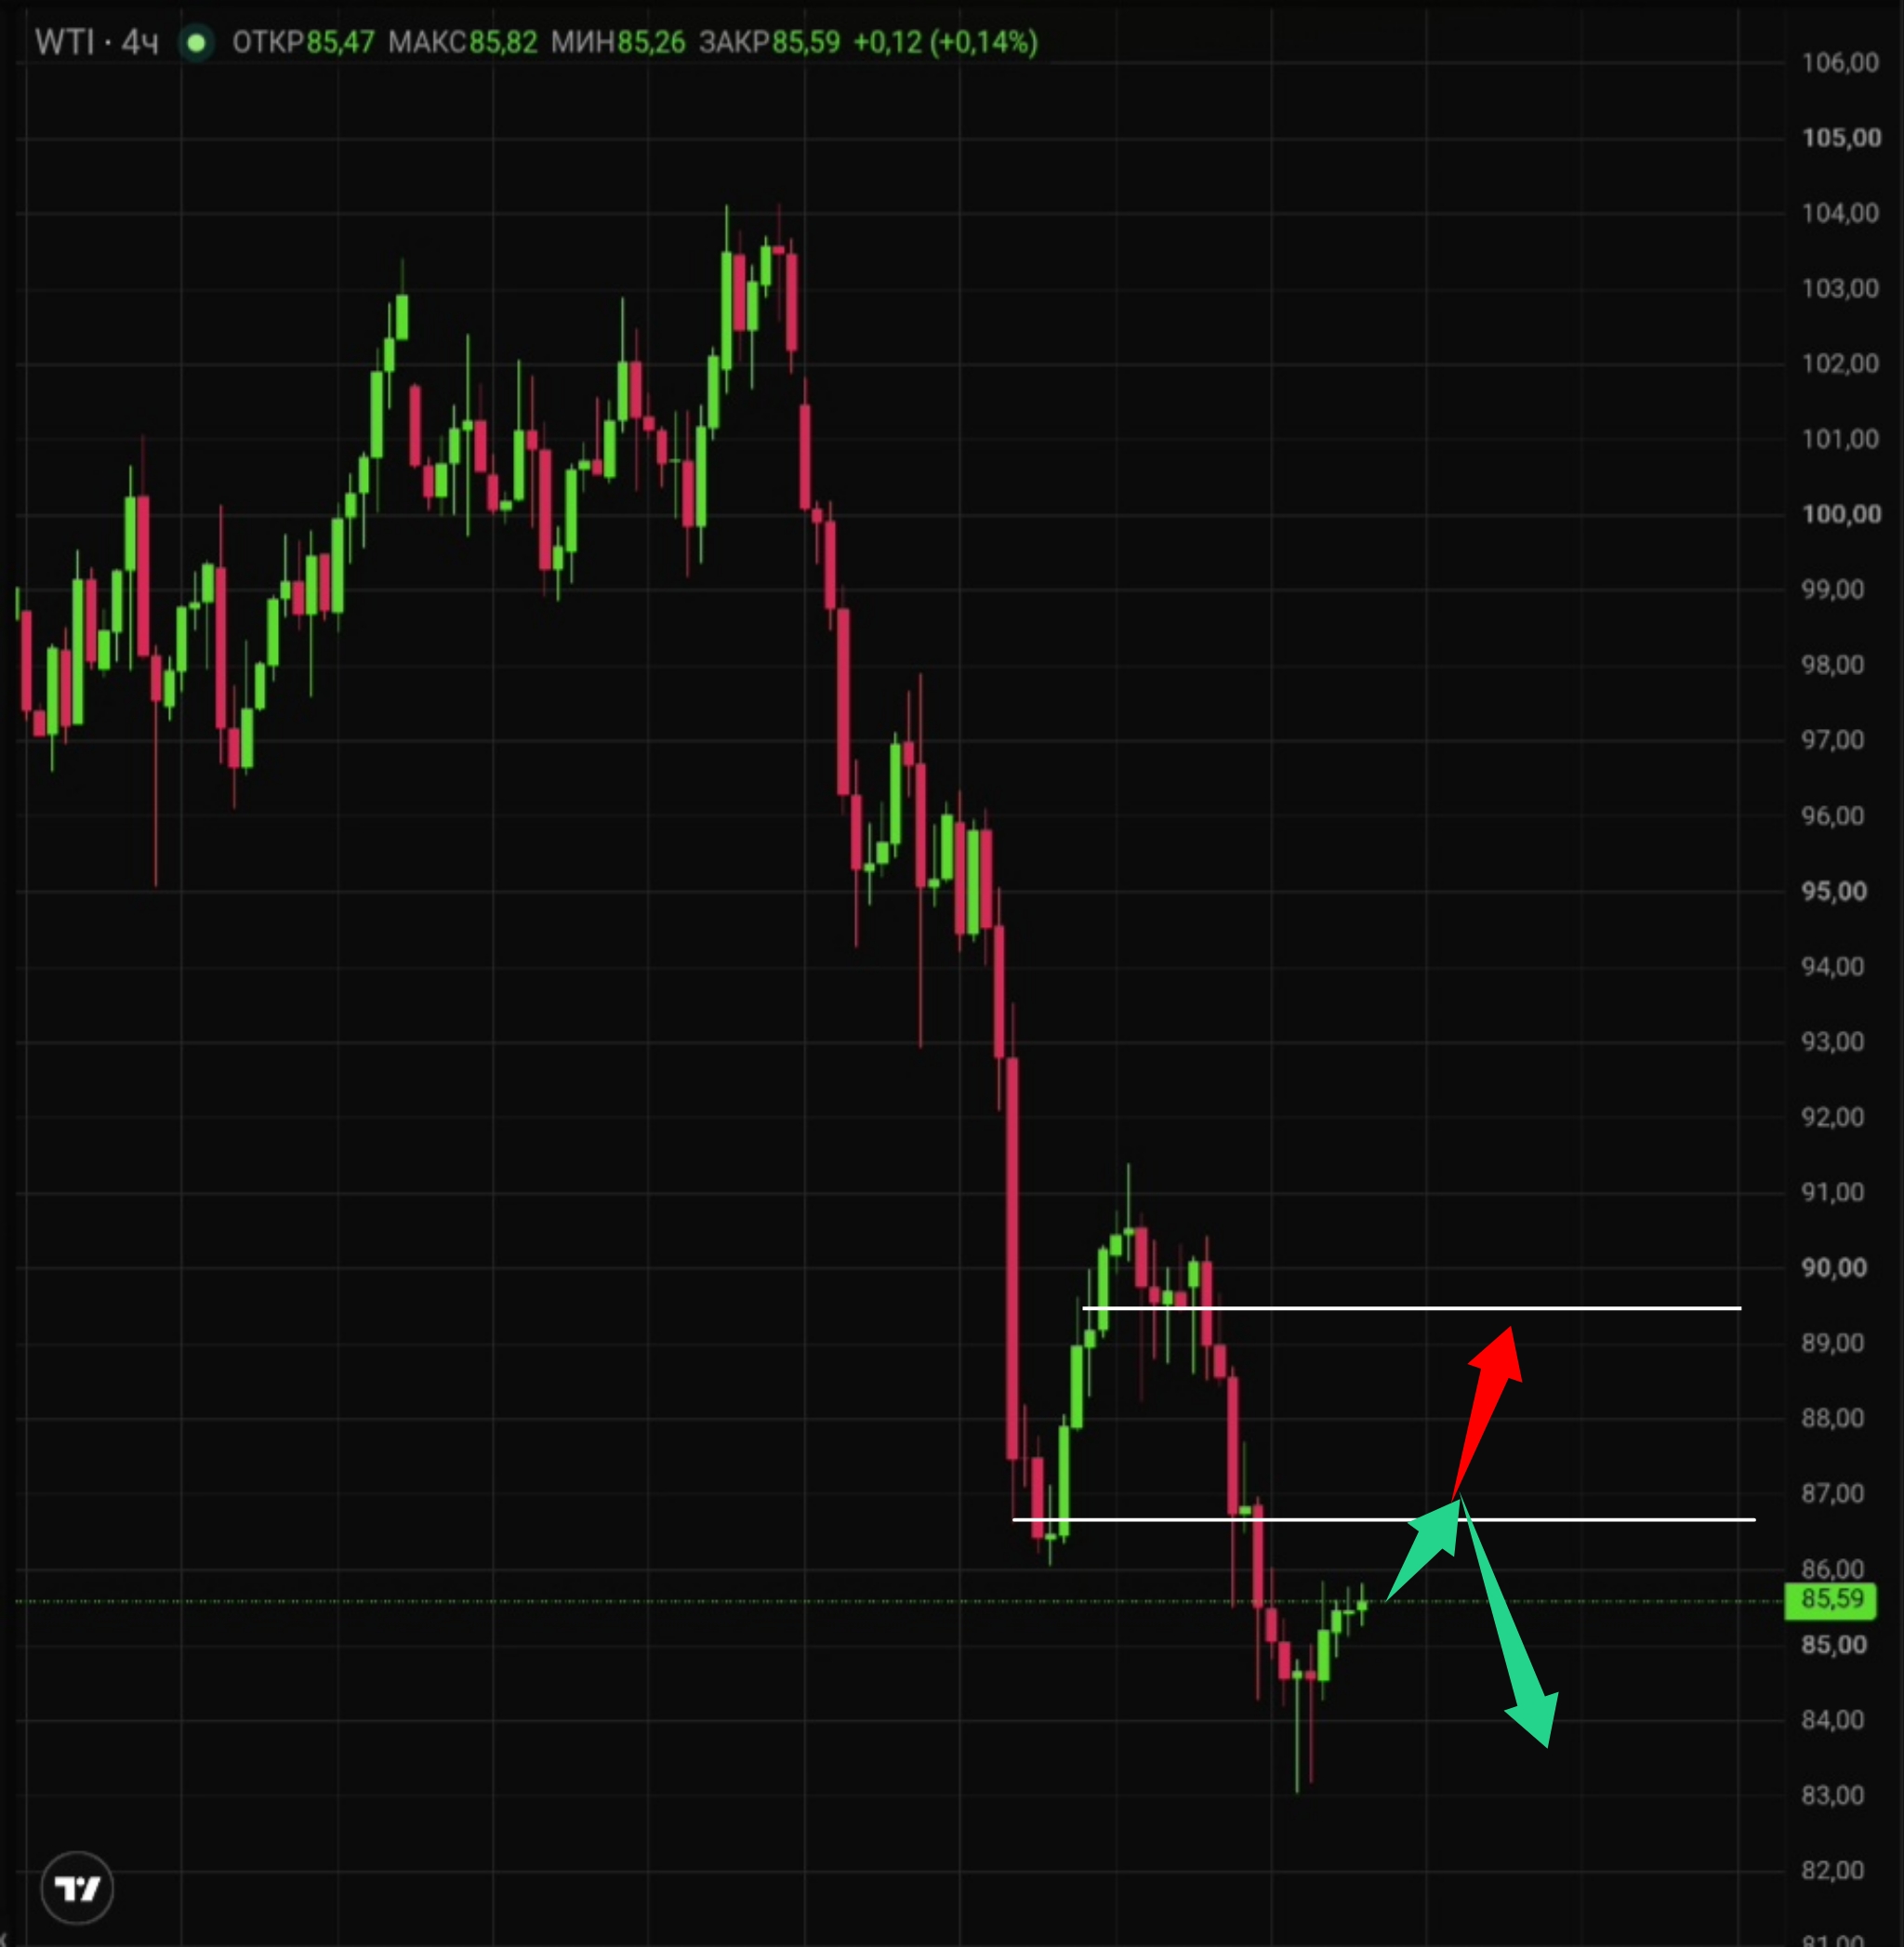
H4: The $86.50–87.00 area represents key resistance. Reaction at this cluster will clarify the near-term balance between buyers and sellers. As long as price fails to hold above it, the broader downtrend stays in force.
RSI: 31,26
MACD: Bullish
MA: $86,07
Oil Trading Plan for Today
- Supports: $83.00
- Resistances: $86.50–87.00
- Base scenario: rise toward $86.50–87.00, followed by a reversal lower in the direction of $84.00.
- Alternative scenario: breakout and close above $87.00.
Oil Live Price Today
WTI came under pressure after the API reported a larger-than-expected build in U.S. crude inventories. The surprise addition of nearly 9 million barrels reversed earlier optimism and capped the rebound from $83.00. Traders now await the official EIA confirmation later this week before committing to a clearer direction.
WTI live price now remains sensitive to any follow-through selling or short-covering near the resistance cluster.

On the daily timeframe a corrective bounce that is still safe for bears can extend as far as $88.00. That zone may then become a fresh supply area for a renewed move toward the medium-term target at $76.00.
Oil Price Forecast for Tomorrow
Tomorrow the price will likely be determined by the reaction to the $86.50–87.00 zone.
Will oil go up tomorrow? If a firm hold above $87.00 occurs, the price may rise toward $88.00–89.00.
Oil Price Forecast for This Week
Key data releases this week will drive volatility and could shift the supply-demand narrative.
- 11 Nov: OPEC Monthly Oil Market Report. High – demand, supply, and balance assessment
- 12 Nov, 17:00 UTC: EIA weekly petroleum stocks. High – actual U.S. crude and product inventory changes
- 13 Nov, 09:00 UTC: IEA Monthly Oil Market Report. High – independent global demand, supply and stock evaluation
| Date |
November 9 – November 13, 2026 |
| Minimum | $83,15 |
| Average |
$86,85 |
| Maximum |
$90,52 |
Focus remains on any revision to the expected global surplus/deficit, estimates of Middle Eastern flows, and the trajectory of U.S. inventories. These factors are most likely to alter the current market balance assessment.
Oil Price Forecast for the Next 30 Days
- 11 November — OPEC Monthly Report. Global demand, supply and output assessment
- 12 November — EIA inventories. U.S. supply-demand balance
- 13 November — IEA report. Global oil balance, refining and stocks
- 18 & 25 November — EIA inventories. Ongoing U.S. market dynamics
- 29 November— OPEC+ meeting. Production guidance decisions for 2027
Over the coming month, direction will be driven primarily by developments around Iran and the Strait of Hormuz, followed by actual supply volumes and inventory trends.
The 1 November OPEC+ decision is already priced in; the next major cartel-related risk is the 29 November gathering.
WTI price outlook next month leans lower, with the $75–$80 zone as a realistic WTI price target should geopolitical de-escalation and rising supply risks materialize
Oil Price Analysis and Forecasting Methodology
Our oil forecast methodology combines fundamental analysis of supply-demand balances, OPEC decisions, inventories, and geopolitical risks with technical analysis of price charts, trends, and key levels. We also factor in market sentiment from positioning data and news flow. This multi-layered approach to calculating oil price forecasts delivers balanced, data-driven projections you can rely on.
Is Oil a Good Investment?
Is oil a good investment? With ongoing energy demand, limited supply flexibility, and geopolitical premiums, oil remains a strong portfolio diversifier in 2026. Should I invest in oil? Many investors use it to hedge inflation and capture potential upside. Start your oil investment journey in 2026 today— open an account and begin trading in minutes.
Summary
API data has created short-term downside pressure on WTI, yet the broader EIA outlook still points to relatively tight balances rather than a sustained surplus. Confirmation will come from the official inventories on 12 November and the OPEC and IEA reports that follow. Technical levels at $86.50–87.00 remain the immediate pivot for both the daily and weekly bias.
The trade levels, signals and forecasts in this article are calculated automatically from technical indicators and price history. They are not investment advice or a recommendation to buy or sell any financial instrument. Past performance and forecasts do not guarantee future results. Risk Warning: CFDs are complex financial products traded on margin. Trading CFDs is risky and may not be suitable for all investors. Ensure you understand the risks involved as you may lose all your invested capital.
Crude Oil Price Forecast FAQs
What is the current price of Crude Oil now?
November 12, 2026
$84.74
When Will Oil Prices Drop?
Oil prices may start declining once the $86.50–87.00 resistance rejects buyers. A failed break higher keeps the path open toward $84.00 and, over a longer horizon, the $76.00 target if $88.00 becomes supply.
Will Oil Rise or Fall Next Week?
Next week remains range-bound and event-driven. The OPEC report, EIA inventories (12 Nov) and IEA data (13 Nov) will decide direction. Until then the bias stays neutral-to-soft below $87.00.
How Do We Do Oil Technical Analysis?
We combine chart patterns, support/resistance, moving averages, RSI and MACD with fundamental factors like supply data, inventories and geopolitics. This integrated approach strengthens trend signals and improves forecast accuracy in our oil reviews.
How to Trade Oil Technical Analysis?
Follow the ready technical setups and levels provided in our daily oil reviews. We already combine indicators with fundamental context, so you receive clear entry zones, targets and risk parameters without extra work.
Khaled Kamal is a Market Analyst & Business Development Manager at Investizo with several years of experience in the financial services industry. His areas of focus include forex markets, trading strategies, risk management, copy trading and the practical aspects of financial markets.
Award history
More about awards
2023—2026 - 10 awards archived