
General analysis GBPUSD for 20.10.2021
Current Dynamics
Yesterday the US dollar declined against major currencies, despite rising Treasury yields. At the same time, the U.S. stock market continues to strengthen, shifting investors' interest towards risky assets. In the absence of significant macroeconomic publications, some Fed officials have put additional pressure on the USD. Members of the Open Market Committee are concerned that labor shortages and strong price pressures could continue after the pandemic.
At the same time the UK consumer price index data published today disappointed investors. However, the negative effect was softened as the Governor of the Bank of England had earlier admitted the increase of price pressures and said that the regulator was ready to take measures to contain inflation.
A report on the current economic situation in each of the 12 U.S. federal districts is due today at 20:00 (GMT+2).
Support and resistance levels
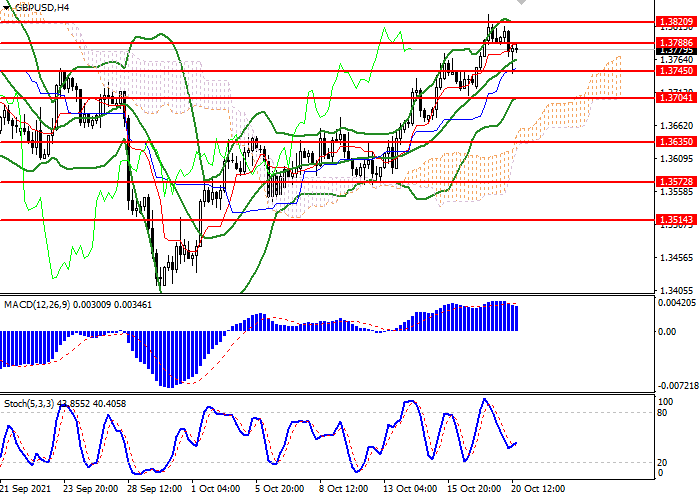
On the 4-hour chart, the instrument is recovering at the top of the Bollinger Bands. The nearest strong resistance level is 1.3790. The indicator has turned sideways and the price range is not significantly shortened, indicating an intraday correction. MACD histogram is holding a strong buy signal. Stochastic is not showing a clear signal to open positions.
- Support levels: 1.3515, 1.3575, 1.3635, 1.3705, 1.3745.
- Resistance levels: 1.3790, 1.3820, 1.3860, 1.3890.
Trading scenarios
- Short positions should be opened at the current price with a target of 1.3705 and a stop-loss at 1.3825. Implementation period: 1-3 days.
- Long positions can be opened above the level of 1.3815 with a target of 1.3880 and a stop-loss at 1.3780. Implementation period: 1-3 days.