
Fundamental analysis of XAUUSD
A quick look at economic developments:
U.S. Unemployment Decline: According to data released by the U.S. Bureau of Labor Statistics, the nation's unemployment rate fell to 3.8 percent in May. Positive labor market trends point to a strengthening U.S. economy. Signs of a general recovery in the U.S. economy are dampening interest in gold as a "safe-haven asset.
Rising U.S. inflation: U.S. inflation continues to rise, reaching 4.2% y/y in April, the highest level since 2008. This may contribute to a rise in gold prices as investors often use precious metals as a hedge against inflation.
Increasing demand for gold in India: Demand for gold in India, the world's second-largest consumer of gold, increased 19.5% in the first quarter of 2023 compared to the same period last year. This may contribute to a moderate increase in gold prices on the world market.
Precious Metals Market Volatility: Despite increased local demand for XAU, the precious metals market continues to be volatile due to uncertainty related to the global economic outlook and U.S. Federal Reserve policy.
The impact of macroeconomic statistics:
Initial Jobless Claims Number (USD): Further growth in the figure will offset positive labor market trends and strengthen the XAU/USD.
Fed's Balance Sheet (USD): The size of the U.S. Federal Reserve's balance sheet could also have an impact on the XAU/USD pair. An increase in the balance sheet could indicate a continuation of the soft monetary policy, which could weaken the dollar and support gold prices.
Technical Analysis and Scenarios:
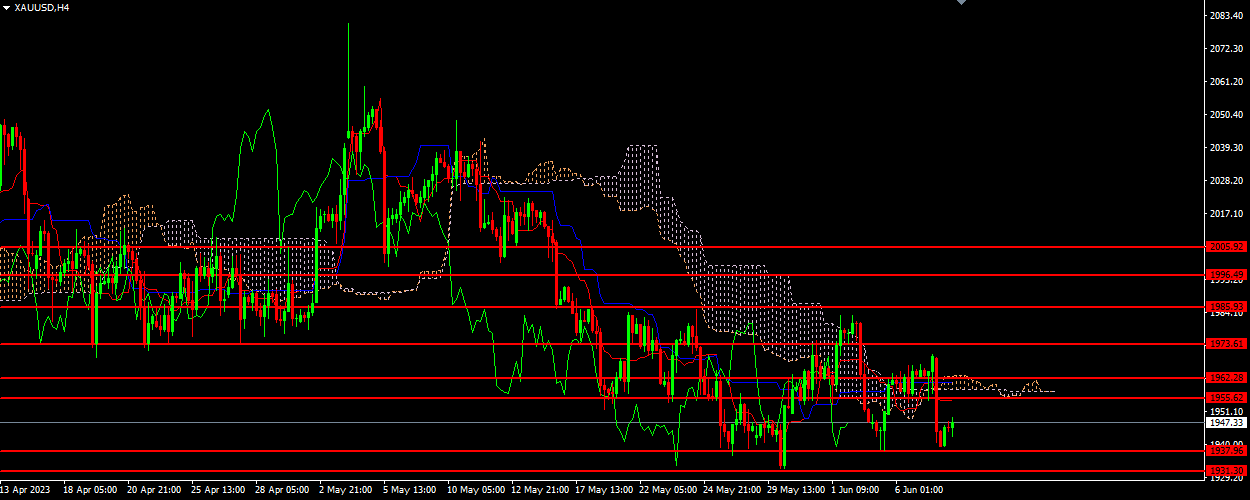
Key levels:
Support levels: 1923.50, 1931.30, 1938.00
Resistance levels: 1955.60, 1962.30, 1973.60, 1985.90, 1996.50, 2005.92
Tenkan-sen and Kijun-sen lines: The Tenkan-sen line (1954.73) is below the Kijun-sen line (1960.74), which might indicate a downtrend. However, both lines are horizontal, which may indicate that there is no strong trend.
Chikou span: Chikou span (1947.70) is below the price chart, which may also indicate a downtrend.
Cloud (Kumo): The boundaries of the cloud have merged, indicating a neutral market condition.
Main scenario: Sell. The current price (1947.70) is below the Kijun-sen line, which may indicate the possibility of further price decrease. In this case, the take profit target may be the level of 1923.50, the stop loss level is 1955.60.
Alternative scenario: Buy. If the price overcomes the resistance level of 1955.60 and consolidates above it, it may indicate an opportunity for price growth. In this case, the resistance level of 1962.30 may become a target for take profit, and the level of 1938.00 may become a stop loss level.