
Fundamental analysis of AUD/USD
AUD/USD has entered a relatively positive phase with the release of important economic data. Australia's trade data for May and global economic data, especially from China, are among the main areas of interest. China's economic data is often unfavorable for Australia because of its close trade relationship. A reduction in Australia's projected trade surplus to A$10.5 trillion from A$11.2 billion could put pressure on the Australian dollar. Further tightening could lead to a devaluation of the currency.
On the other side of the Pacific, the U.S. economic calendar is full of data releases that could affect the AUD/USD pair. Particularly significant will be the changes in the U.S. non-farm PMI and ISM indices. A strong surge in service sector activity combined with higher than expected non-farm payroll growth could strengthen the Fed's hawkish stance. However, investors should not rely on the overall PMI, but rather pay attention to factors such as prices and employment. In addition, the Federal Open Market Committee (FOMC) said it will not raise the benchmark interest rate too quickly.
The Aussie found support at 0.66220, helped by a slight decline in the Dollar Index (DXY) after hitting a 4-day high at 103.40. However, the Aussie dollar struggled to gain ground despite an unexpectedly strong trade balance in commodities, which reached A$11.8 million on an annualized basis. In addition, the Reserve Bank of Australia (RBA) kept its benchmark rate at 4.1%. RBA Governor Philip Lowe opted to leave monetary policy unchanged as the Consumer Price Index (CPI) fell significantly to 5.6% from the previous value of 6.8%.
To sum it up, AUD/USD movement is determined by many factors, including trade balance, economic data and central bank decisions. Currency pairs are likely to continue to fluctuate as traders absorb more global economic data and central bank signals.
Technical analysis and scenarios:
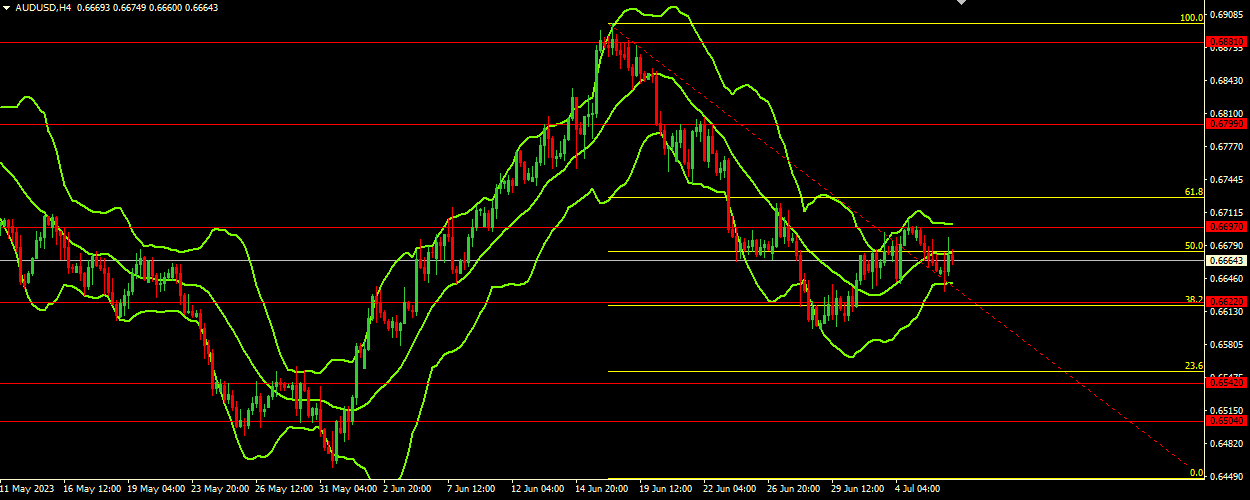
The AUD/USD pair is currently trading around the 0.6640 support level. The Bollinger Bands indicate that the price is moving horizontally in a wide range, but it is declining within the lower range of the indicator. The lower Bollinger Bands band is near the key support level of 0.66220.
Main scenario (BUY)
Recommended entry level: 0.66800.
Take profit: 0.67990.
Stop loss: 0.66400.
Alternative scenario (SELL)
Recommended entry level: 0.66200.
Take profit: 0.65420.
Stop loss: 0.66500.