
GBP/USD Fundamental Analysis
The GBP/USD currency pair continues to decline for two consecutive days and is trading at 1.27950.
The US Dollar strengthened after rebounding on Thursday from a weekly low to the highest since July 10. This growth is seen as a major source of pressure on the US Dollar and the GBP/USD pair. Encouraging macroeconomic unemployment data released on Thursday in the US indicates that the US economy is particularly strong and raises the likelihood of further rate hikes by the Federal Reserve. The U.S. Commerce Department reported that the world's largest economy grew at an annualized rate of 2.4% in the second quarter, exceeding forecasts. In addition, initial jobless claims unexpectedly fell to 221,000 for the week ended July 22. Fed Chairman Jerome Powell has not ruled out raising interest rates by 25 basis points in September or November as the economy must slow and the labor market must weaken for inflation to return to the 2% target. This economic outlook supports the possibility of higher U.S. Treasury yields, with the 10-year U.S. Treasury yield climbing above 4.0%. This, combined with moderately bearish sentiment on global risks, reinforces the relative safe-haven status of the US Dollar and reinforces the downward bias in GBP/USD.
The prospect of a significant rate hike by the Bank of England is unlikely, especially after the release of weaker UK consumer inflation data last week. Friday is a quiet session on the UK economic calendar, with no economic indicators affecting the UK. The lack of economic data will allow monetary policy divergence to set the direction ahead of the US session. This suggests that the path of least resistance for GBP/USD lies to the downside.
Market watchers are now looking ahead to the release of the US Core Price Index, the Federal Reserve's preferred measure of inflation, to provide direction in early North American trading and personal spending data. A warmer than expected core price index and personal spending data should spur a more hawkish view of Fed policy.
Technical analysis and scenarios:
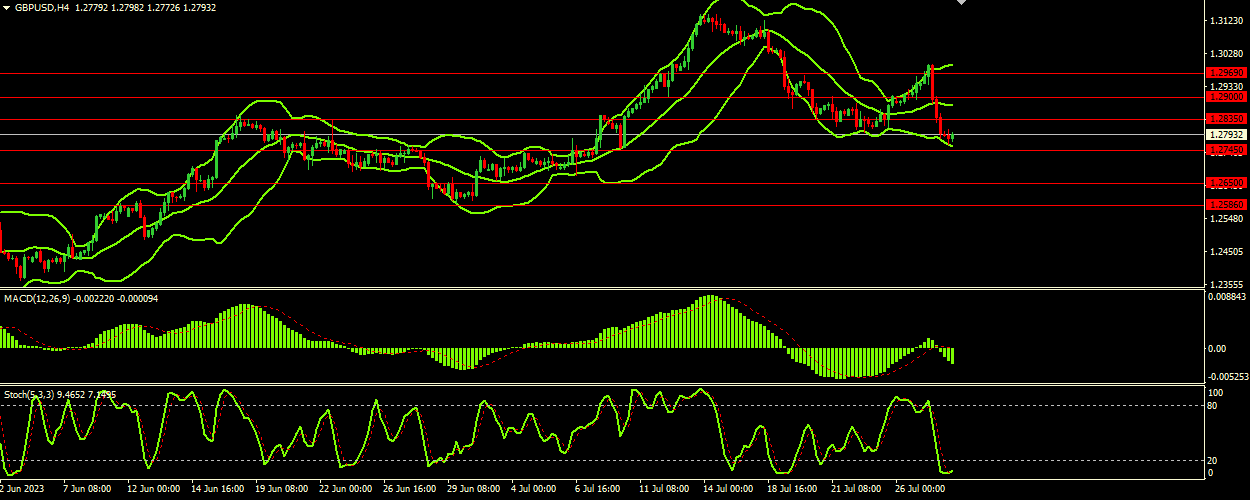
The GBP/USD pair is currently trading at 1.277950, having gained some resilience after the recent decline. The currency pair is in the lower range of the Bollinger Bands: the middle band is located at 1.28790, while the lower band provides support at 1.27540. The upper band is located at 1.29980, marking a resistance level that needs to be overcome. The Bollinger Bands indicator is moving horizontally, indicating that the market is range bound and the price range is widening, implying increased volatility. The Stochastic (5,3,3) oscillator, indicating that the market is oversold or overbought, is at 9.8753, below the signal line at 7.7852. This may indicate that the pair is oversold and some bullish movement is possible in the near term. MACD (12,26,9), a trend following momentum indicator, has a value of -0.002201, below the signal line at -0.000092, indicating bearish momentum in the short term.
Main scenario (SELL)
Recommended entry level: 1.27450.
Take Profit: 1.26500.
Stop Loss: 1.27950.
Alternative scenario (BUY)
Recommended entry level: 1.28350.
Take Profit: 1.29000.
Stop loss: 1.27950.