
Fundamental analysis of EUR/USD
The EUR/USD pair demonstrated a bearish trend and is trading at 1.08800.
The main events determining the dynamics of the pair are the release of economic data on the eurozone and indicators of the US monetary policy. Preliminary data on eurozone GDP growth in the second quarter amounted to 0.3%, which coincided with market expectations. At the same time, industrial production in June increased by 0.5% against an expected decline of 0.1%. However, these positive developments in the Eurozone failed to support the Euro against competing currencies due to weak prospects for economic growth and inflation. Despite the expected increase in the Eurozone trade balance from a deficit of €0.3 billion to a surplus of €18.3 billion, any fall in exports could put the pair under pressure. The growing role of the services sector in the European economy also reduces the impact of trade data on EUR/USD dynamics. In addition, investors are keeping a close eye on any comments from the ECB.
Meanwhile, the US economy gave strong signals: industrial production in July grew by 1.0%, exceeding market expectations of 0.3%. Housing data was also strong, with housing starts and building permits exceeding previous forecasts and figures. US inflation remains a major concern, with FOMC meeting minutes pointing to persistently high levels and associated risks. The Federal Reserve is considering additional policy tightening measures to better manage inflation. Their approach will be largely data-driven, with releases such as the US initial weekly jobless claims and the Philadelphia Fed's manufacturing sector business activity index coming soon.
In conclusion, both regions have busy economic calendars and the interplay of these data is likely to determine the trajectory of EUR/USD in the coming days.
Technical analysis and scenarios:
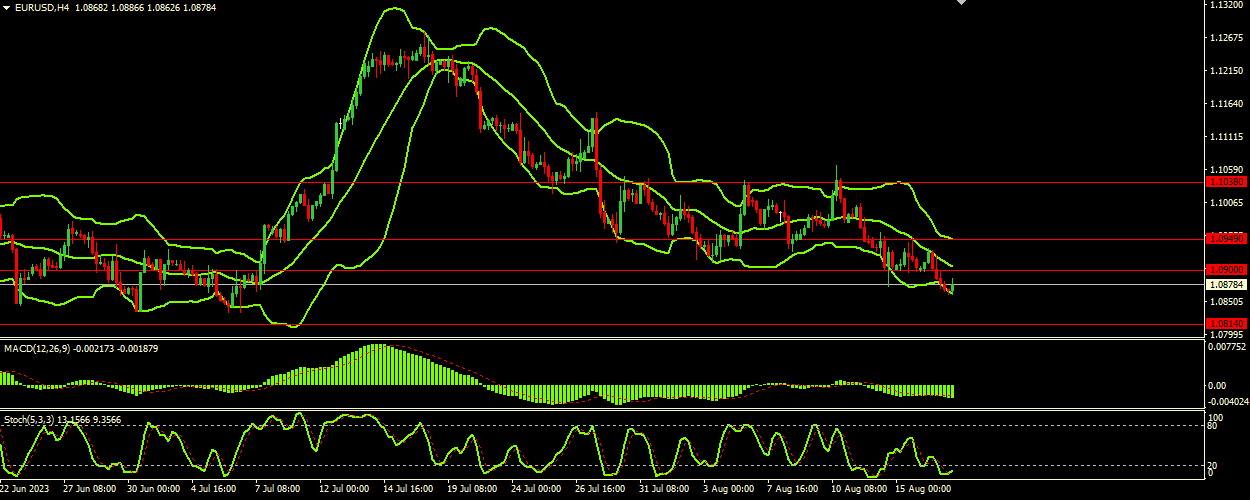
Price is near the lower end of the range, indicating a bearish bias. However, as it is approaching the middle band (1.09070), some upward momentum is possible in the short term. The narrowing of the range indicates a decrease in volatility and possible significant price movement in the near term. Stochastic Oscillator: the value at 14.4572 is below the usual oversold threshold of 20. This suggests that the asset may be oversold and a reversal may be on the horizon. The signal at 9.7901 confirms this assumption. The MACD value below the signal indicates a bearish trend. Although the difference is small, it indicates the possibility of the price continuing the current downward trajectory.
With the Stochastic Oscillator indicating a potential oversold condition and price approaching the middle Bollinger Band, we could see a short-term bullish move. If the price breaks below the lower Bollinger Band and the current support level of 1.08140, it would indicate a continuation of the bearish movement.
Main scenario (BUY)
Recommended entry level: 1.09000.
Take Profit: 1.09490.
Stop Loss: 1.08800.
Alternative scenario (SELL)
Recommended entry level: 1.08140.
Take profit: 1.07260.
Stop loss: 1.08450.