
Fundamental analysis of USD/CAD
The USD/CAD pair retreated from its intraday zenith, breaking a three-day losing streak. The U.S. dollar is in consolidation after its biggest daily loss in five weeks, and oil prices are on a downward trajectory despite positive news coming out of the Middle East. The market's reassessment of the Federal Reserve's stance, combined with fears of a global recession, had an impact on the pair. Paul Beaudry, deputy governor of the Bank of Canada (BoC), defended the recent rate hike, but also said the future remains uncertain.
Canada's upcoming labor force survey is expected to show a slight increase in the unemployment rate to 5.1% in May, up from 5% in April. Earlier this week, the Bank of Canada unexpectedly raised its benchmark rate by 25 basis points to 4.75%, and the upcoming labor market data could affect the trajectory of the Canadian dollar against its peers. Stronger-than-expected job growth and wage inflation could strengthen the Canadian dollar, while a weak jobs report could attract dovish rates.
The Bank of Canada noted that growing concerns that consumer price index (CPI) inflation could well exceed the 2% target were the main reason for the decision to raise the benchmark rate. Unless there is a significant downturn in the jobs market, the Bank of Canada will need to continue its focus on containing inflation, which could lead to another rate hike in July.
The CAD reaction to the employment data should be unequivocal because of the potential impact on the Bank of Canada's rate forecast. A stronger-than-expected rise in the employment change figure combined with stagnant wage inflation could give the CAD a boost and cause the USD/CAD rate to fall, and vice versa.
According to Beaudry, the continued strength in the economy suggests that a longer interest rate hike may be necessary to contain inflation. Economic data following the central bank's decision in April, when rates were held up, has shifted the balance and prompted the Governing Council to decide to raise rates by a quarter point in June.
Technical analysis and scenarios:
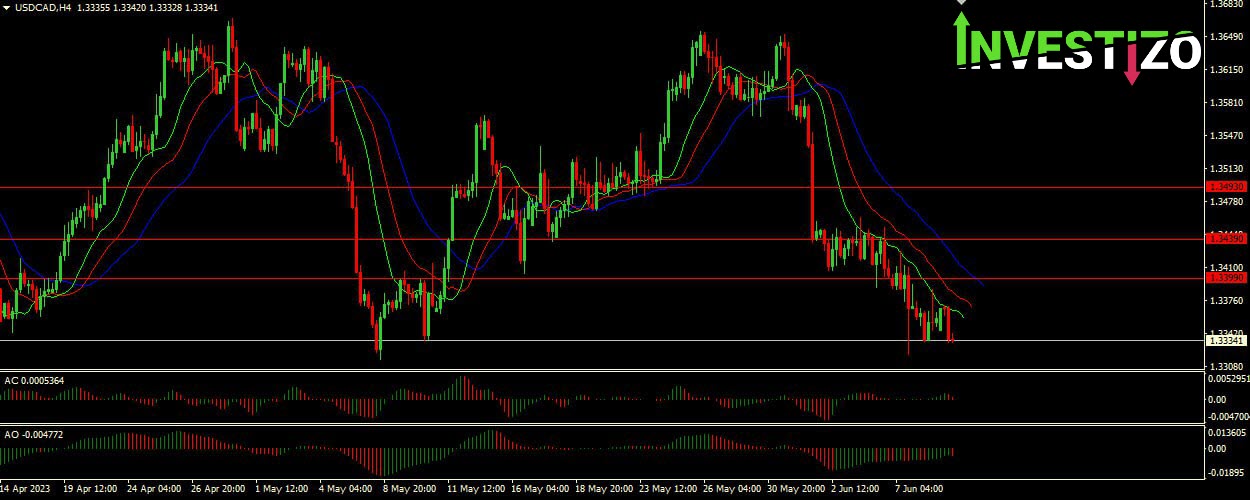
Support levels: 1.32130, 1.32800, 1.32920;
Resistance levels: 1.34930, 1.34390, 1.33990.
Indicators: Alligator is hungry: its mouth is wide open, its jaw (blue line) hovers high above its lips and teeth (green and red lines), the instrument is in a downtrend. Awesome Oscillator (AO) and Accelerator Oscillator (AC) are in the gray zone, showing divergence, which is not a reliable signal to open a position.
The main scenario is a continuation of the bearish trend:
The Alligator indicator indicates that the market is in a downtrend and the AO and AC oscillators show divergence, which may indicate a potential continuation of a bearish trend.
A selling opportunity may arise at the first resistance level of 1.33990. Take profit levels can be set at support levels 1.32920, 1.32800 and 1.32130 respectively. Stop loss can be placed above the highest resistance level of 1.34930.
An alternative scenario is a bullish reversal:
A buying opportunity may arise when the highest resistance level of 1.34930 is broken. Take Profit levels could be set at the extension of the current price range, potentially at 1.35930 and 1.36930. A stop loss could be placed below the lowest support level of 1.32130 to limit potential losses if the market does not move as expected.