
Brent H1: The Ichimoku Forecast for the American Session on 6.1.2025
06.01.2025 16:01
Teknikal
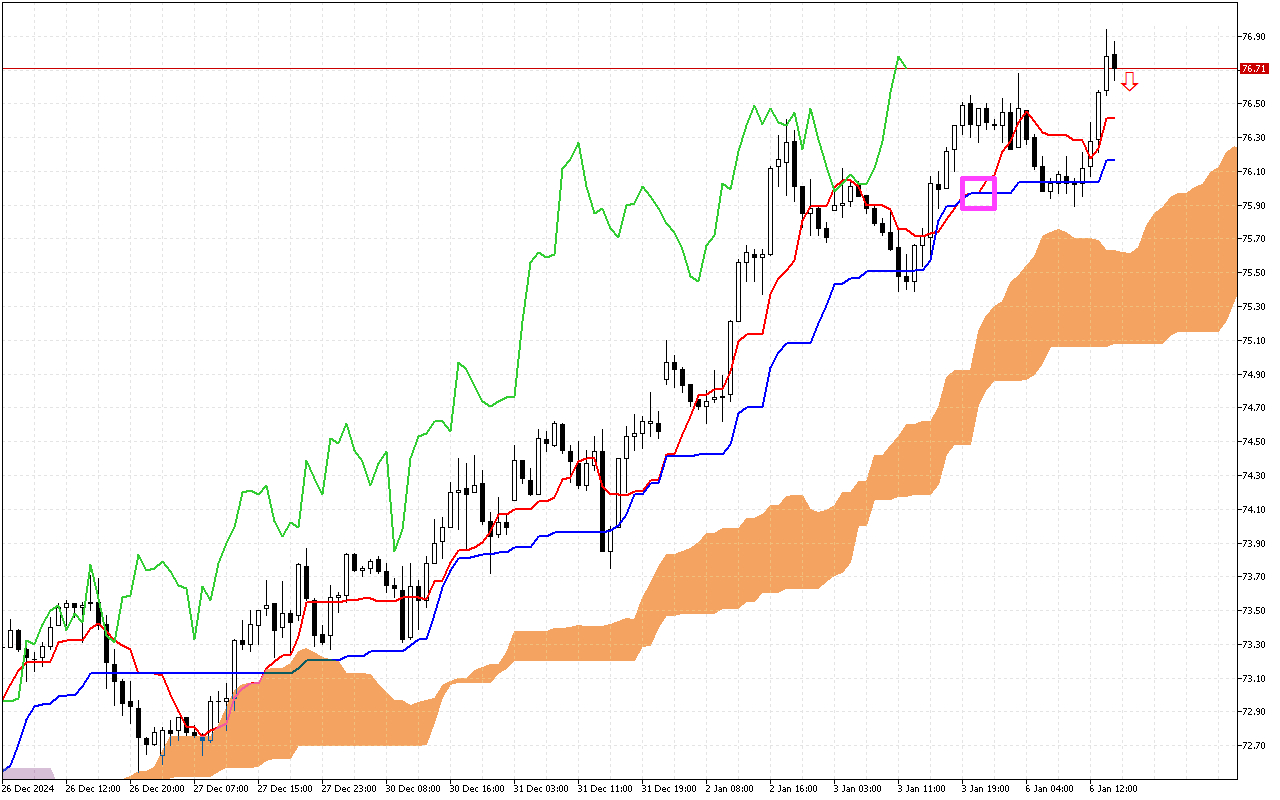
One of the main signals of previous trading sessions was the intersection of the Tenkan and Kijun llines, This area is marked with a pink square on the graph. The rise of the Tenkan line above the Kijun line is a positive signal, which may indicate a possible change in the trend to an upward one.
The current situation:
Let's look at the main components of the indicator and their current values:
The so-called Three Line Signal is being observed on the Brent chart now. The price is above the red Tenkan line, the blue Kijun line, and the Kumo cloud. This signal indicates the predominance of an upward movement.
The Kumo cloud is colored orange, indicating the market tendency to a continuing upward movement.
In addition, the price is above the Kumo cloud, which acts as a potential support zone.
Trading recommendations:
Dynamic support levels are on the Tenkan line, around the 76.41 mark, the Kijun line, around the 76.16 mark, the SenkouA line, at the 75.63mark, and the SenkouB line, around the 75.06 mark.
The Ichimoku indicator signals show a predominance of the market positive sentiment, so within the day the preference should be given to the search for long positions entry points from the support levels indicated above.
The current situation:
Let's look at the main components of the indicator and their current values:
The so-called Three Line Signal is being observed on the Brent chart now. The price is above the red Tenkan line, the blue Kijun line, and the Kumo cloud. This signal indicates the predominance of an upward movement.
The Kumo cloud is colored orange, indicating the market tendency to a continuing upward movement.
In addition, the price is above the Kumo cloud, which acts as a potential support zone.
Trading recommendations:
Dynamic support levels are on the Tenkan line, around the 76.41 mark, the Kijun line, around the 76.16 mark, the SenkouA line, at the 75.63mark, and the SenkouB line, around the 75.06 mark.
The Ichimoku indicator signals show a predominance of the market positive sentiment, so within the day the preference should be given to the search for long positions entry points from the support levels indicated above.