
Technical analysis USDCHF for 24.08.2023
The Tenkan-sen line is located below the Kijun-sen line. Red is directed upwards, while blue remains horizontal. Confirmatory line Chikou Span is above the price chart
The Tenkan-sen line is located below the Kijun-sen line. Red is directed upwards, while blue remains horizontal. Confirmatory line Chikou Span is above the price chart. In this case, the cloud is ascending. Instrument is trading below the Tenkan-se and Kijun-sen lines. The closest resistance is the level 0.88350. The closest support is the level 0.87940
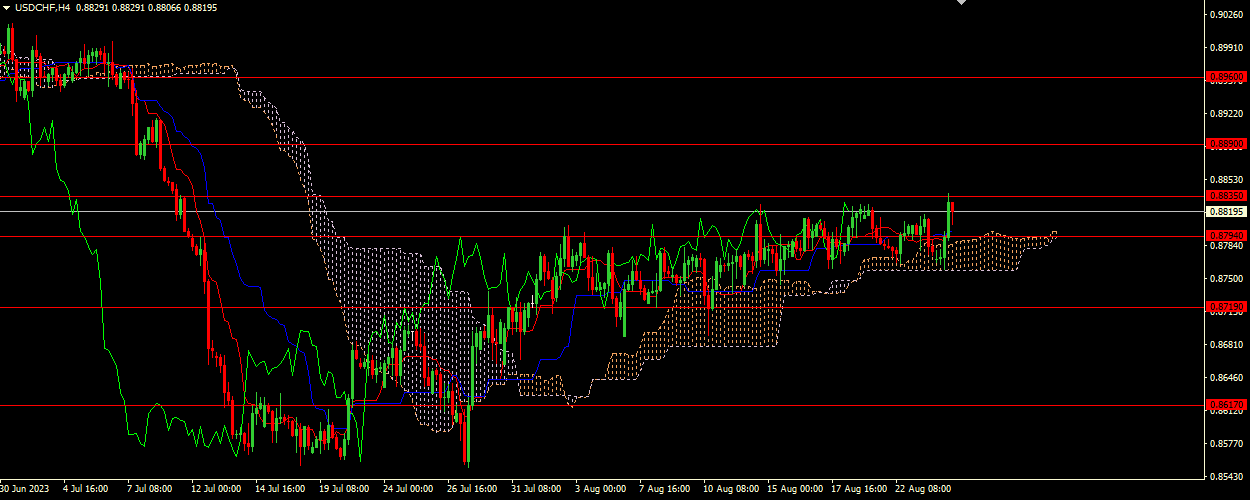
Key levels
- 0.89600, 0.88900, 0.88350, 0.87940, 0.87190, 0.86170
Trading scenario
- Recommended opening long positions (Buy Stop) from the level of 0.88350, with Take Profit of 0.88900 and Stop Loss of 0.88150
Alternative scenario
- Recommended opening short positions (Sell Stop) from the level of 0.87940, with Take Profit of 0.87190 and Stop Loss of 0.88150

Nikolai Krishtopov es analista de mercado en Investizo, con más de 15 años de experiencia en el sector de los mercados financieros y más de una década de experiencia operando. Sus áreas de interés incluyen los mercados de forex y criptomonedas, el análisis técnico, el trading intradía y el comportamiento del mercado.