USDCAD H1: The Chaos Theory Forecast for the American Session on 18.12.2024
18.12.2024 15:46
Técnico
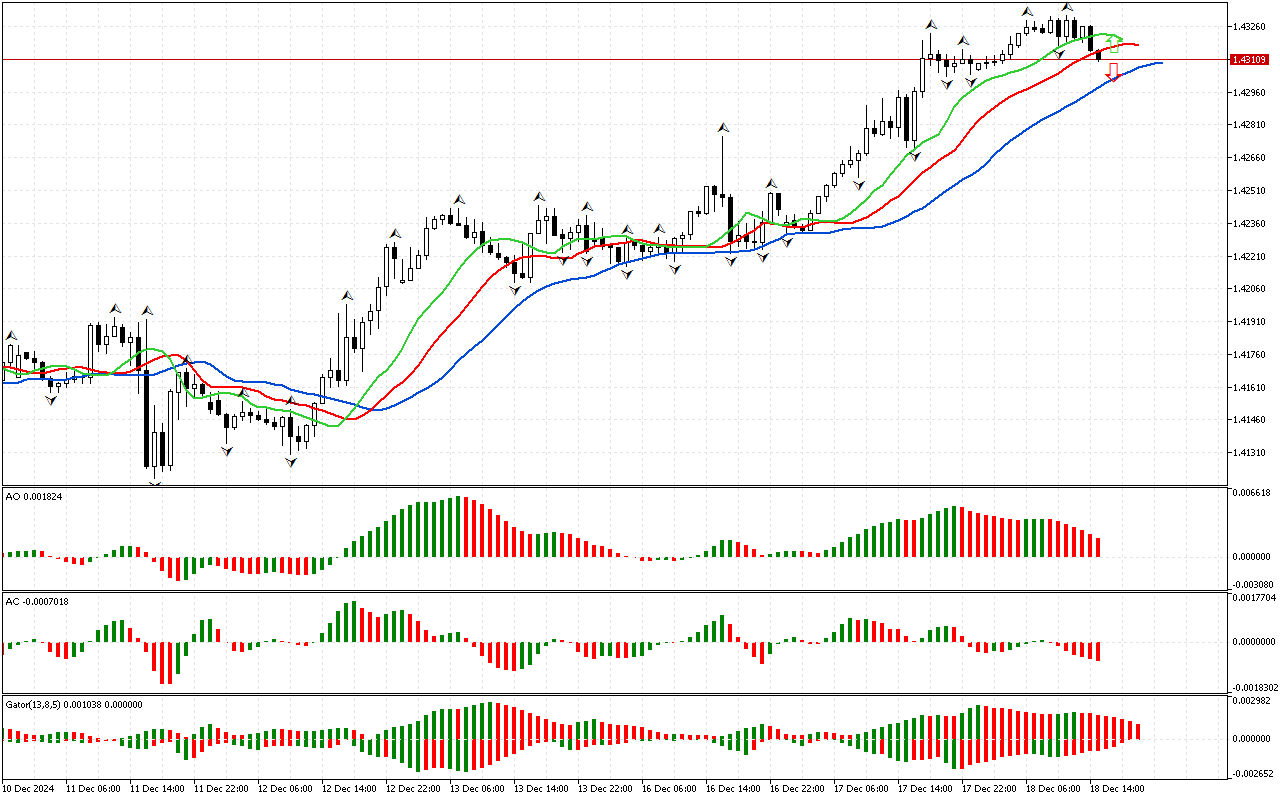
The analysis of the USDCAD graph shows that the phase space is undefined. The price is between two fractals that can be used to determine the state of the market. According to Bill Williams' Chaos Theory, attention should be paid only to fractals that are outside the Alligator's mouth boundaries. Therefore, to determine the further prevalent direction of price movement, it is worth waiting for the price to cross the fractal.
The Alligator's lines are laid in northern direction and the Alligator's mouth is open. This means that first of all attention should be paid to the appearance of the upper fractals. A rising of the price above such a fractal will be a signal, defining the market phase as northern.
At the same time, the Awesome Oscillator histogram is currently above the zero line.
The color of the histograms of the Gator indicator changes, so this indicator has not formed a clear signal yet.
Several red columns have been formed on the Gator indicator. This is a signal that may indicate the development of a corrective movement in the near future.
Let's summarize. The phase space is not defined. Therefore, it is worth ignoring the signals of other indicators for now and waiting for the breakdown of one of the fractals. This is a predictive event that will help determine the market phase and the priority direction of price movement.
📊 Buy Stop 1.43311
❌ Stop Loss 1.43091
✔️ Sell Stop 1.42310
❌ Stop Loss 1.42329
After entering the market, Stop Loss is moved along the red line after the closing of each candle. The profit is fixed by moving Stop Loss, or when impulse weakening signals appear on the AO, AC, Gator indicators.