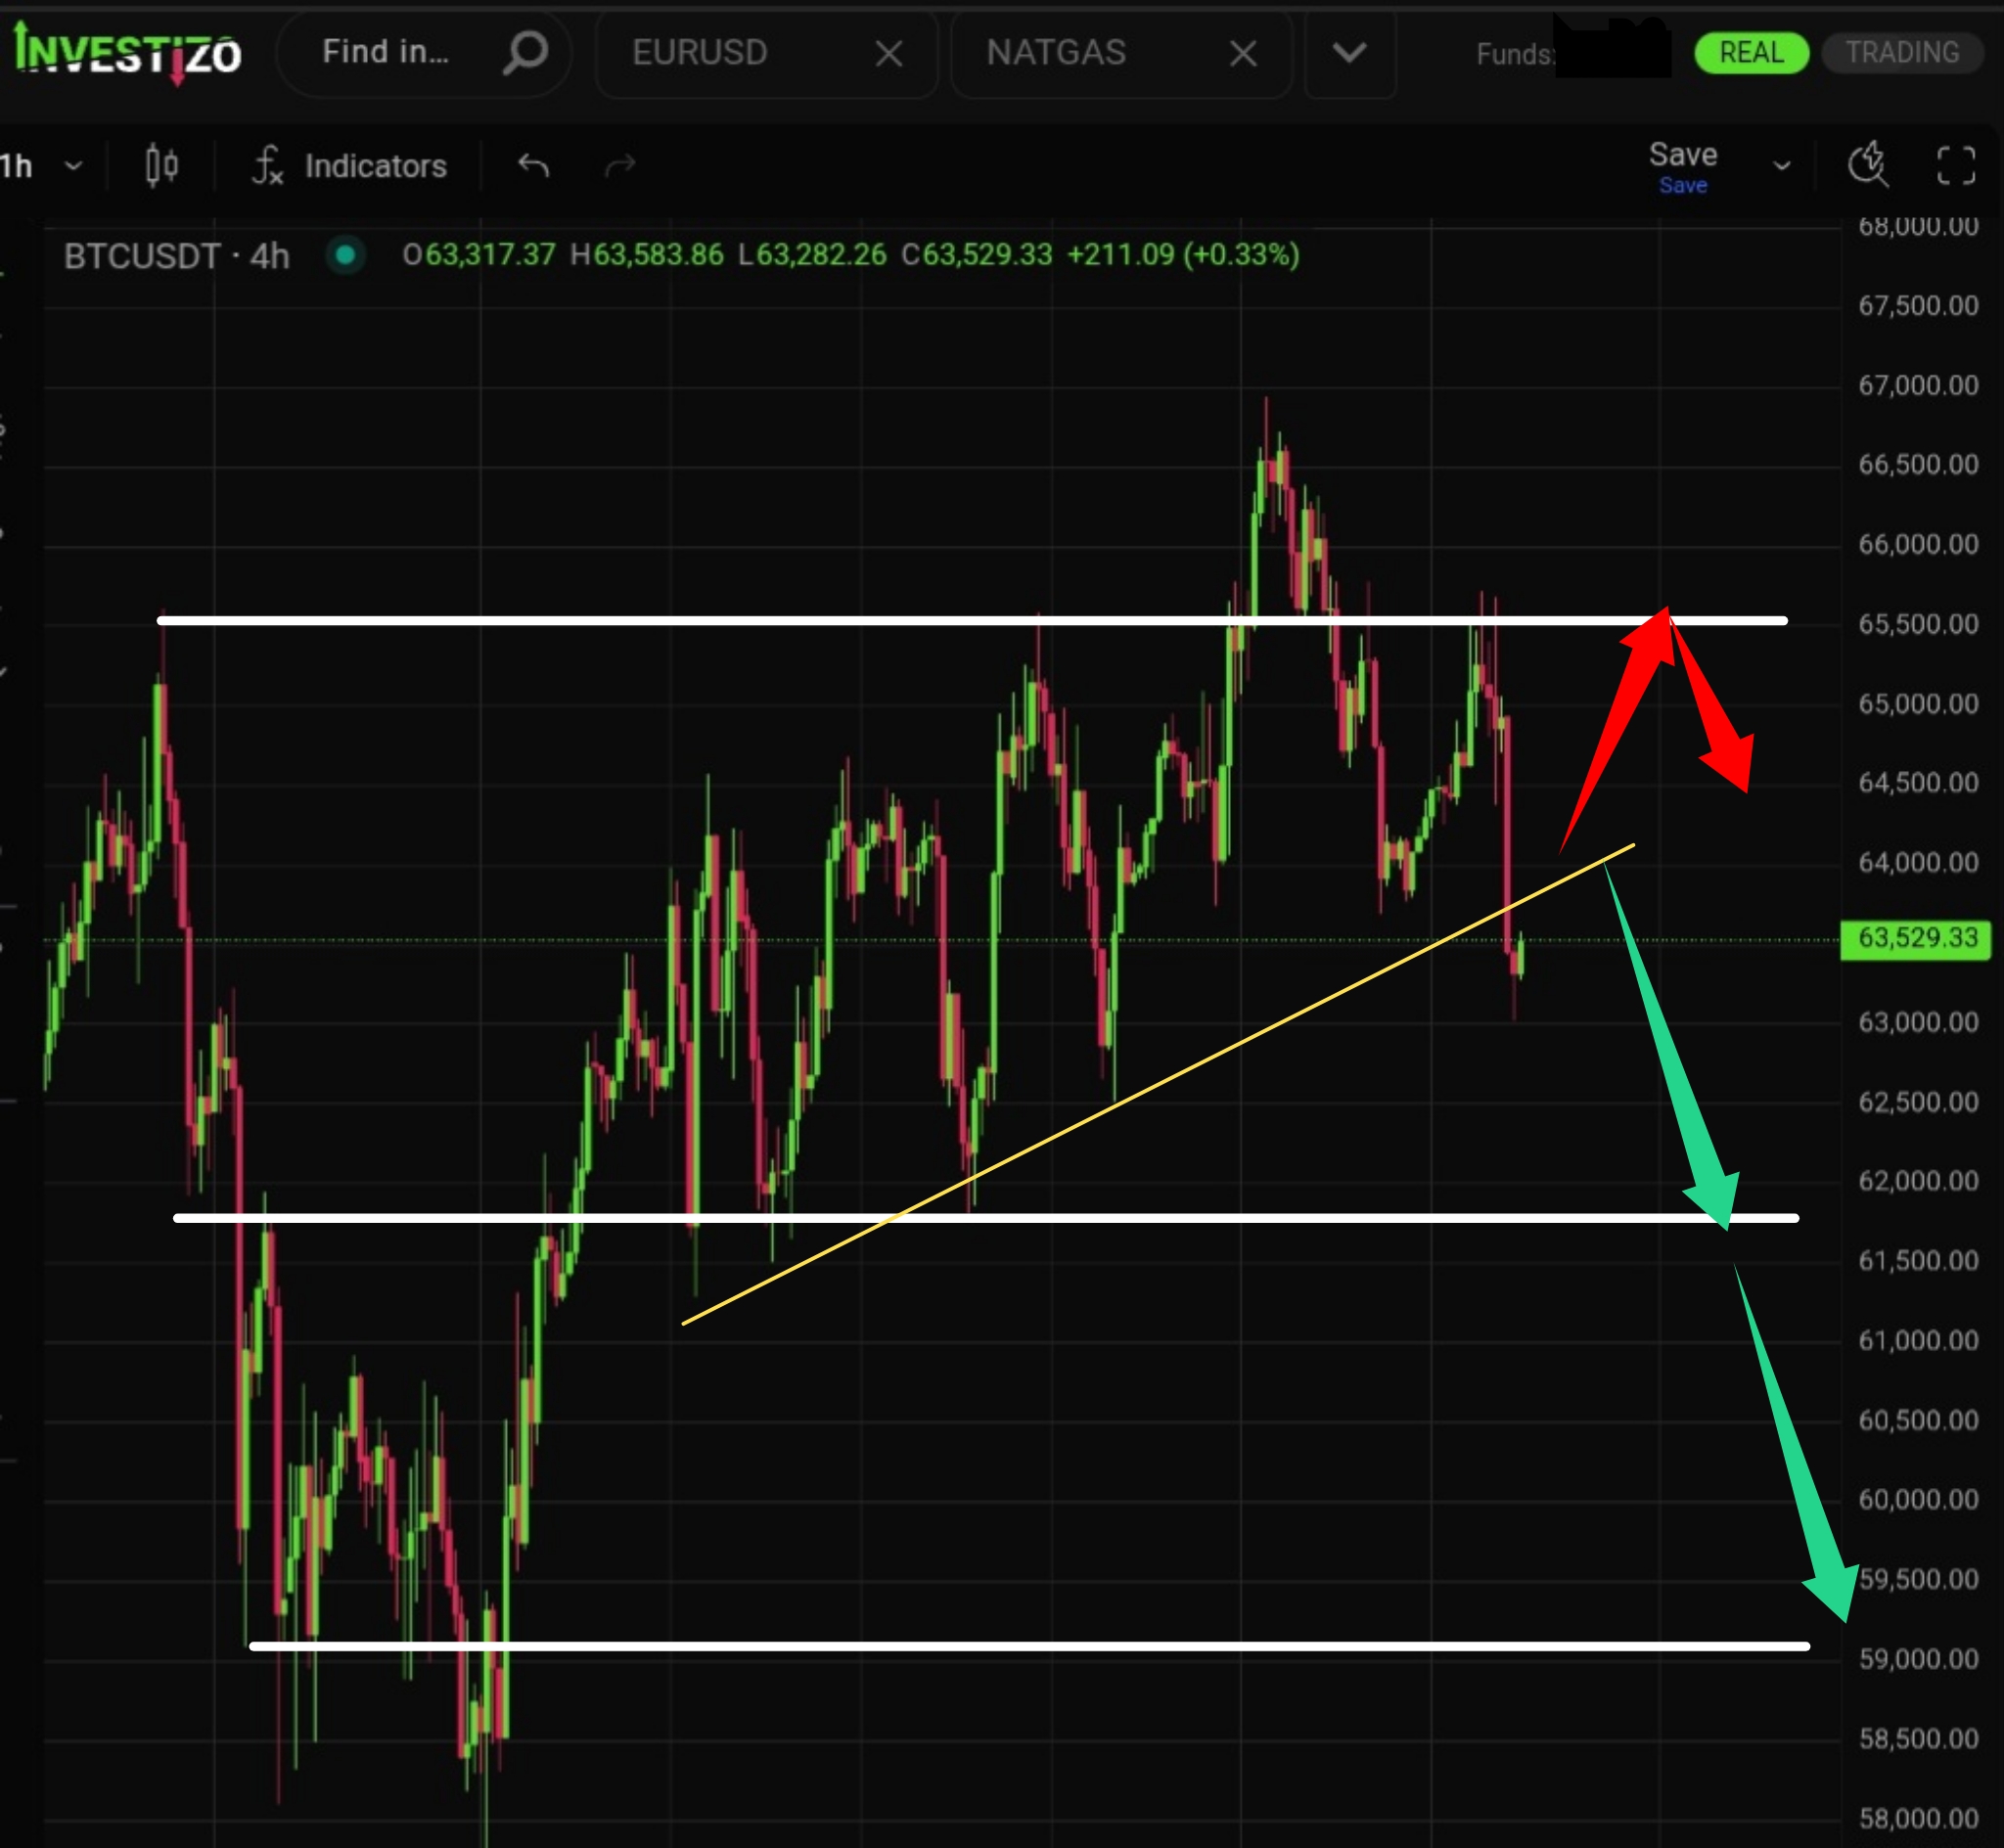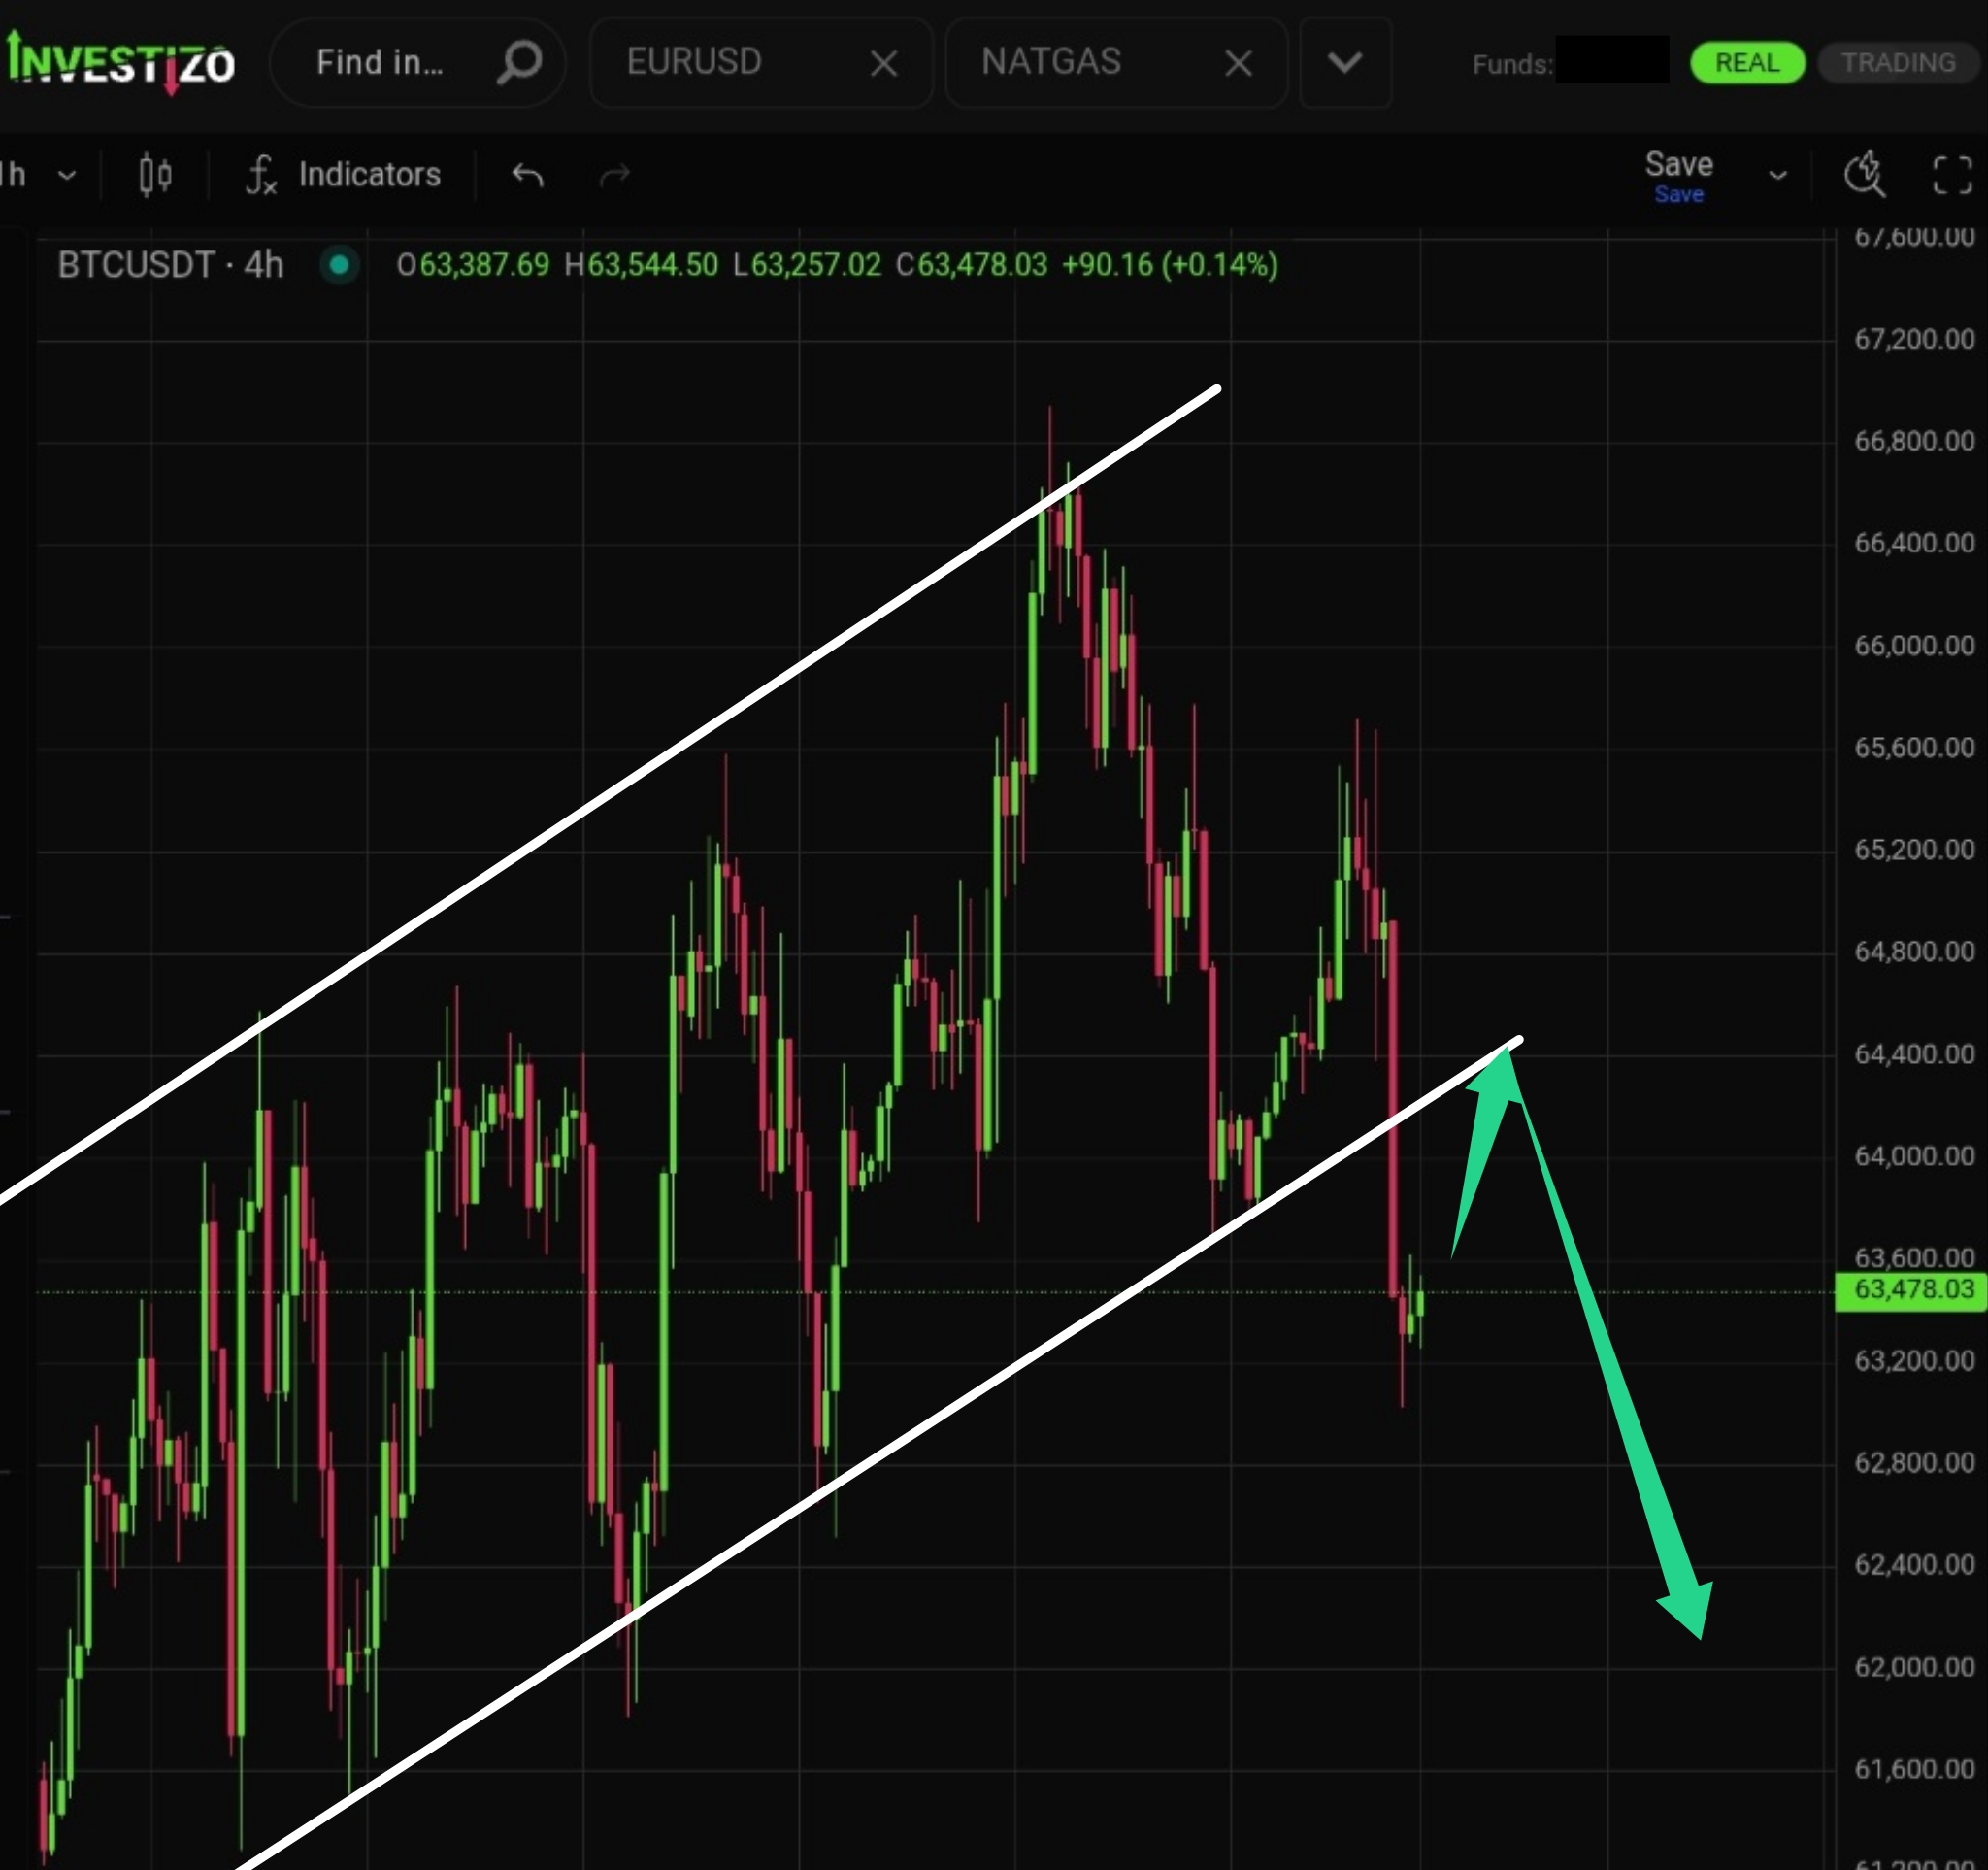
Bitcoin, Technical Analysis – H4
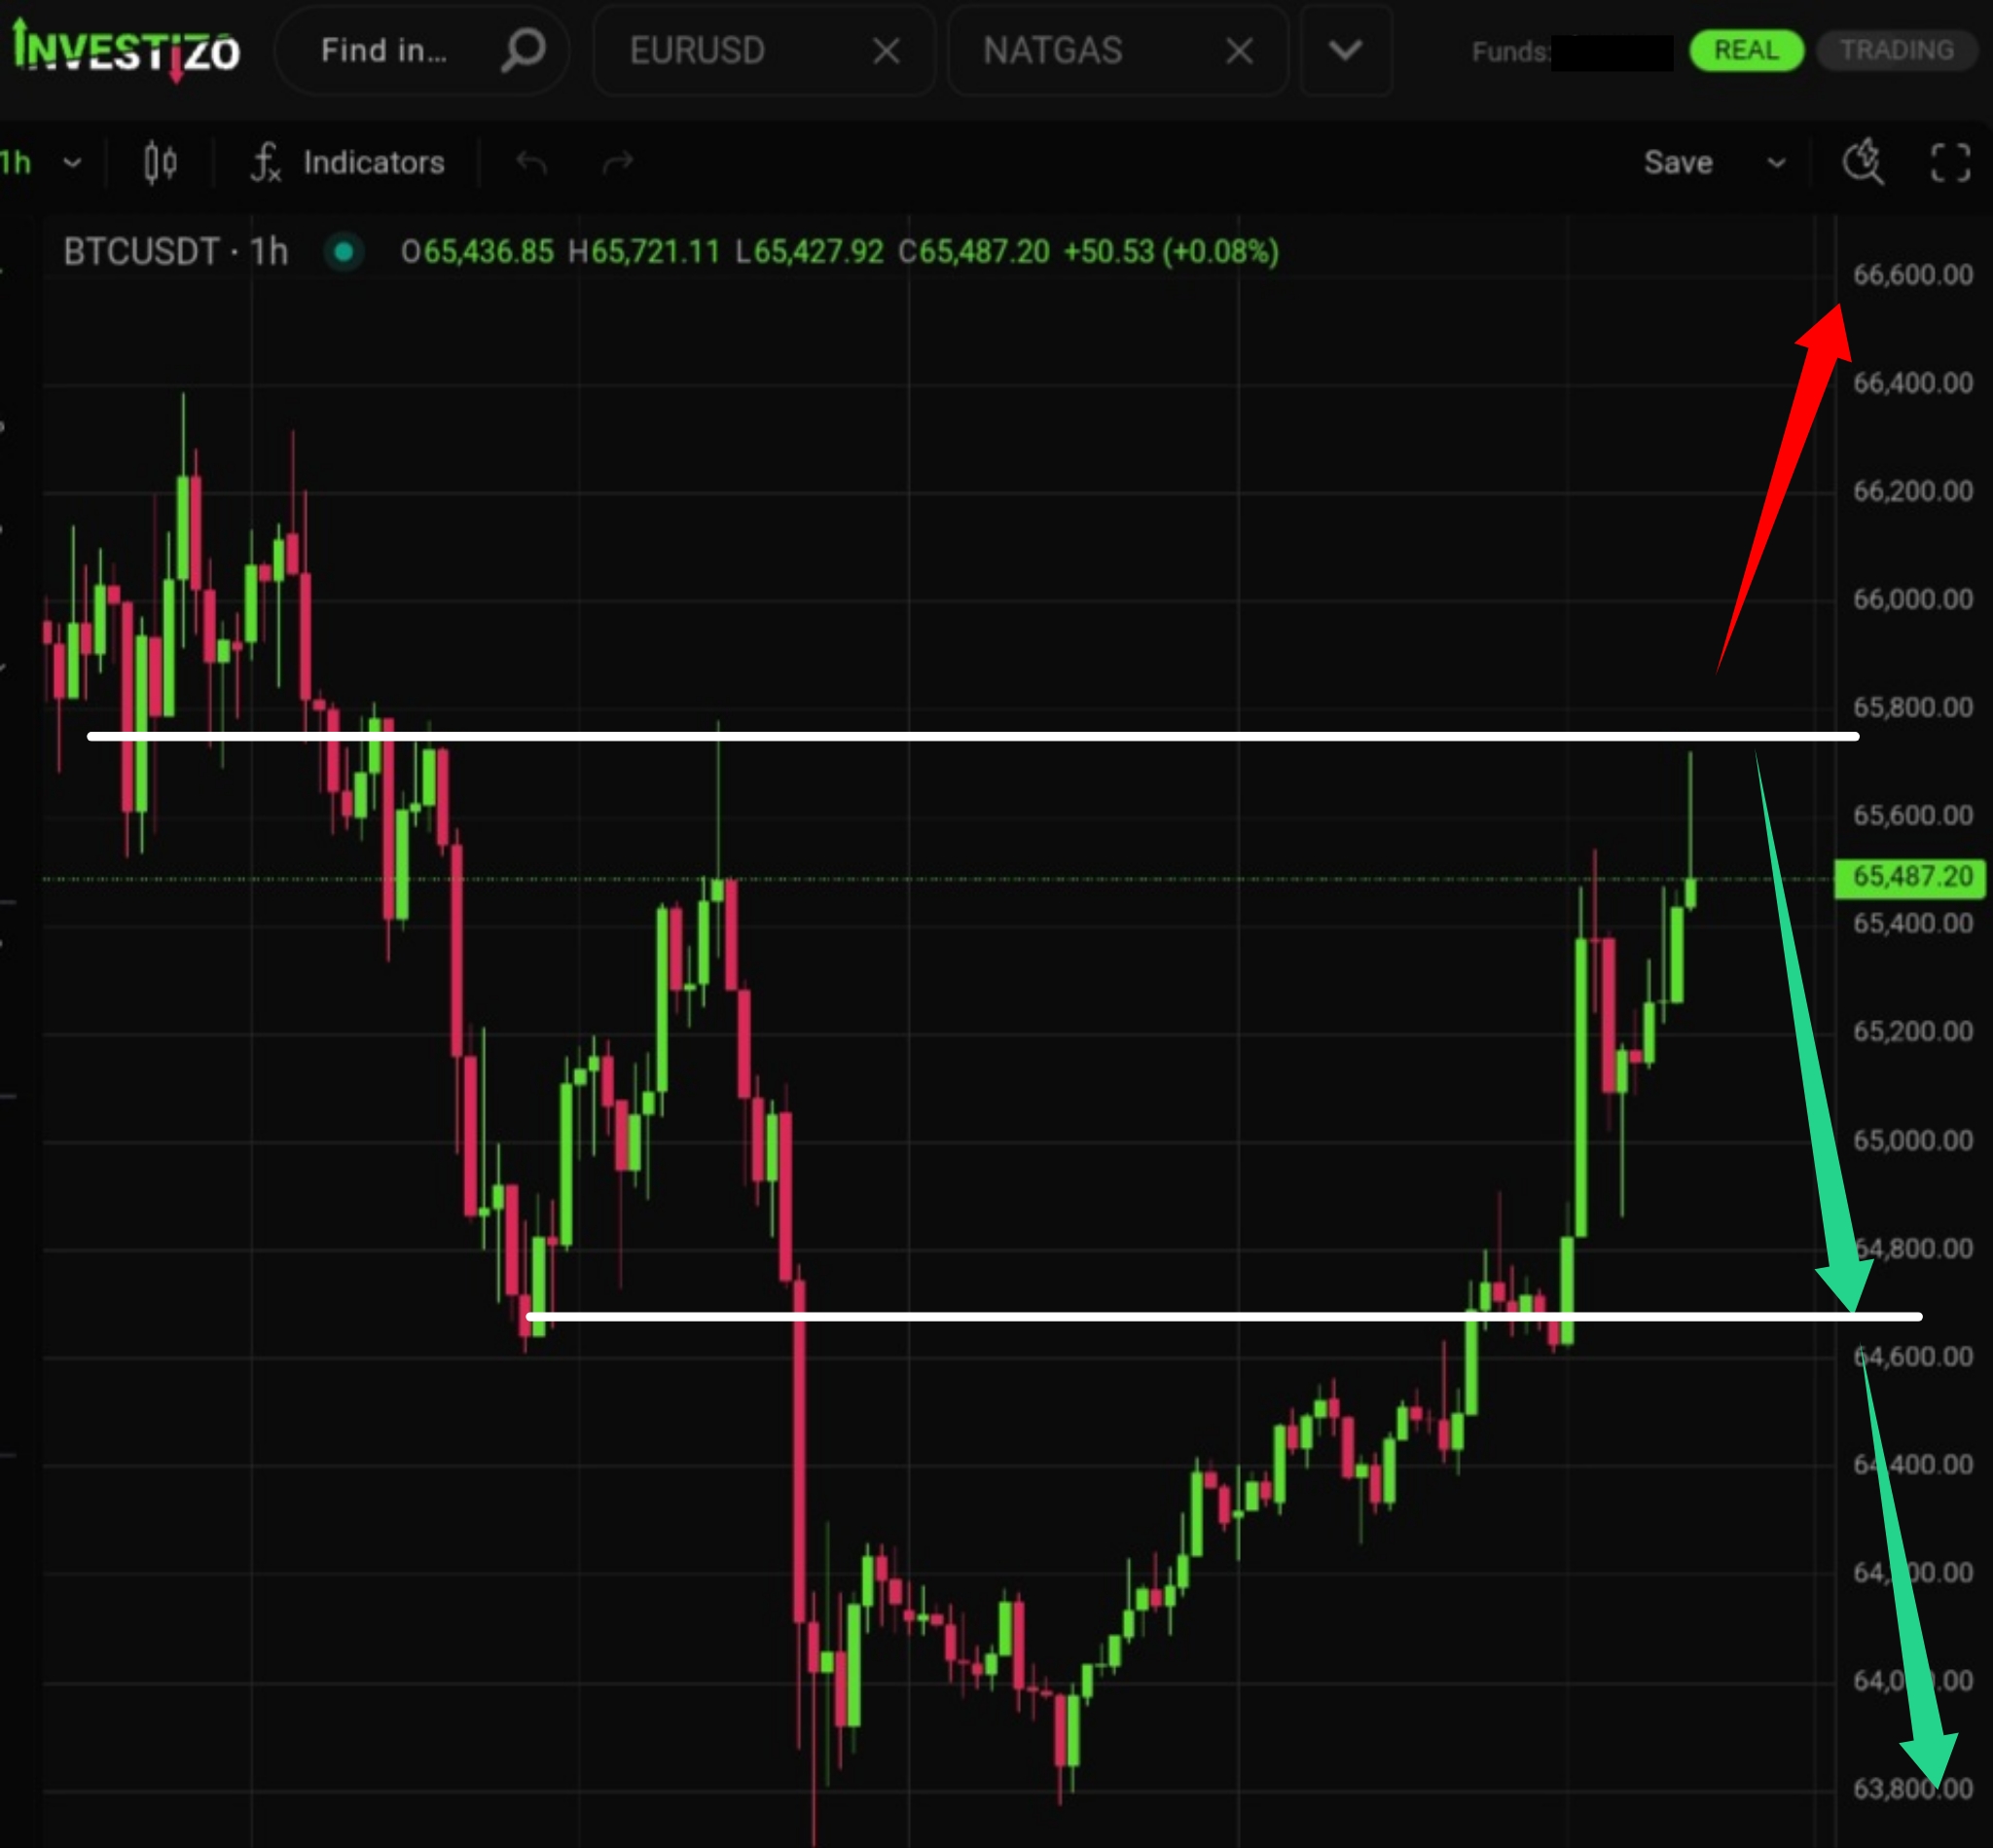
Bitcoin has exited its medium-term ascending channel and, after a possible retest of the $64,400 area, is expected to decline toward $62,000.
Investizo LTD. Business company number 25432 BC 2019
Suite 305, Griffith Corporate Centre,
P.O. Box 1510, Beachmont, Kingstown,
St. Vincent and the Grenadines
DUNS 817053497
Phone:+996312610515
E-mail: [email protected]
© 2019-2026 Investizo 18+ Todos los derechos reservados
Advertencia de riesgo: los CFD son productos financieros complejos que se negocian con margen. El comercio de CFD es arriesgado y puede no ser adecuado para todos los inversores. Asegúrese de comprender los riesgos involucrados, ya que puede perder todo su capital invertido.
Bitcoin has exited its medium-term ascending channel and, after a possible retest of the $64,400 area, is expected to decline toward $62,000.
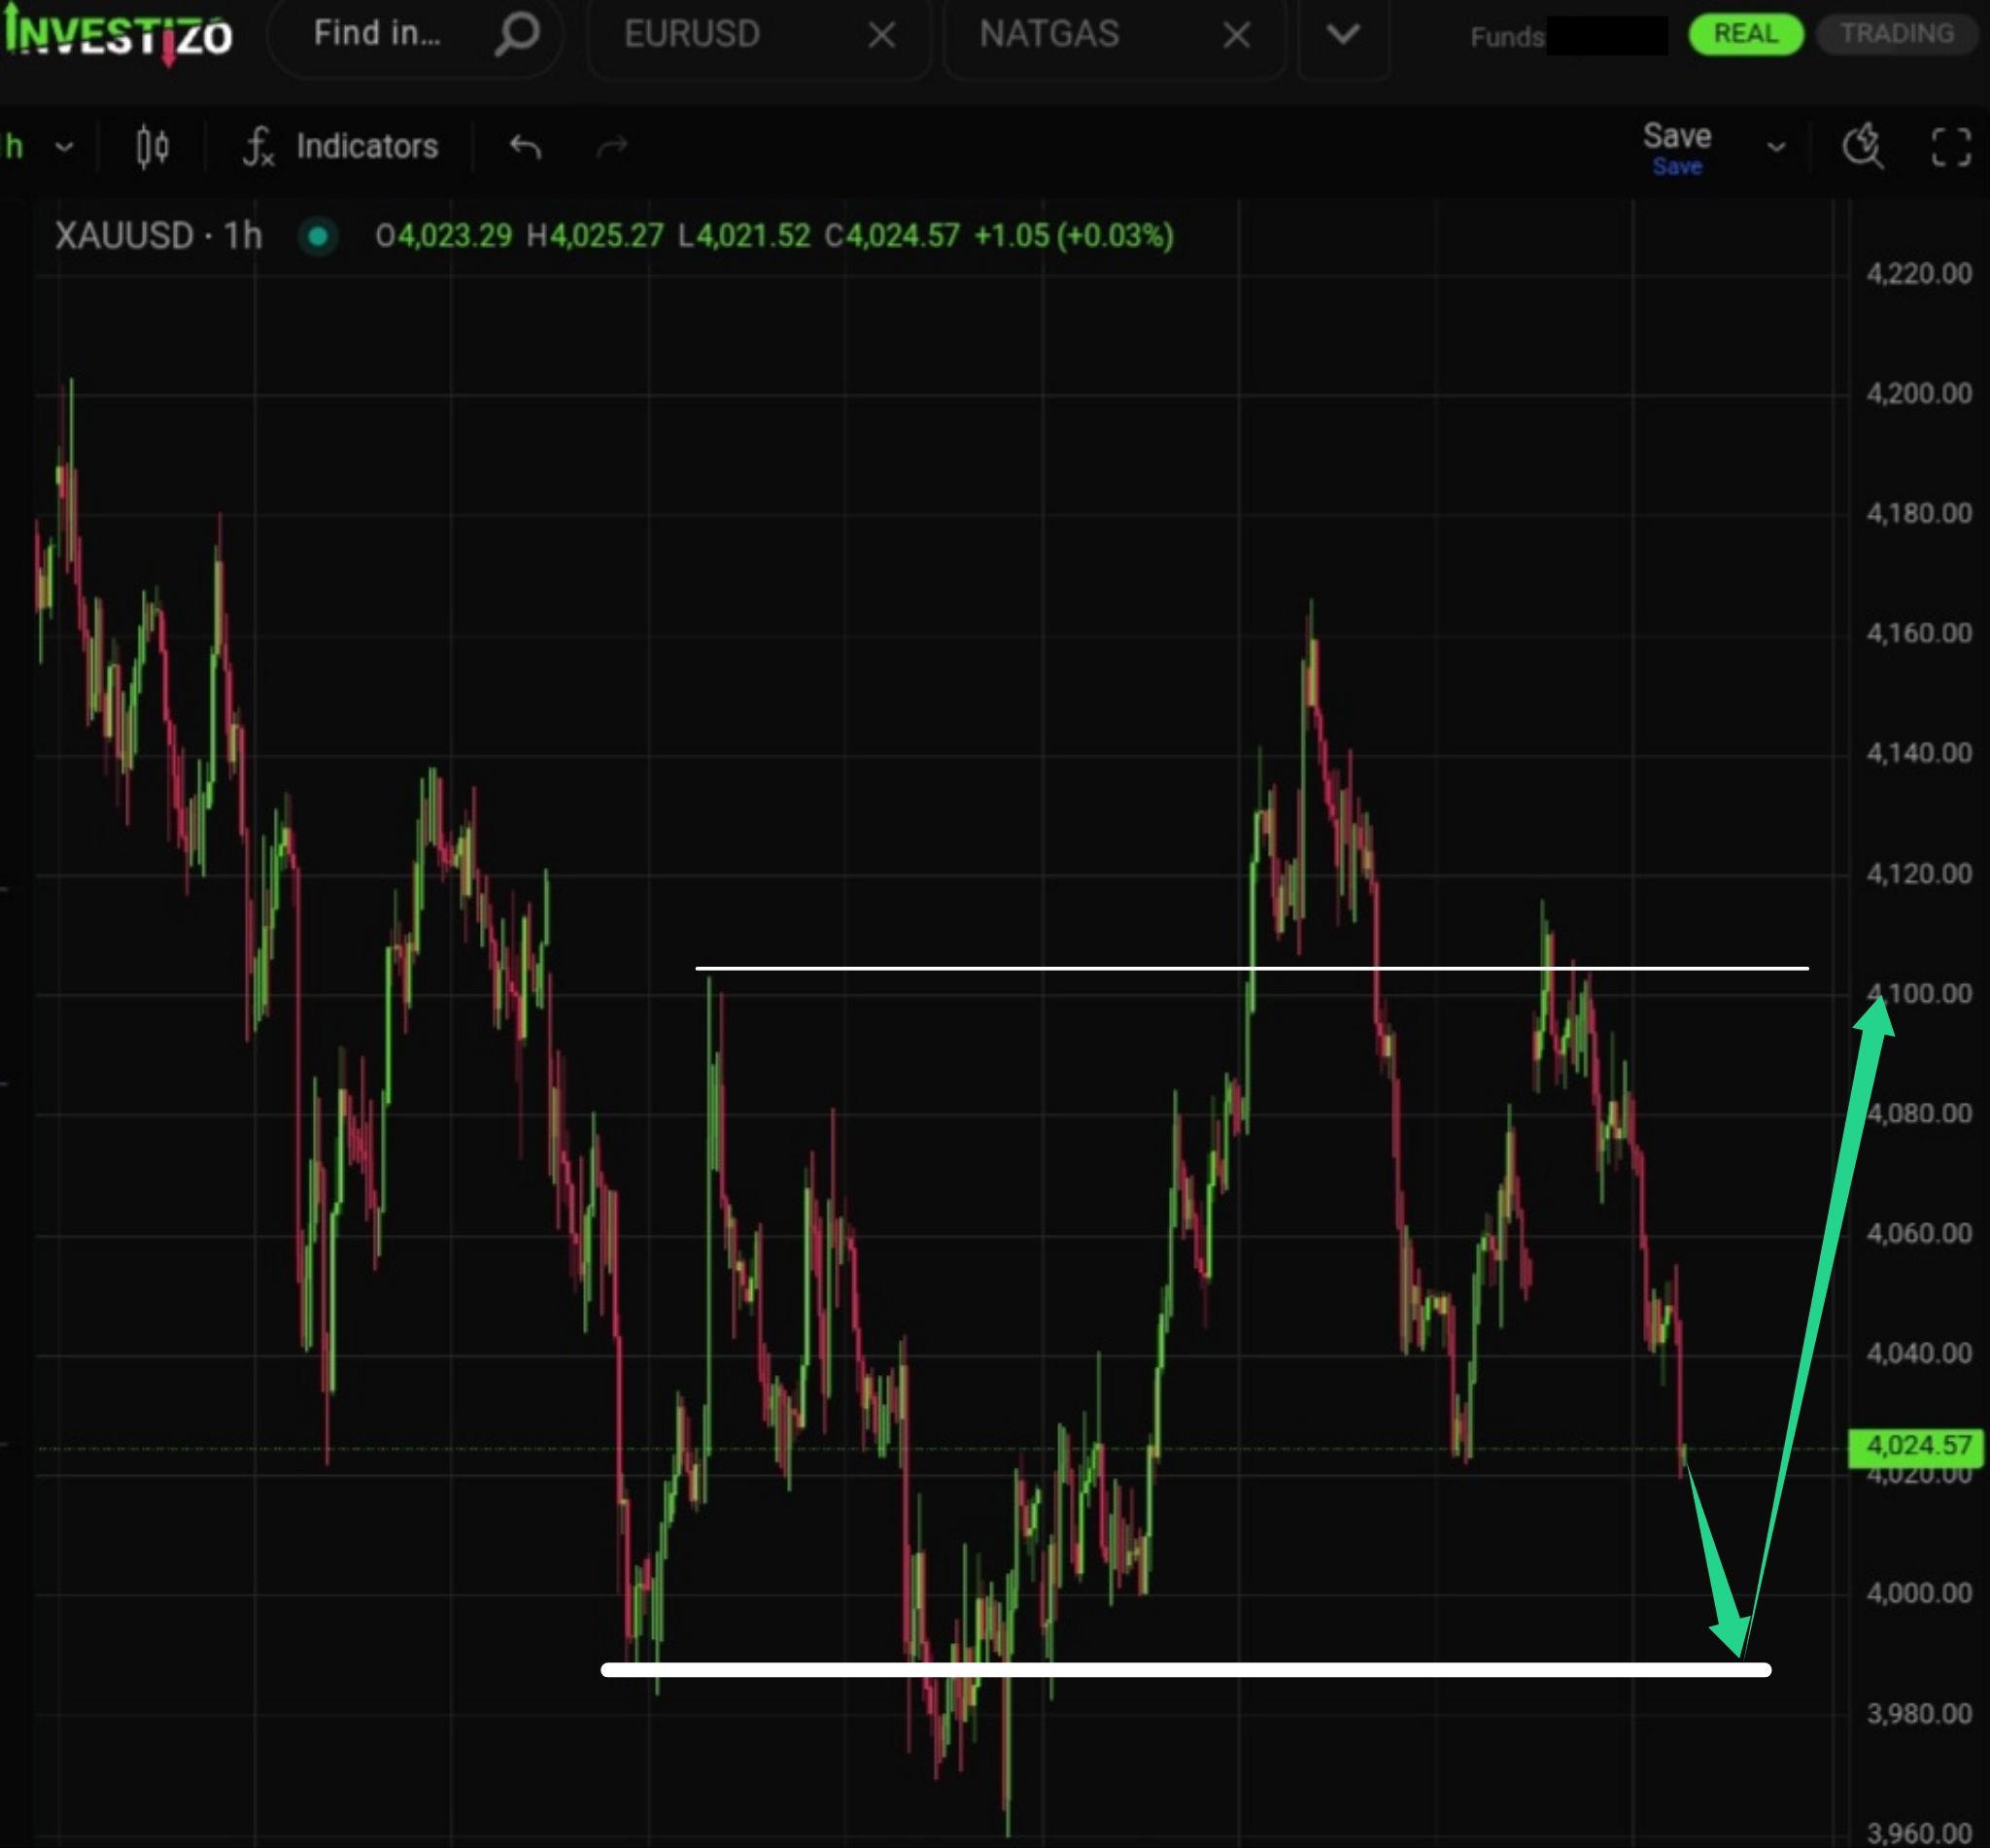
Gold is targeting the 3,990 support zone, where strong buying interest is expected within the bullish Over&Under pattern.
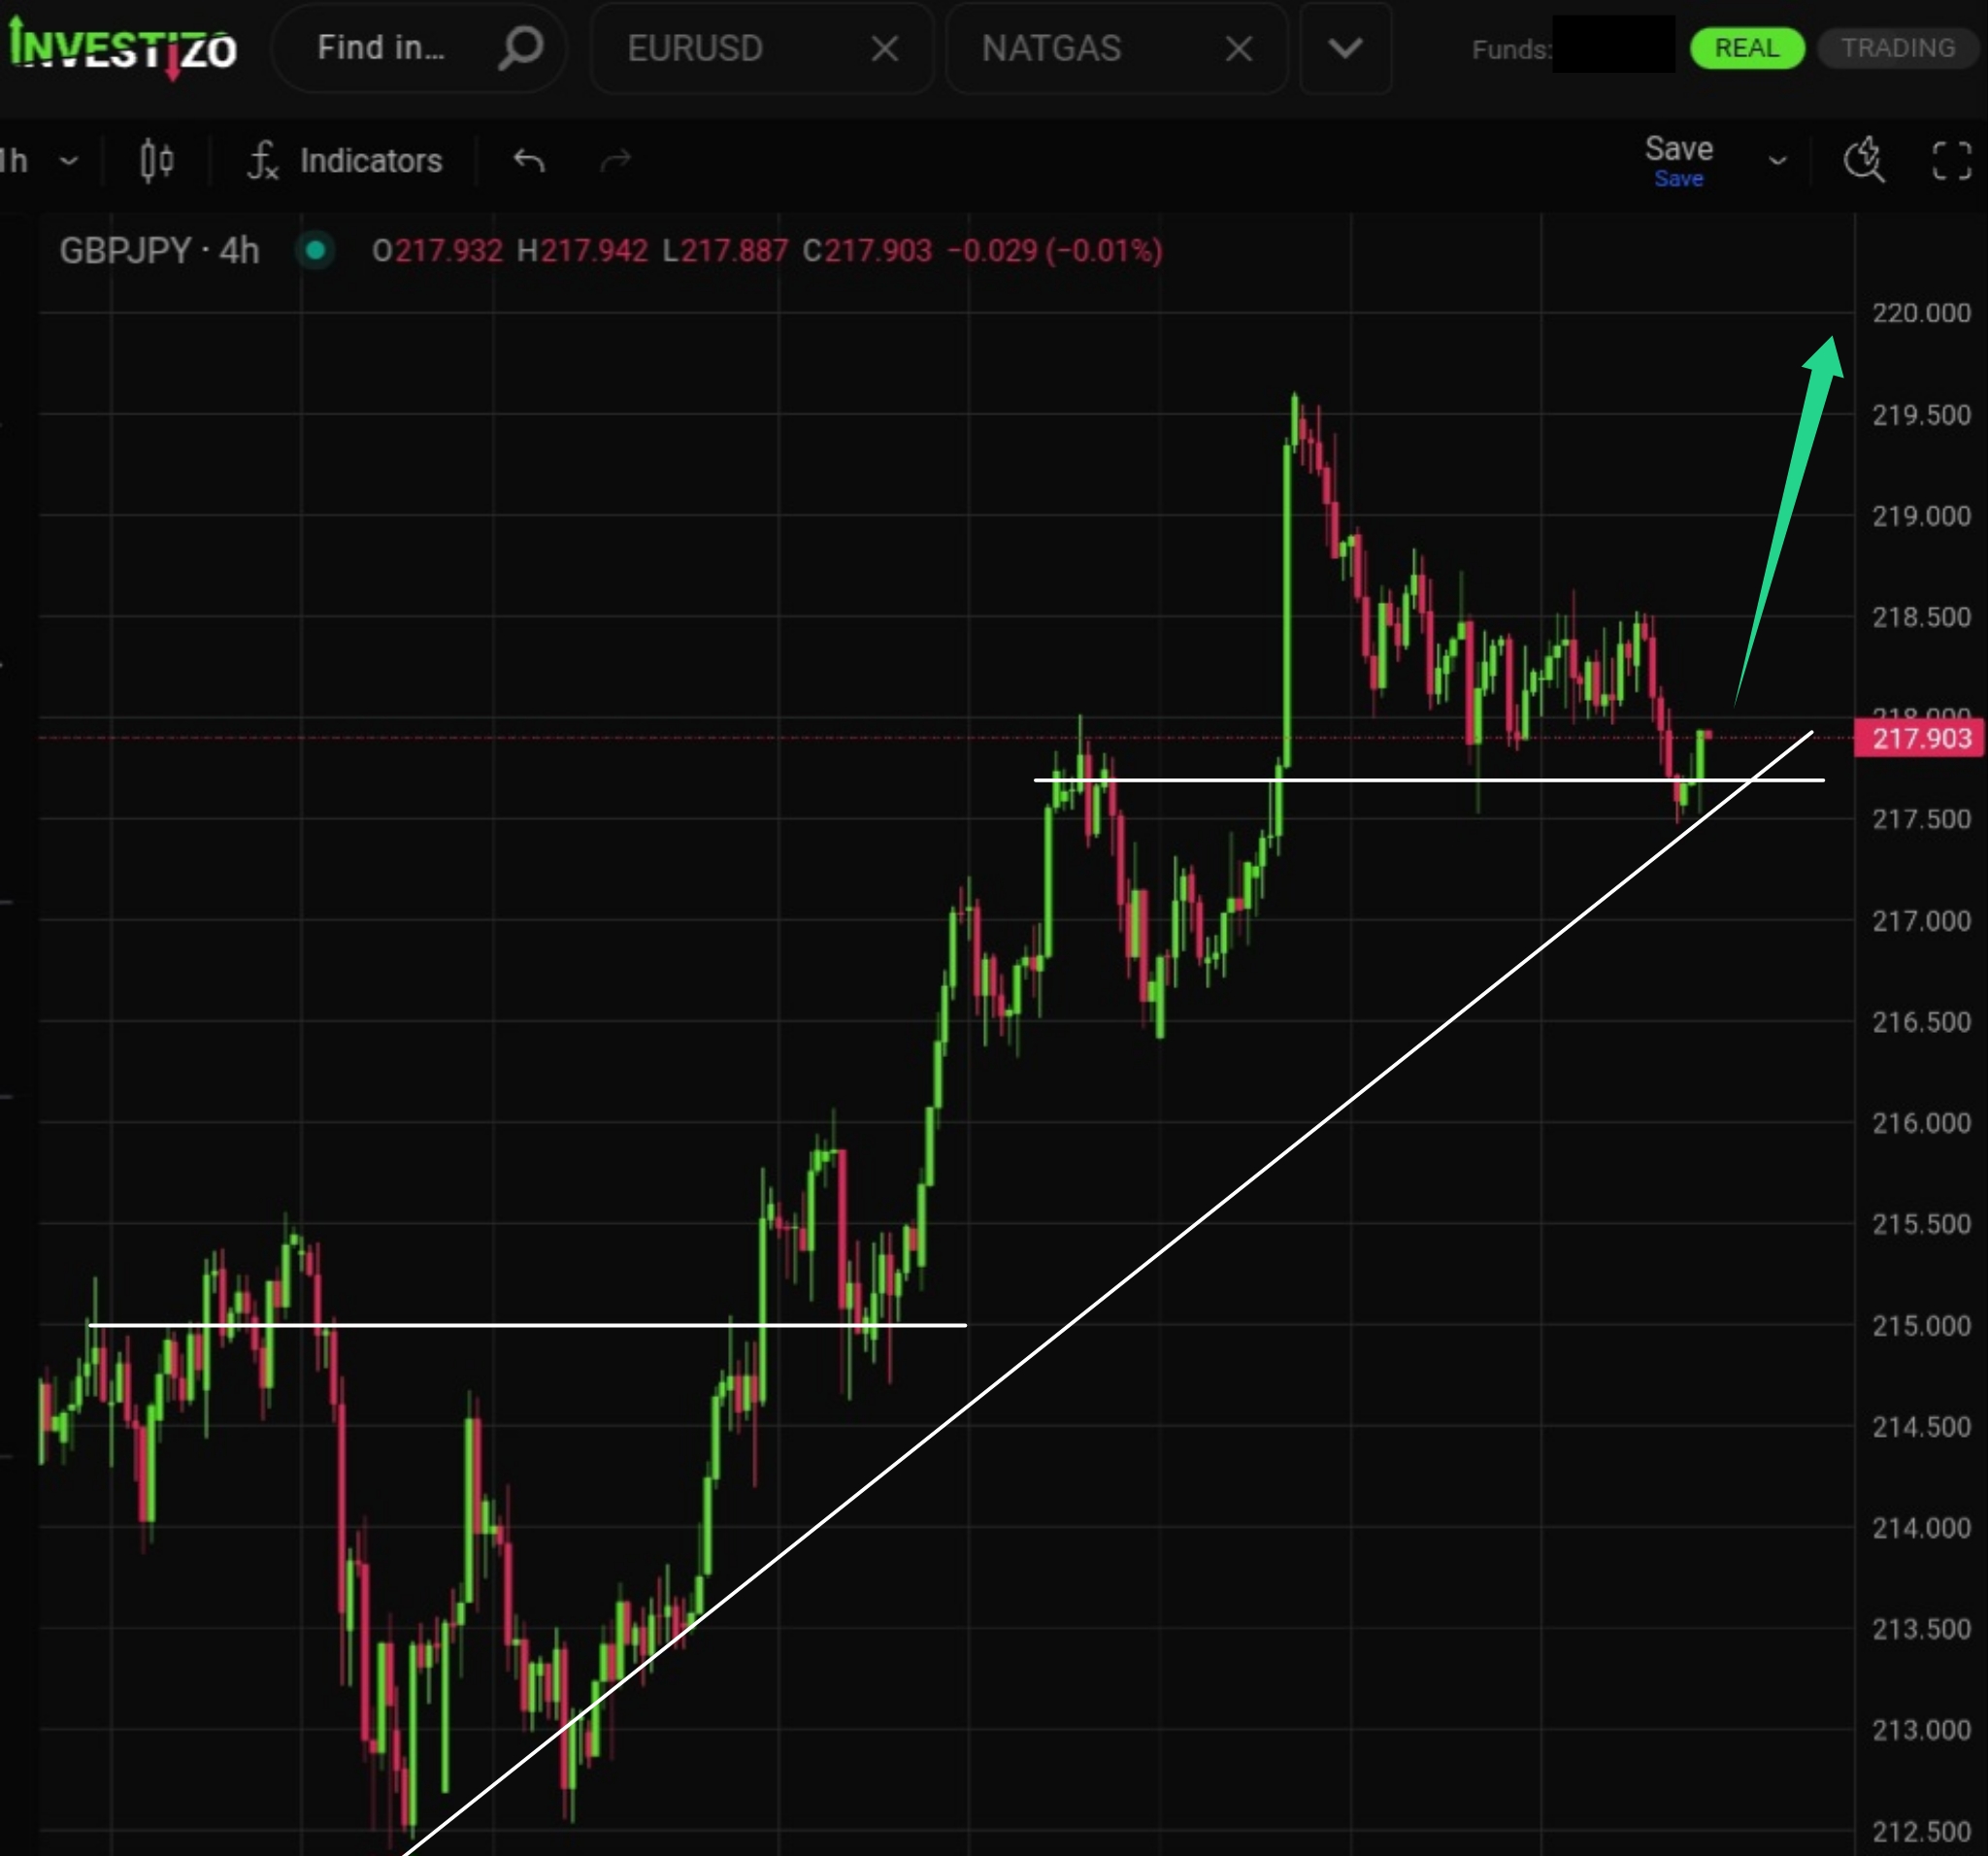
GBP/JPY has preserved its upward structure and bullish momentum after a prolonged downward correction lasting over 200 hours.
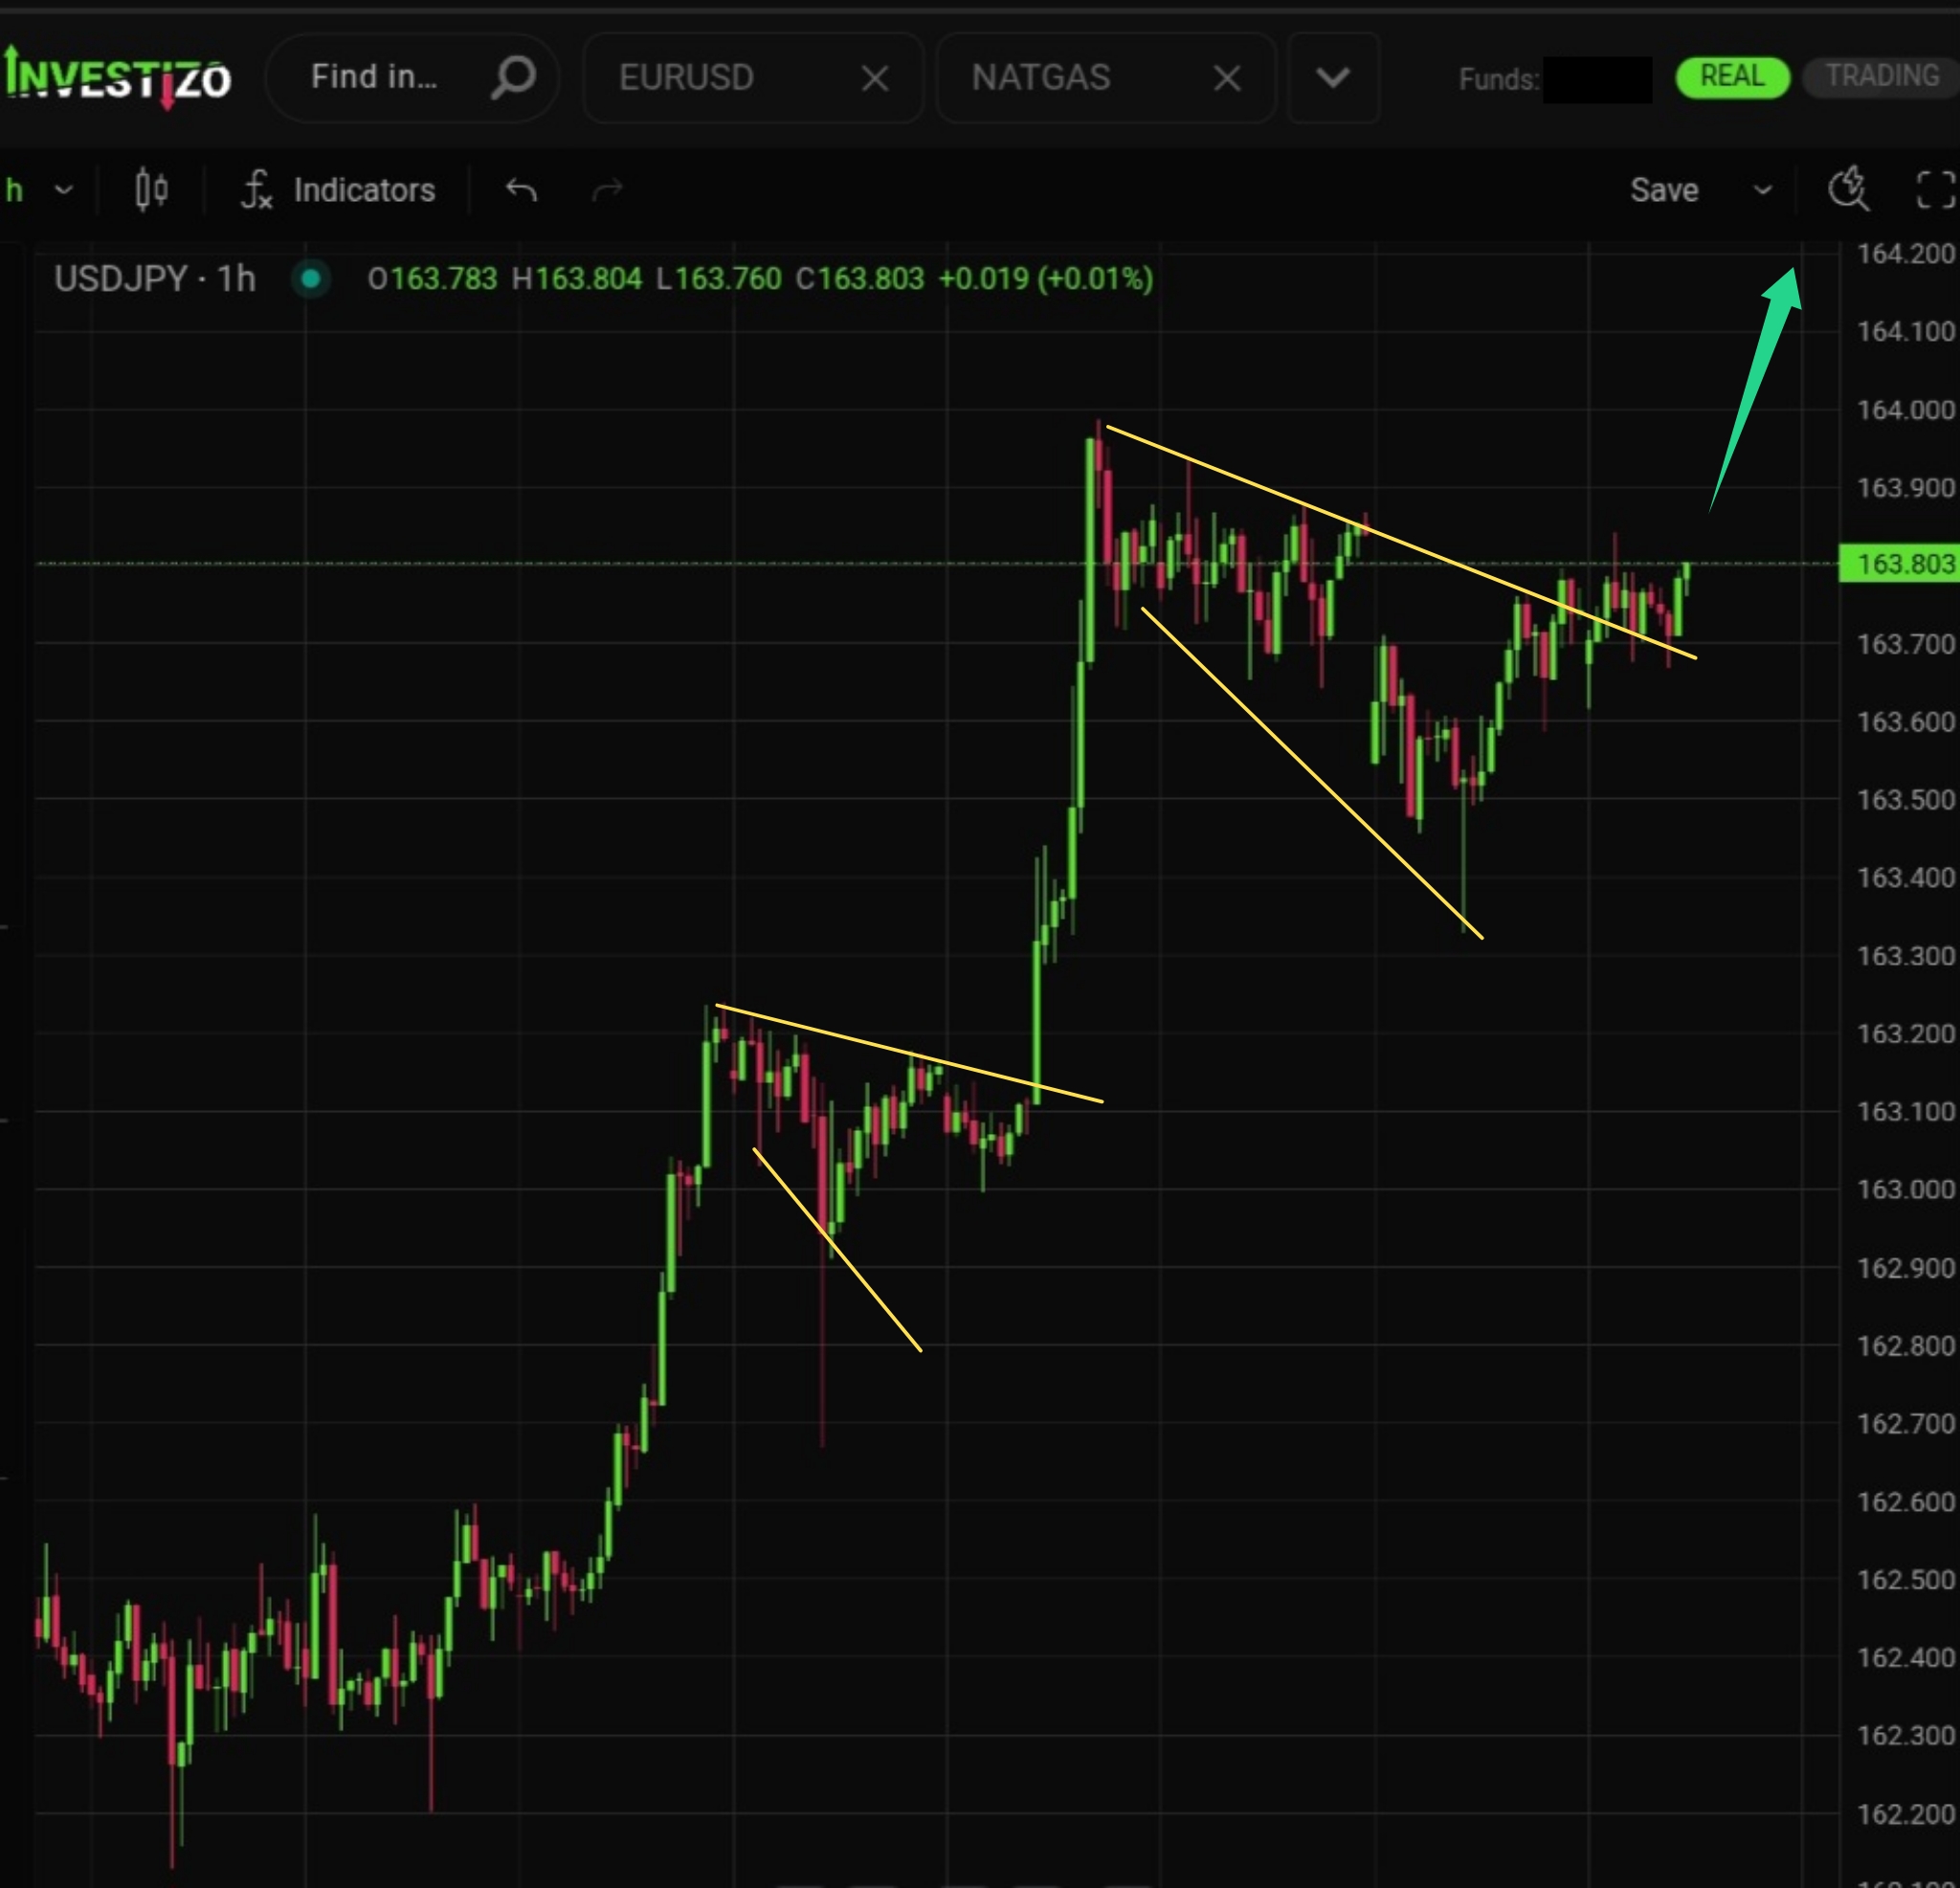
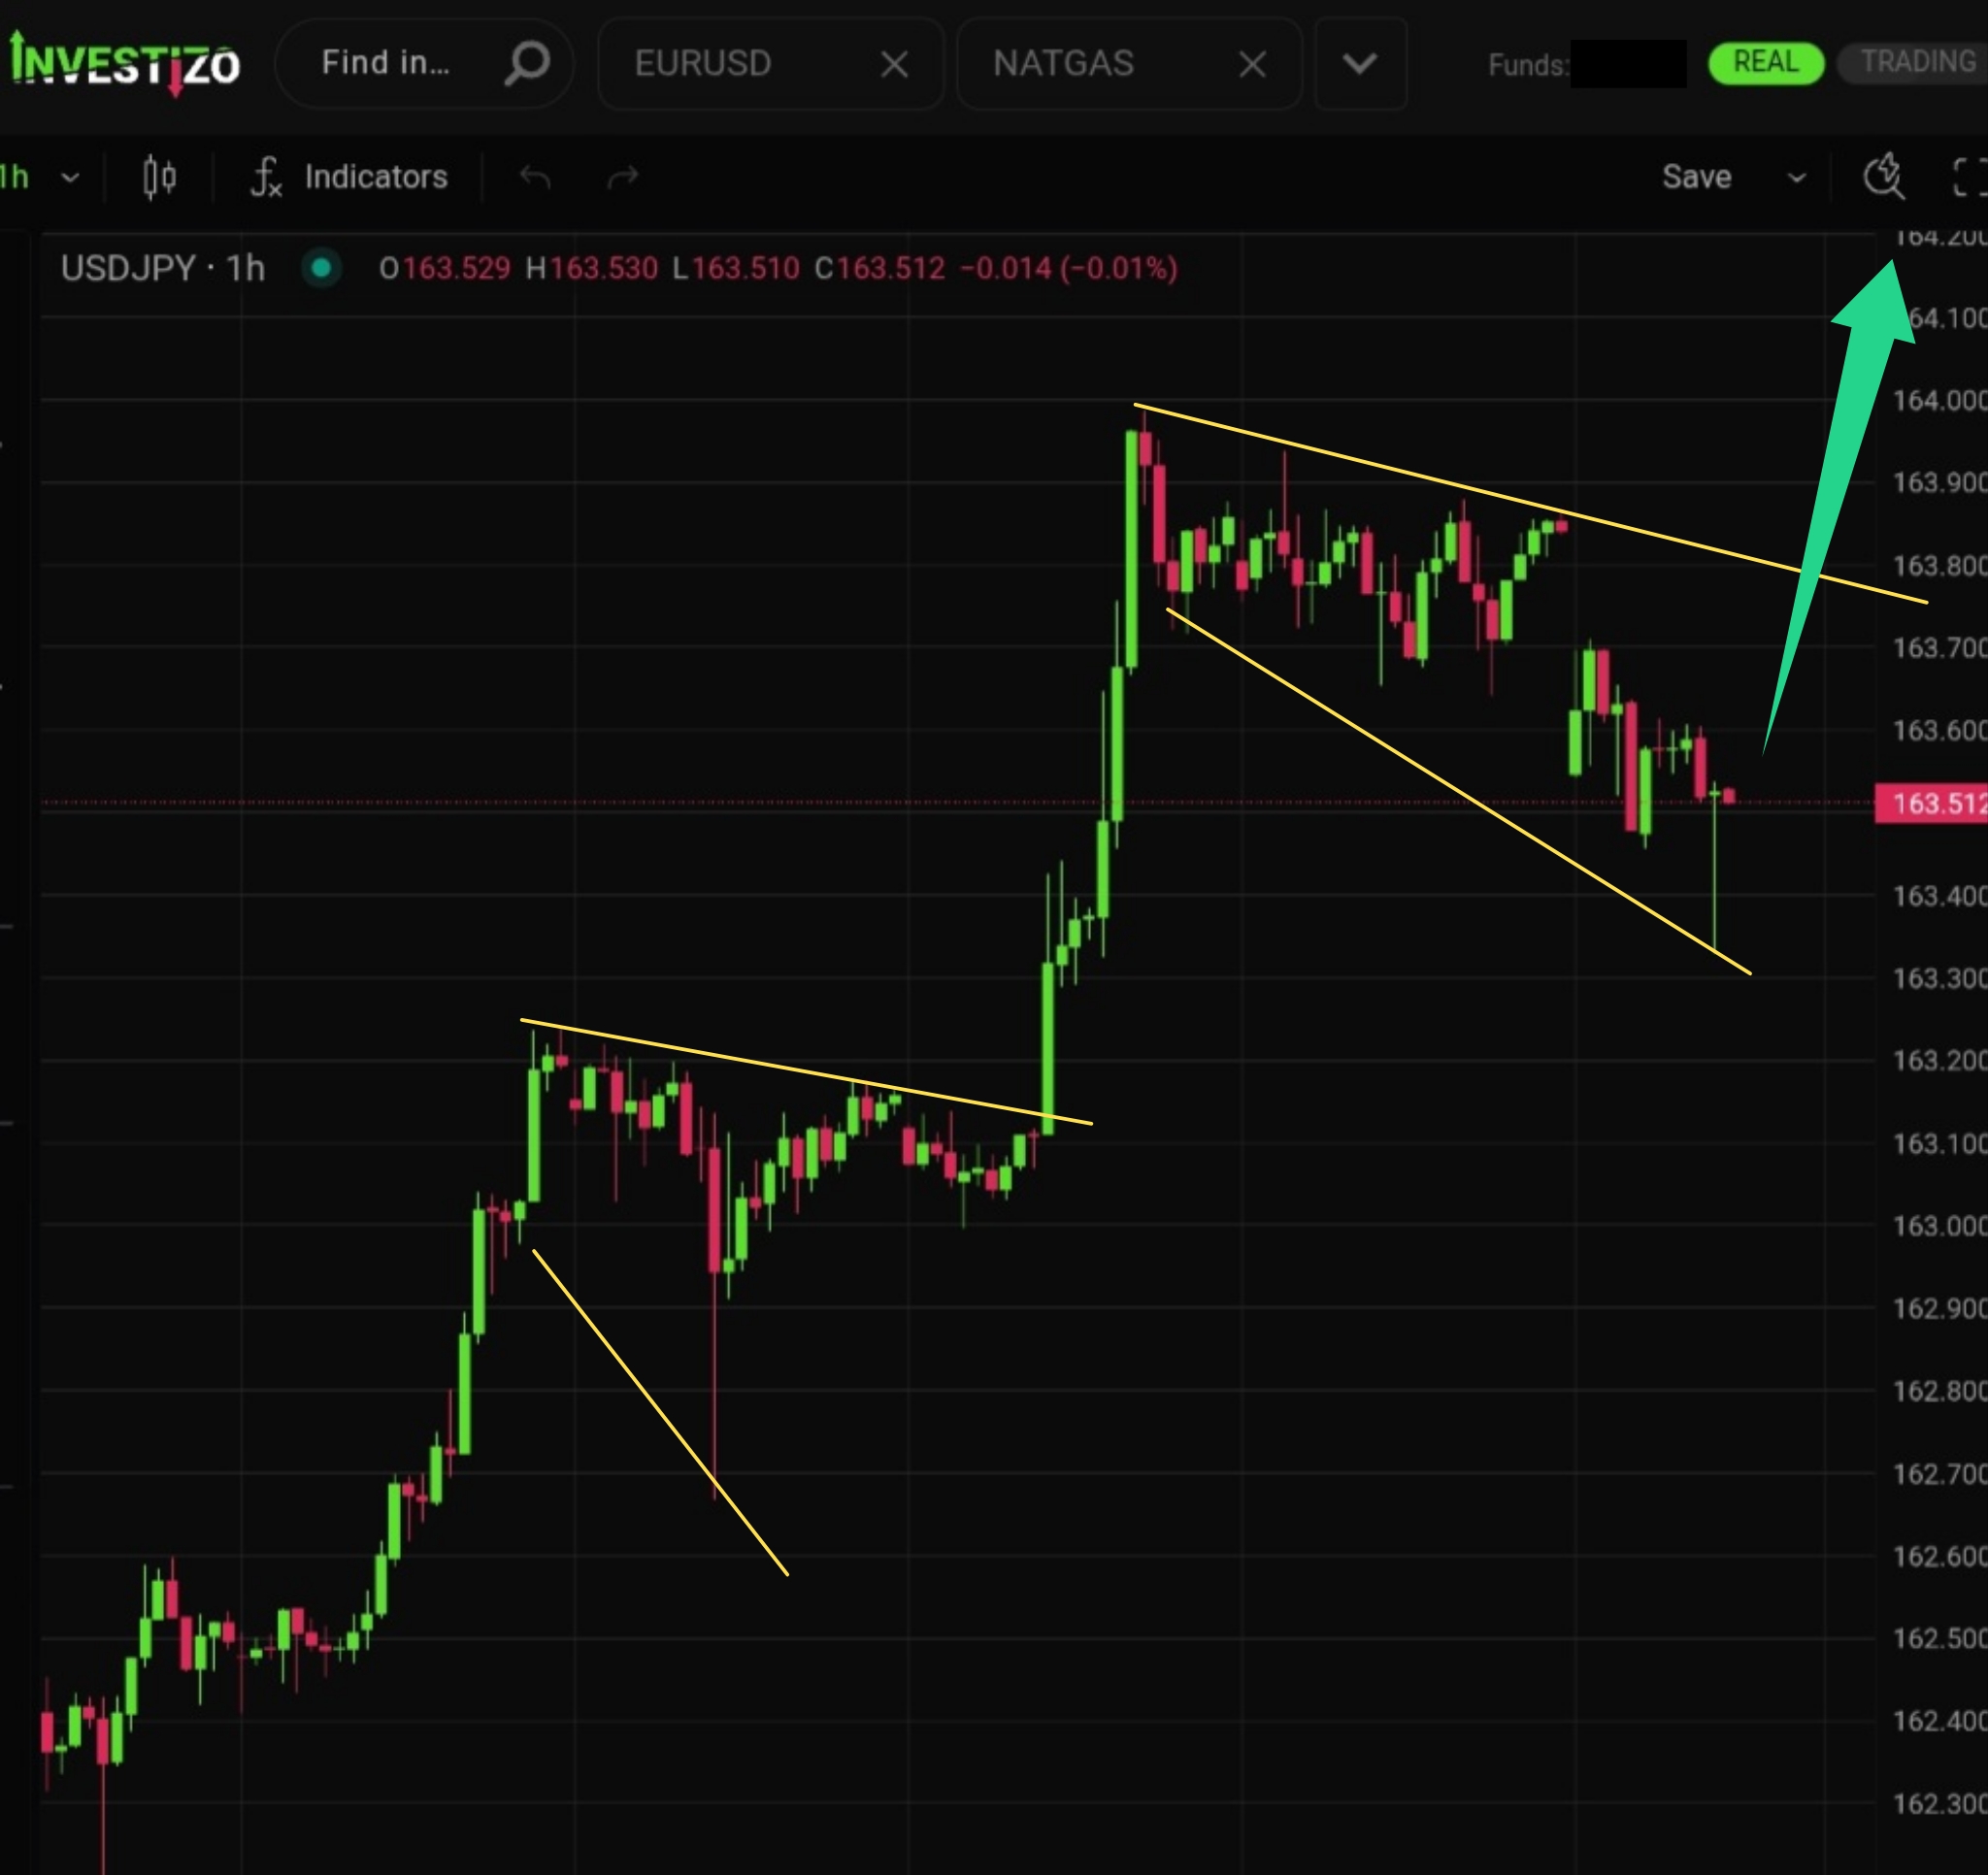
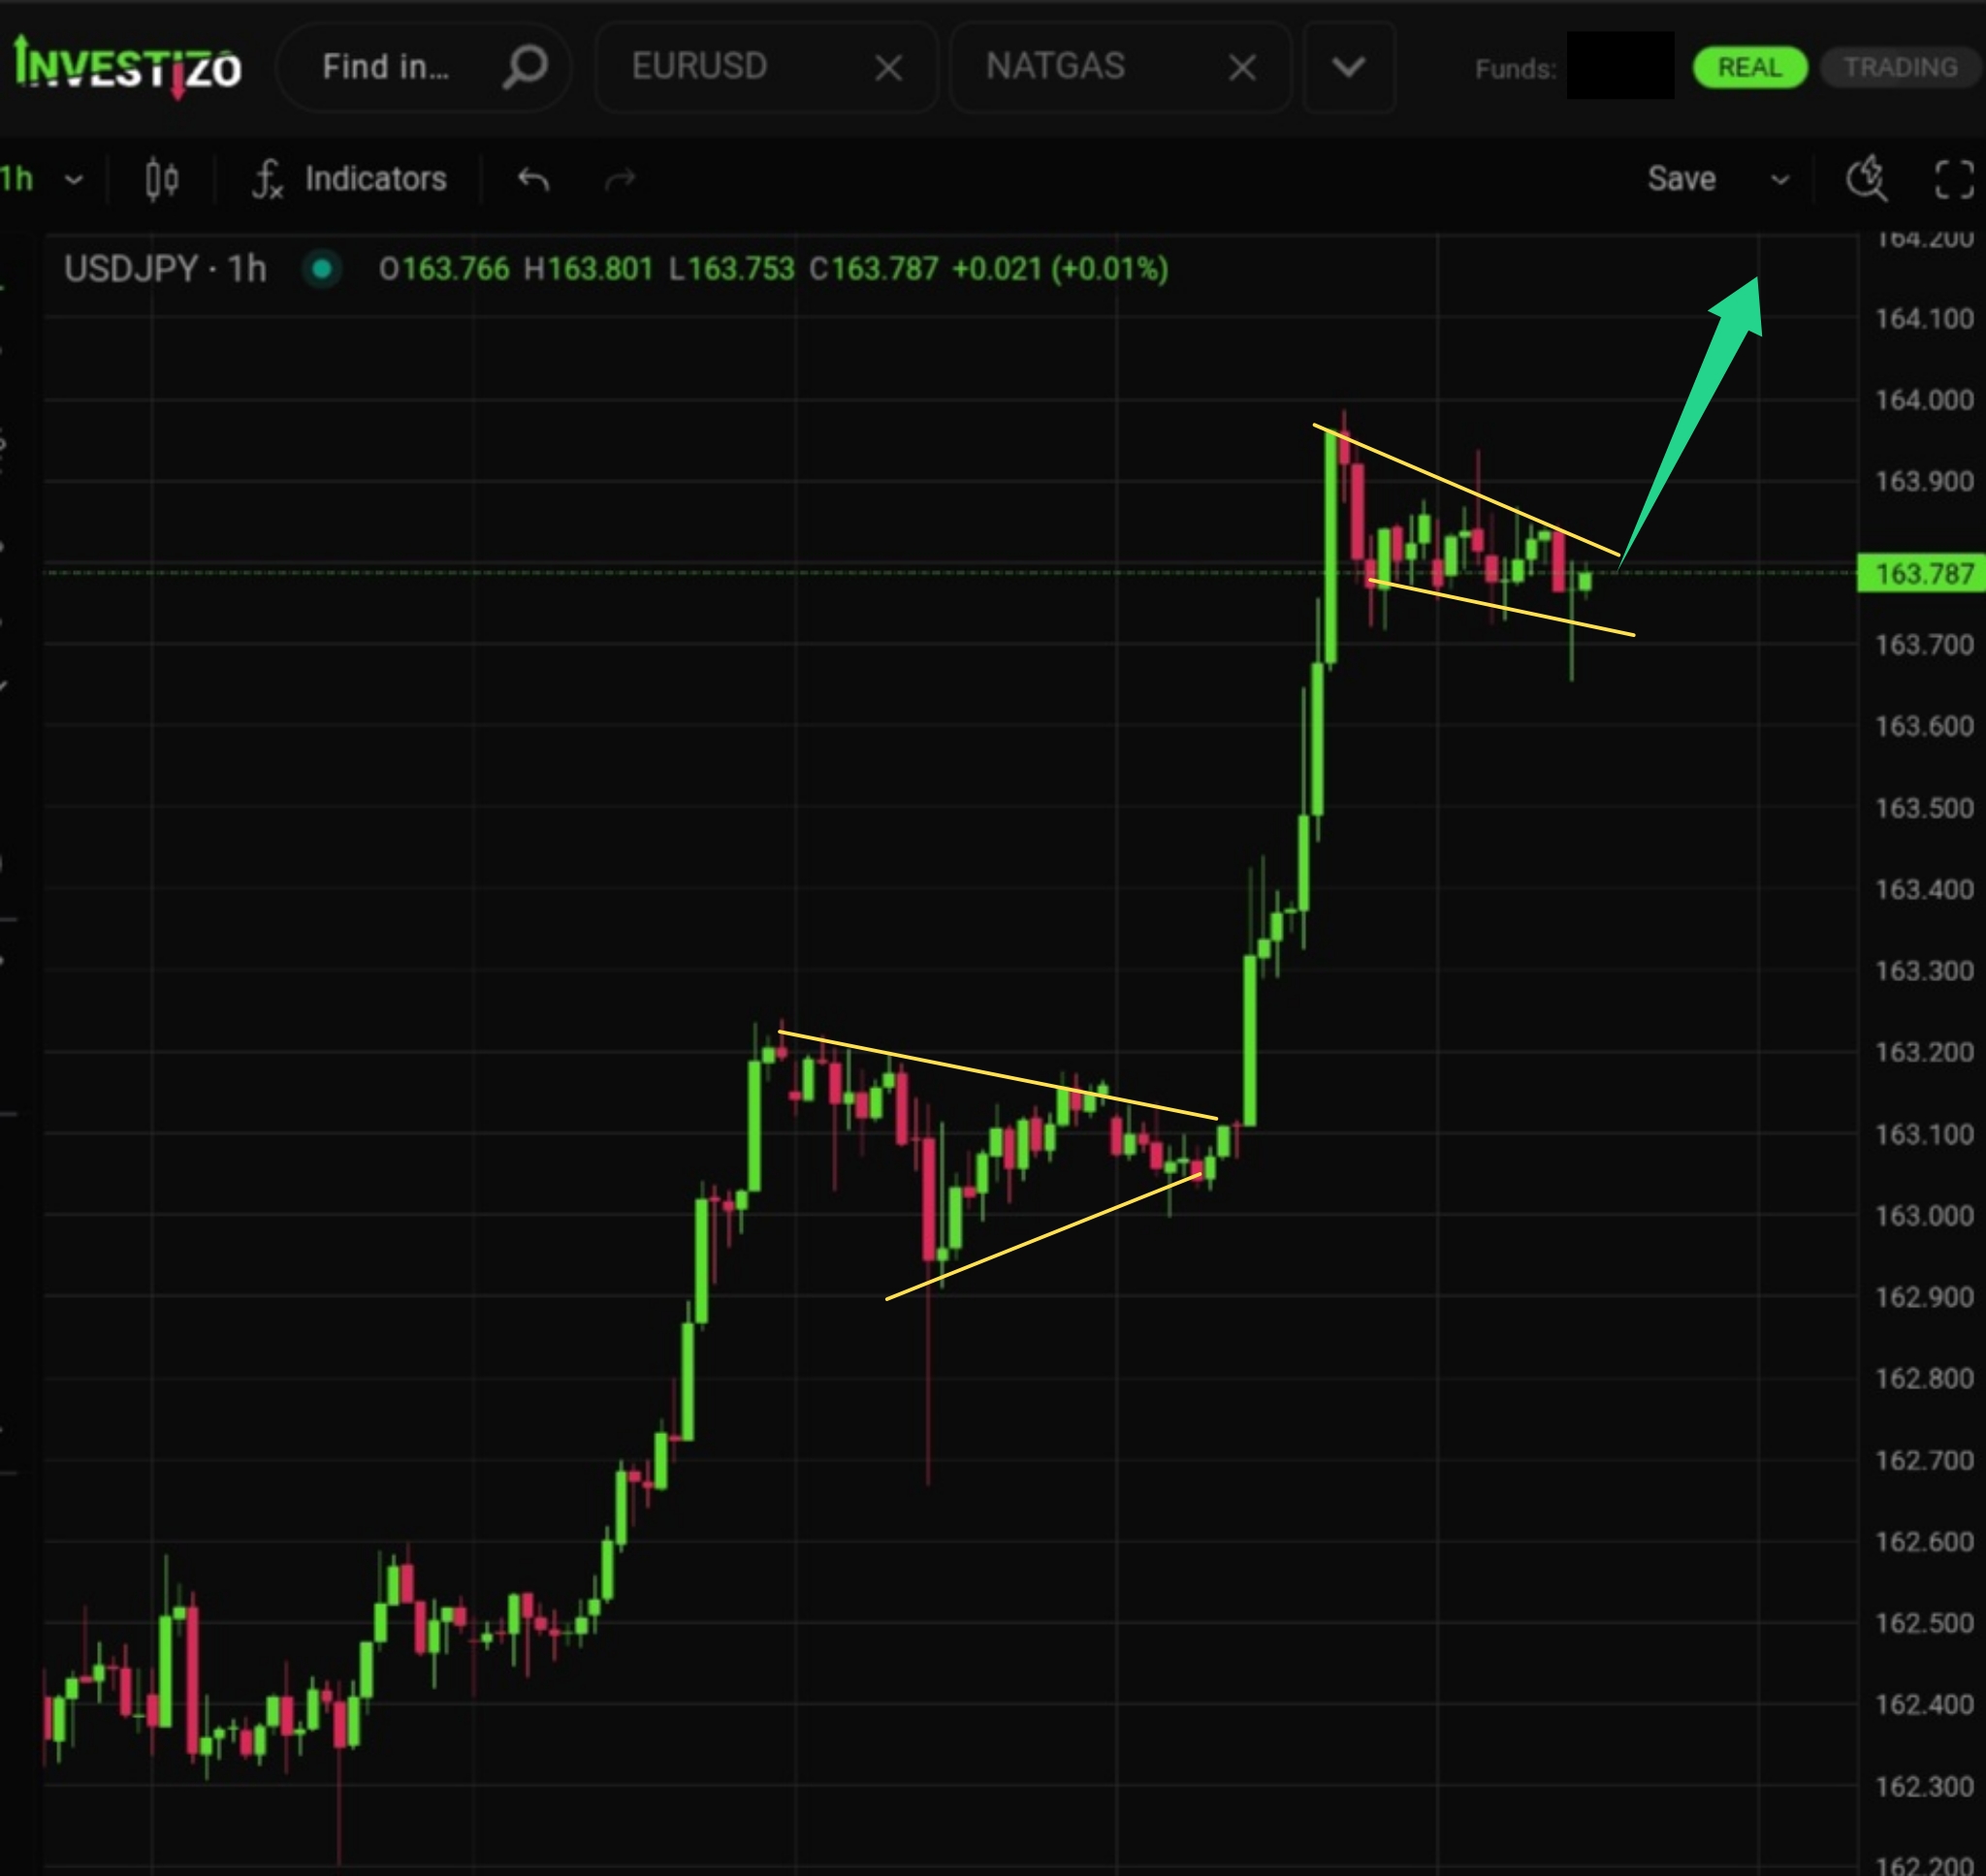
USD/JPY continues its upward trend within the expanding megaphone pattern on the H1 chart, with upside potential focused on the 164.200–164.500 zone.
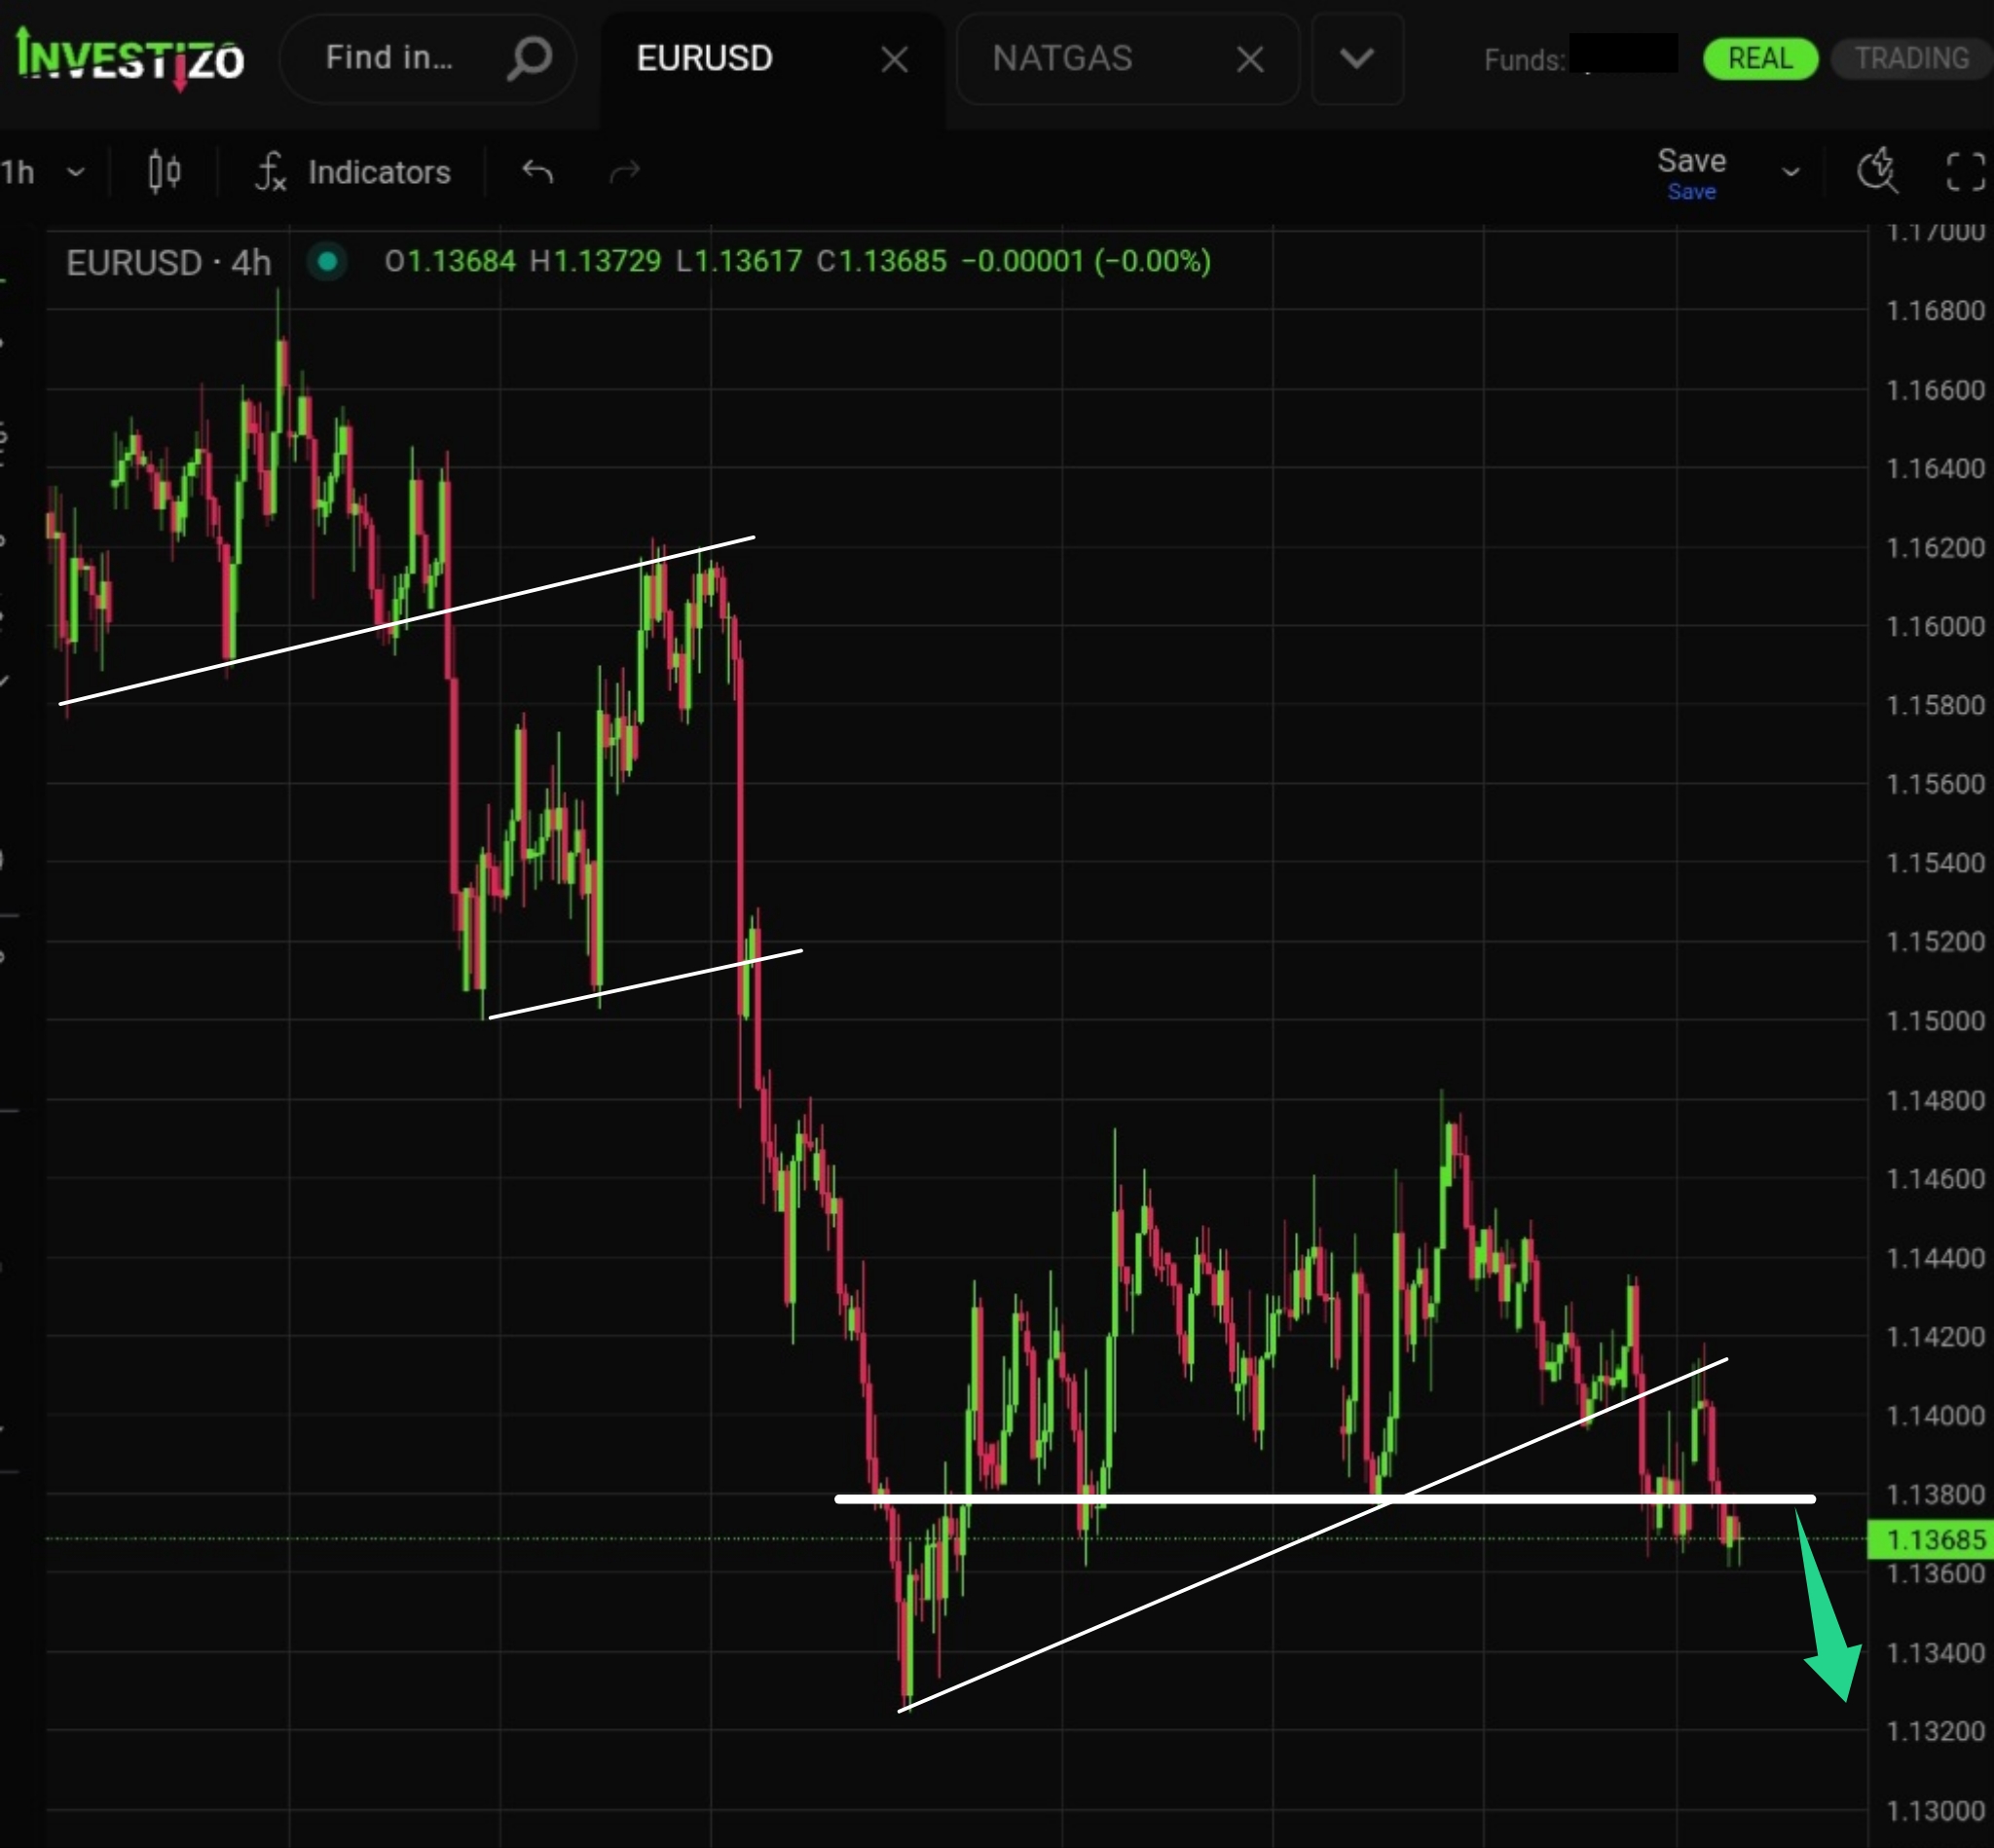
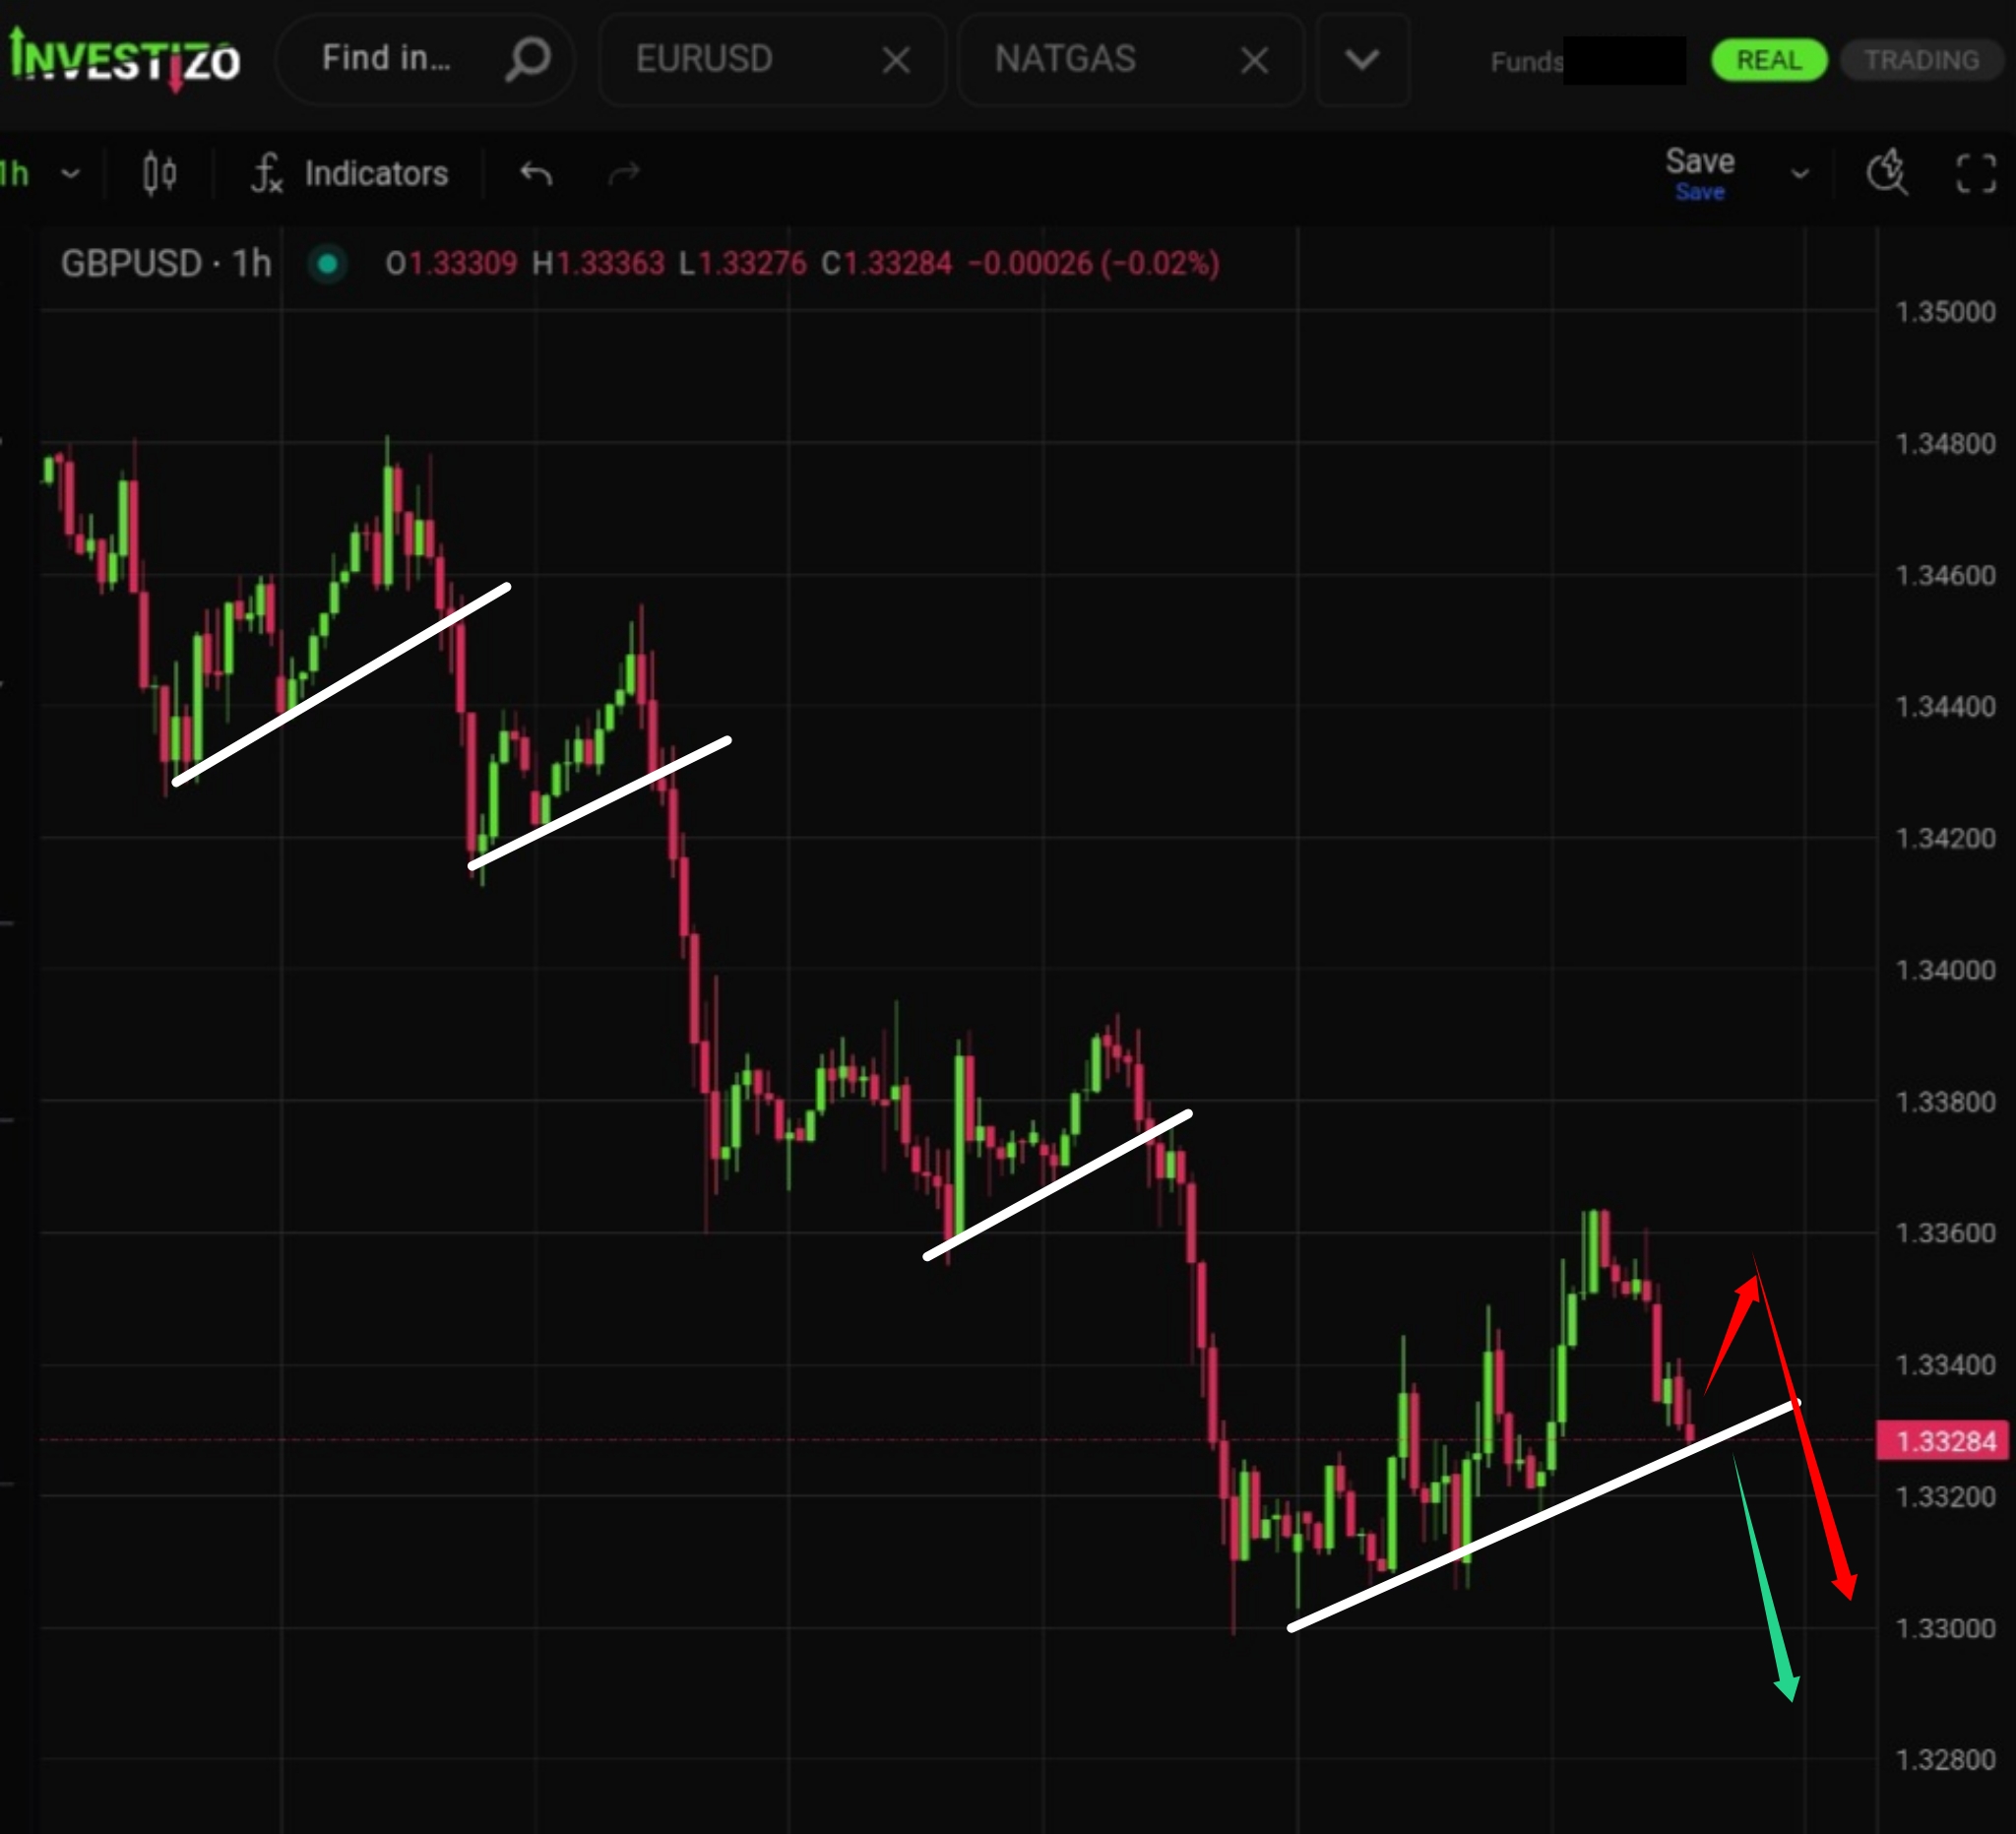
The pair is consolidating below the previously broken sloping support — a normal price behaviour before an impulsive move develops.
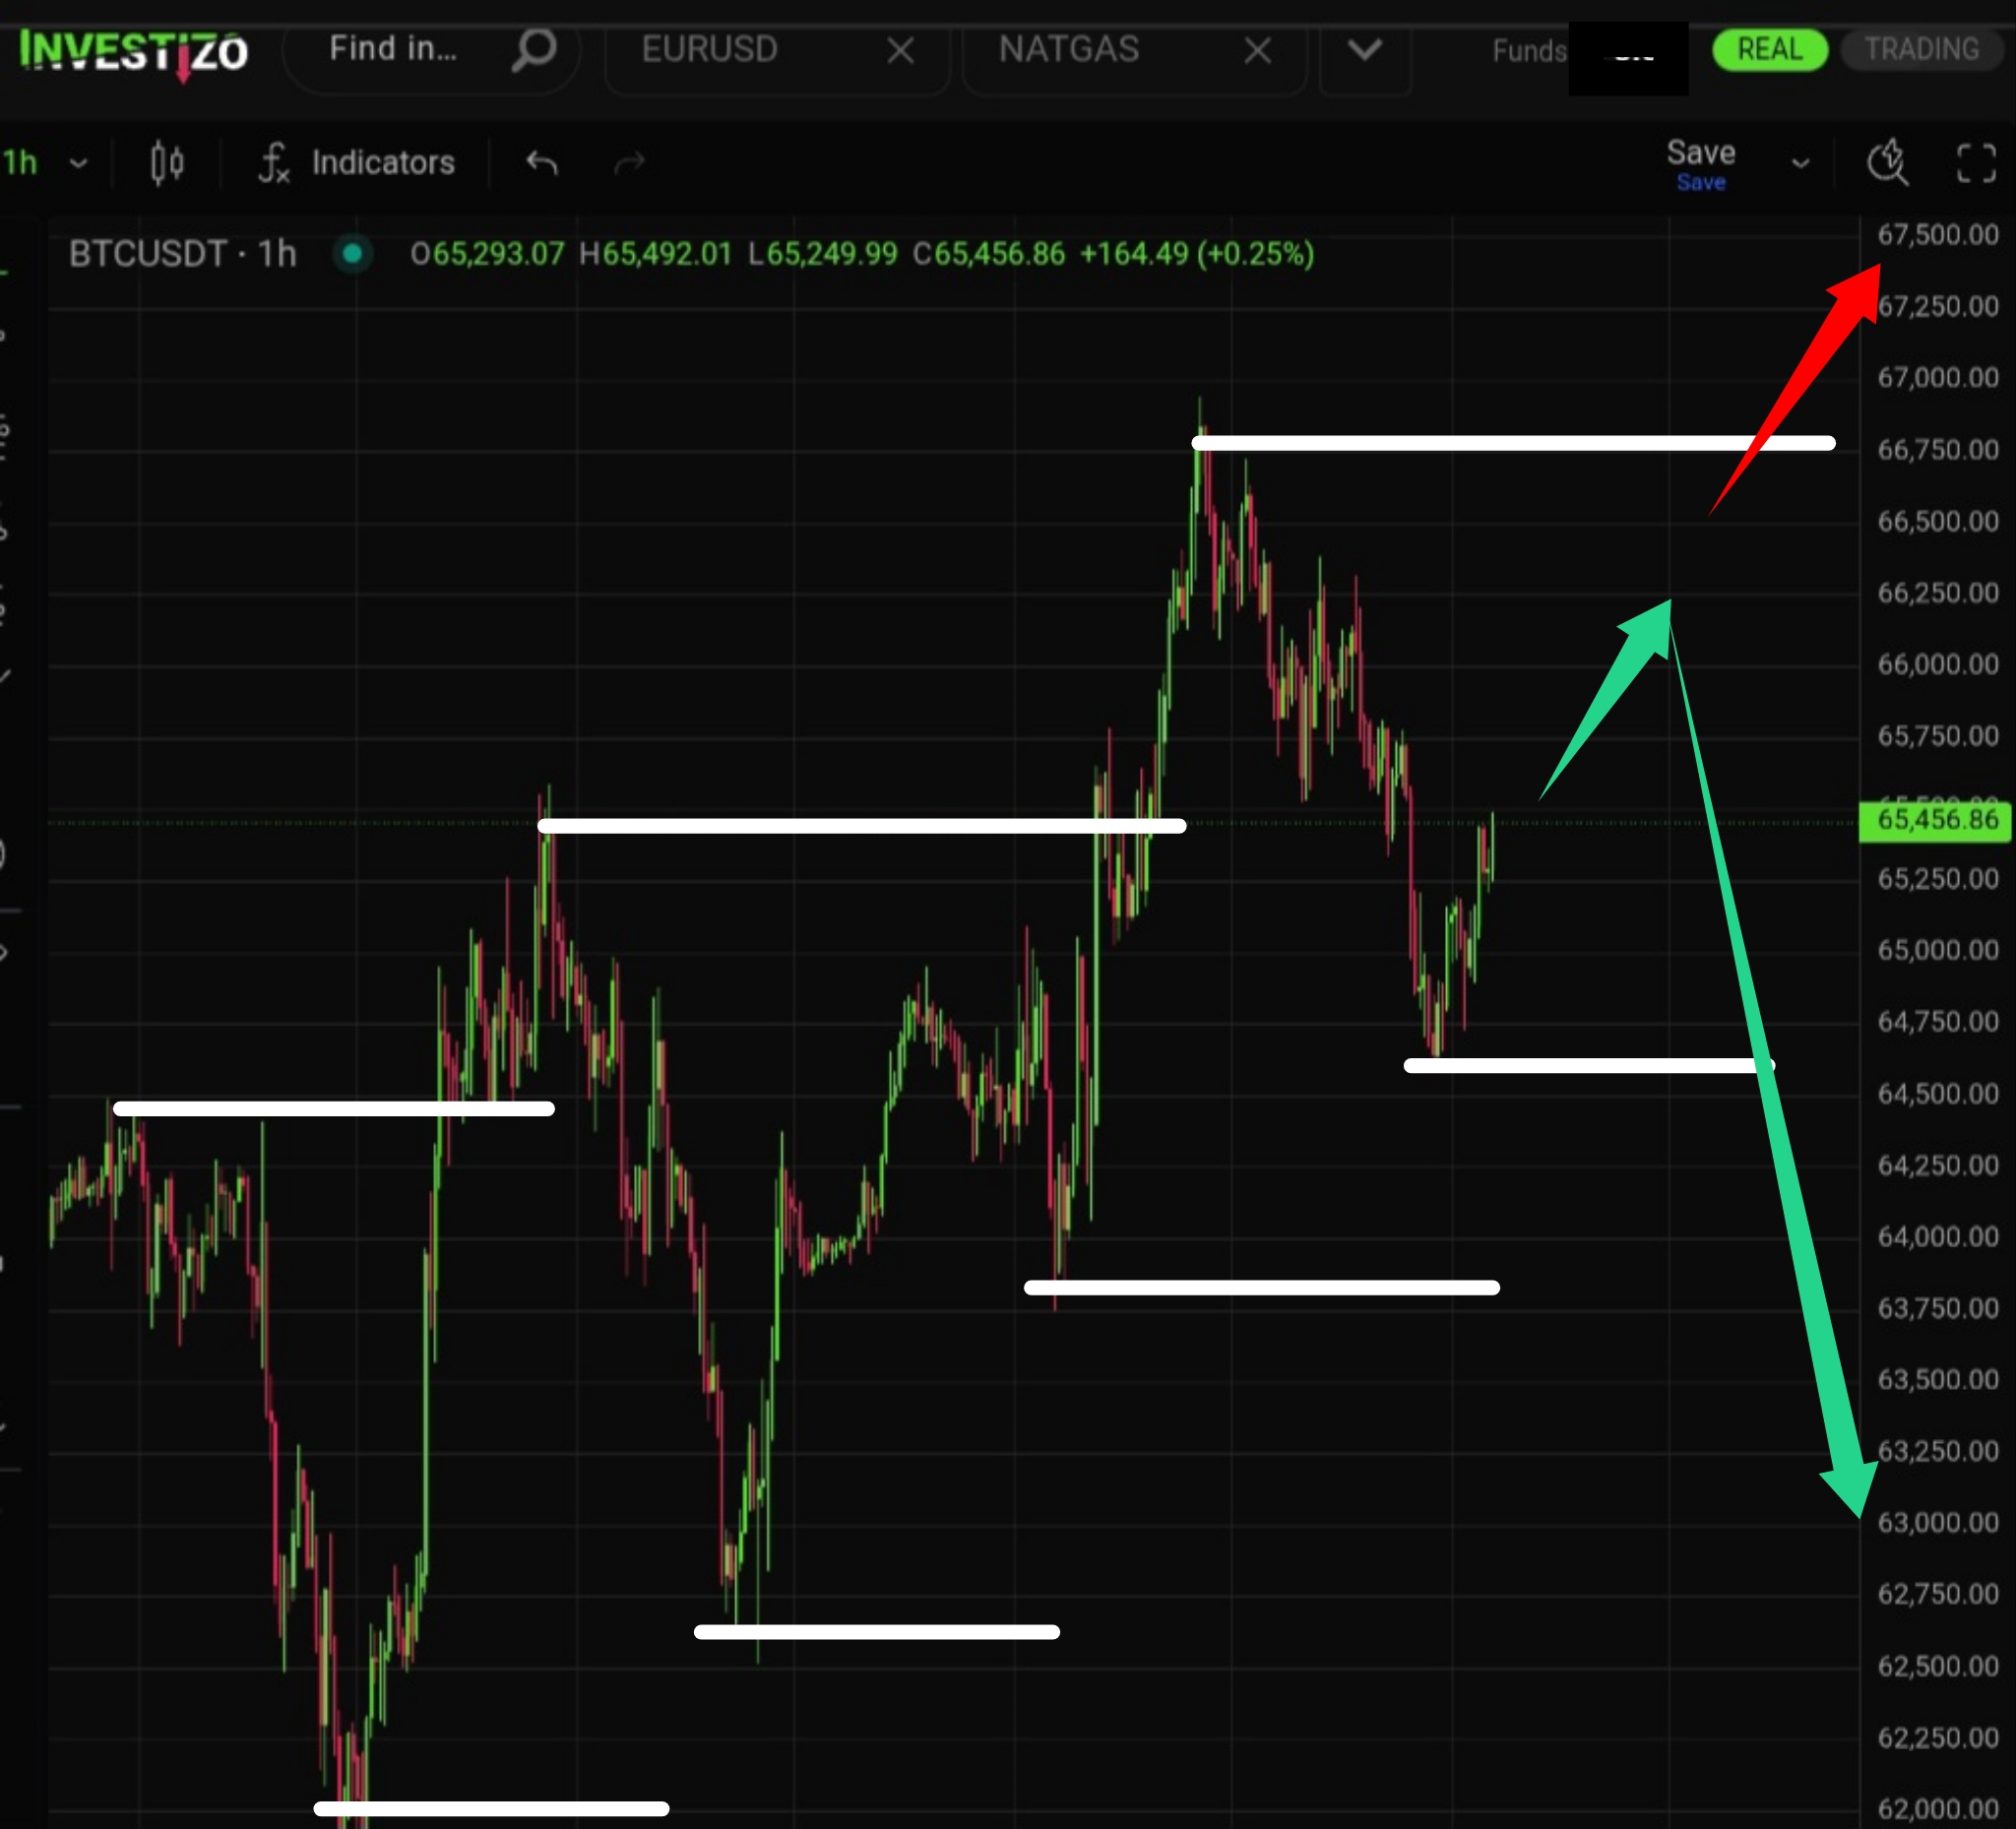
Bitcoin (BTC/USD) trades at $63,530 this Wednesday morning, pressing lower toward the $63,000 threshold as spot ETF products record 3 consecutive trading sessions of net outflows.
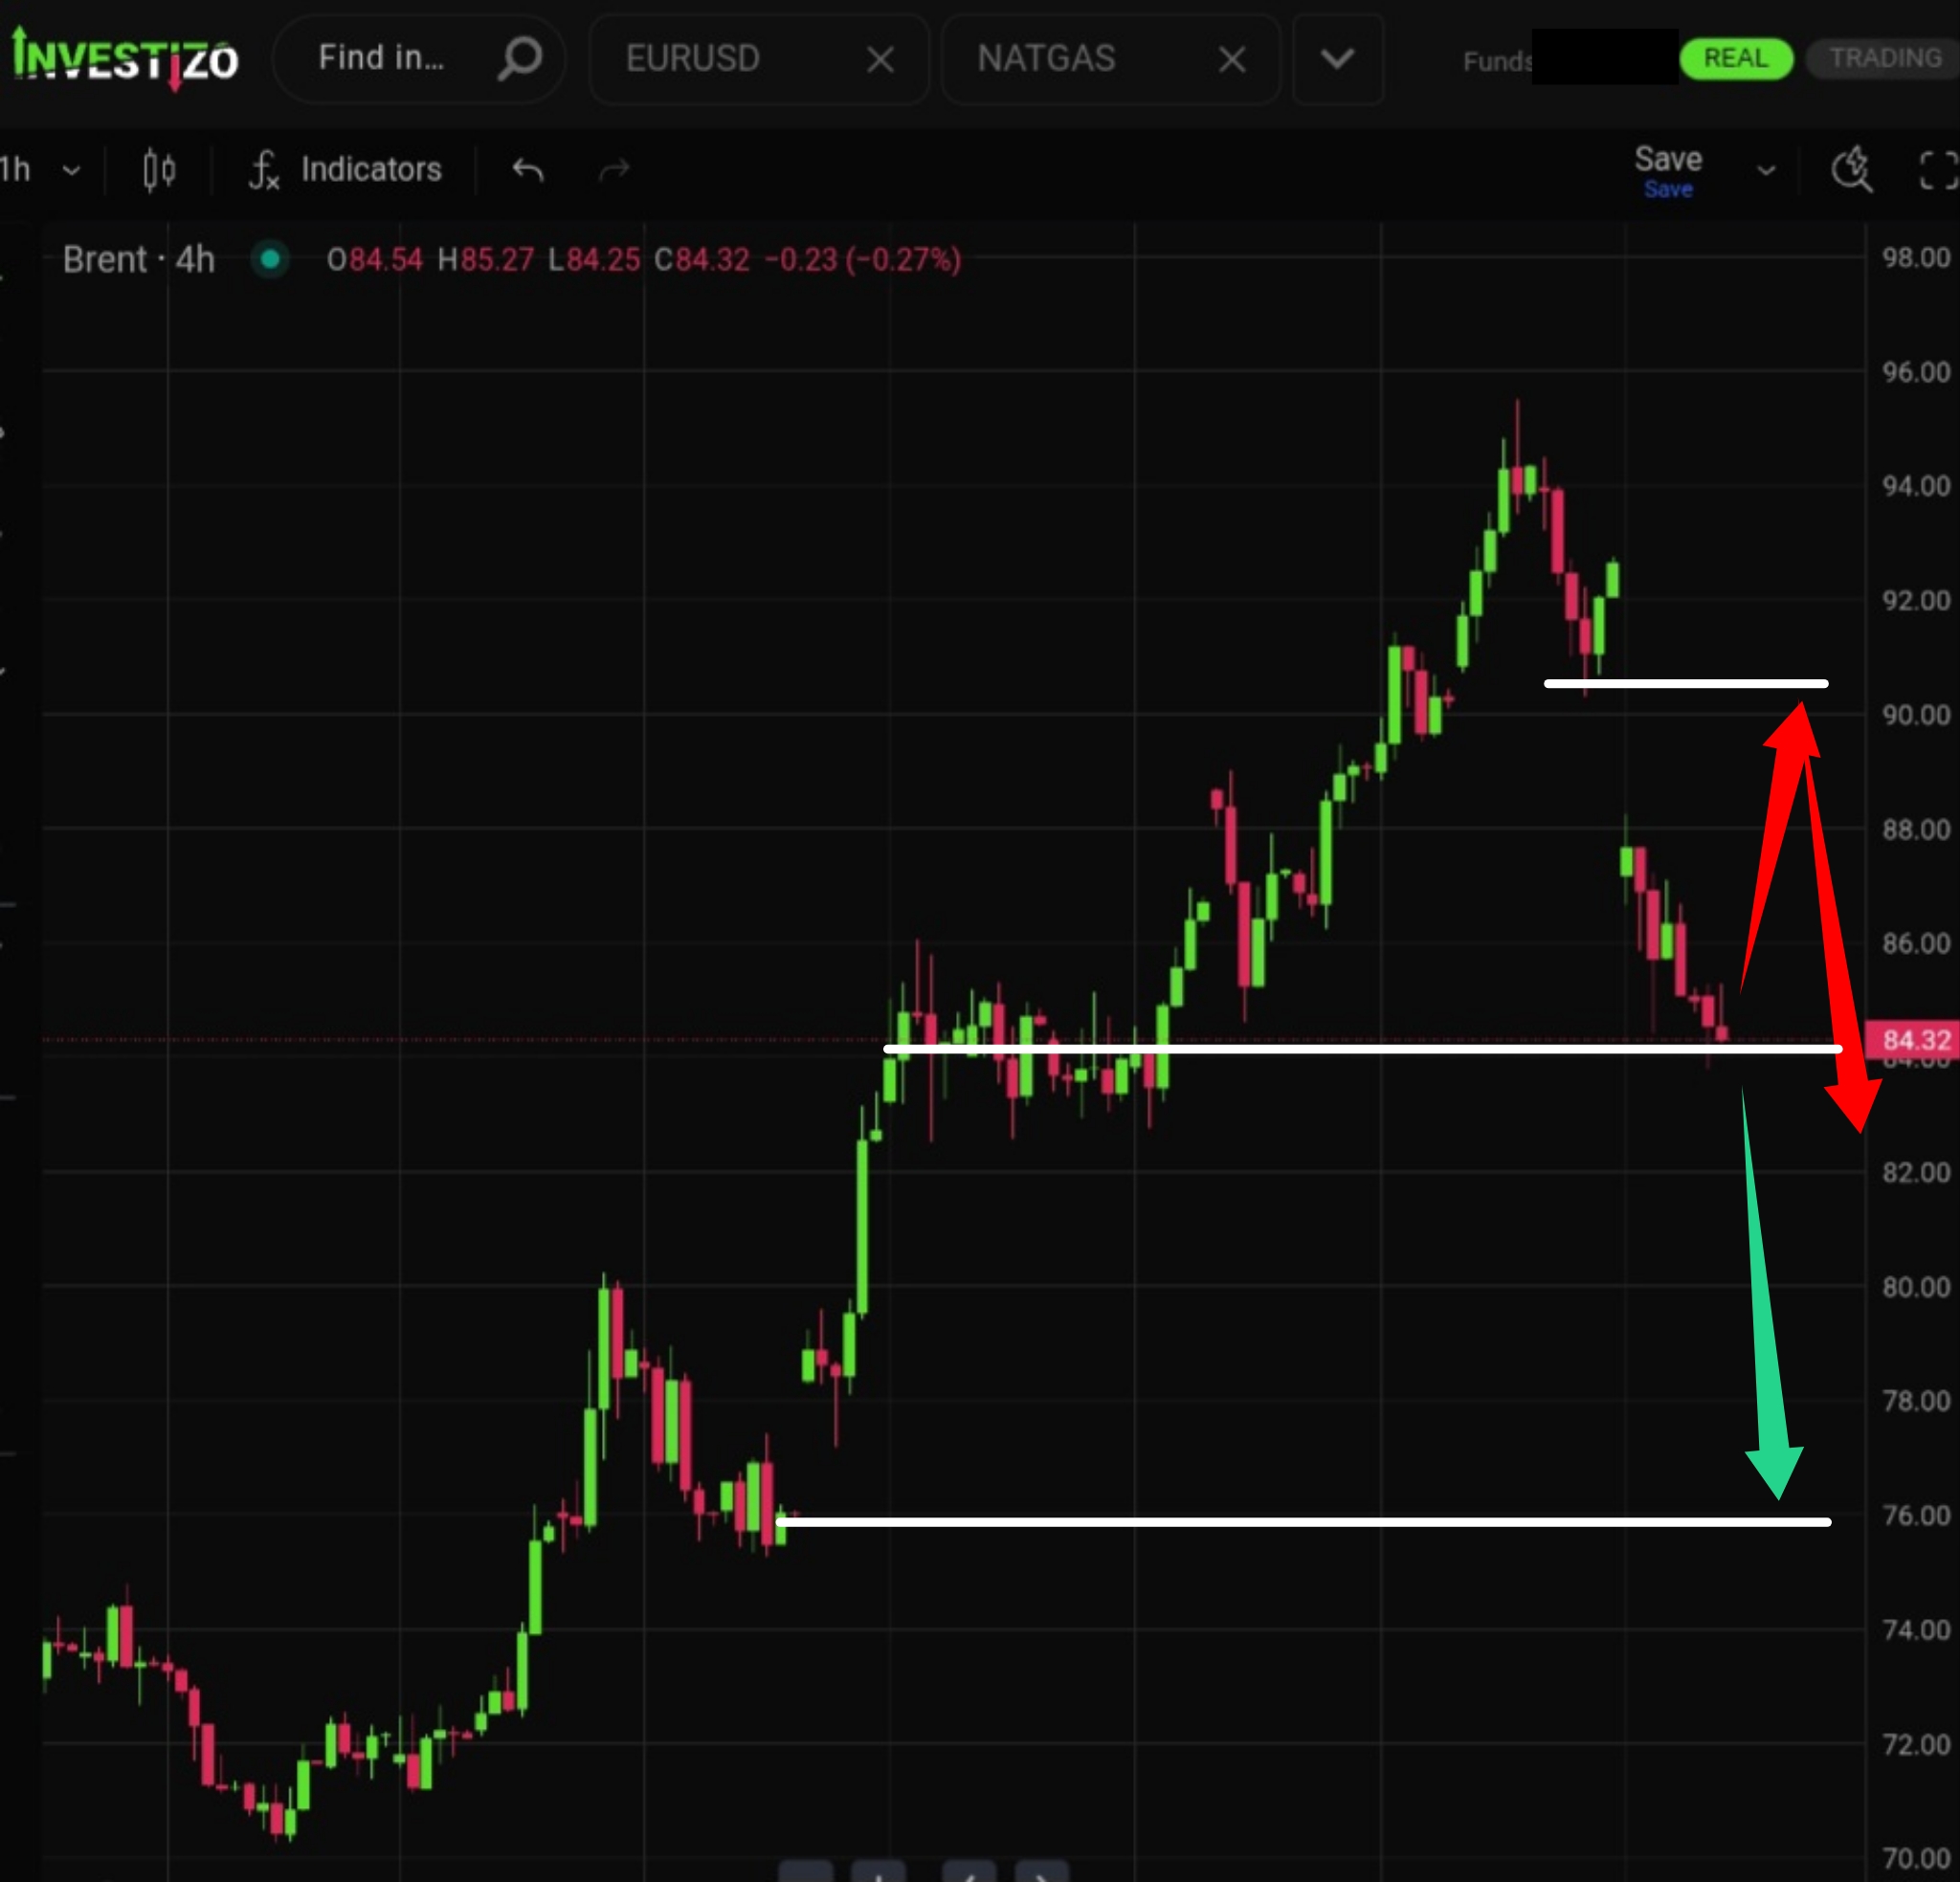
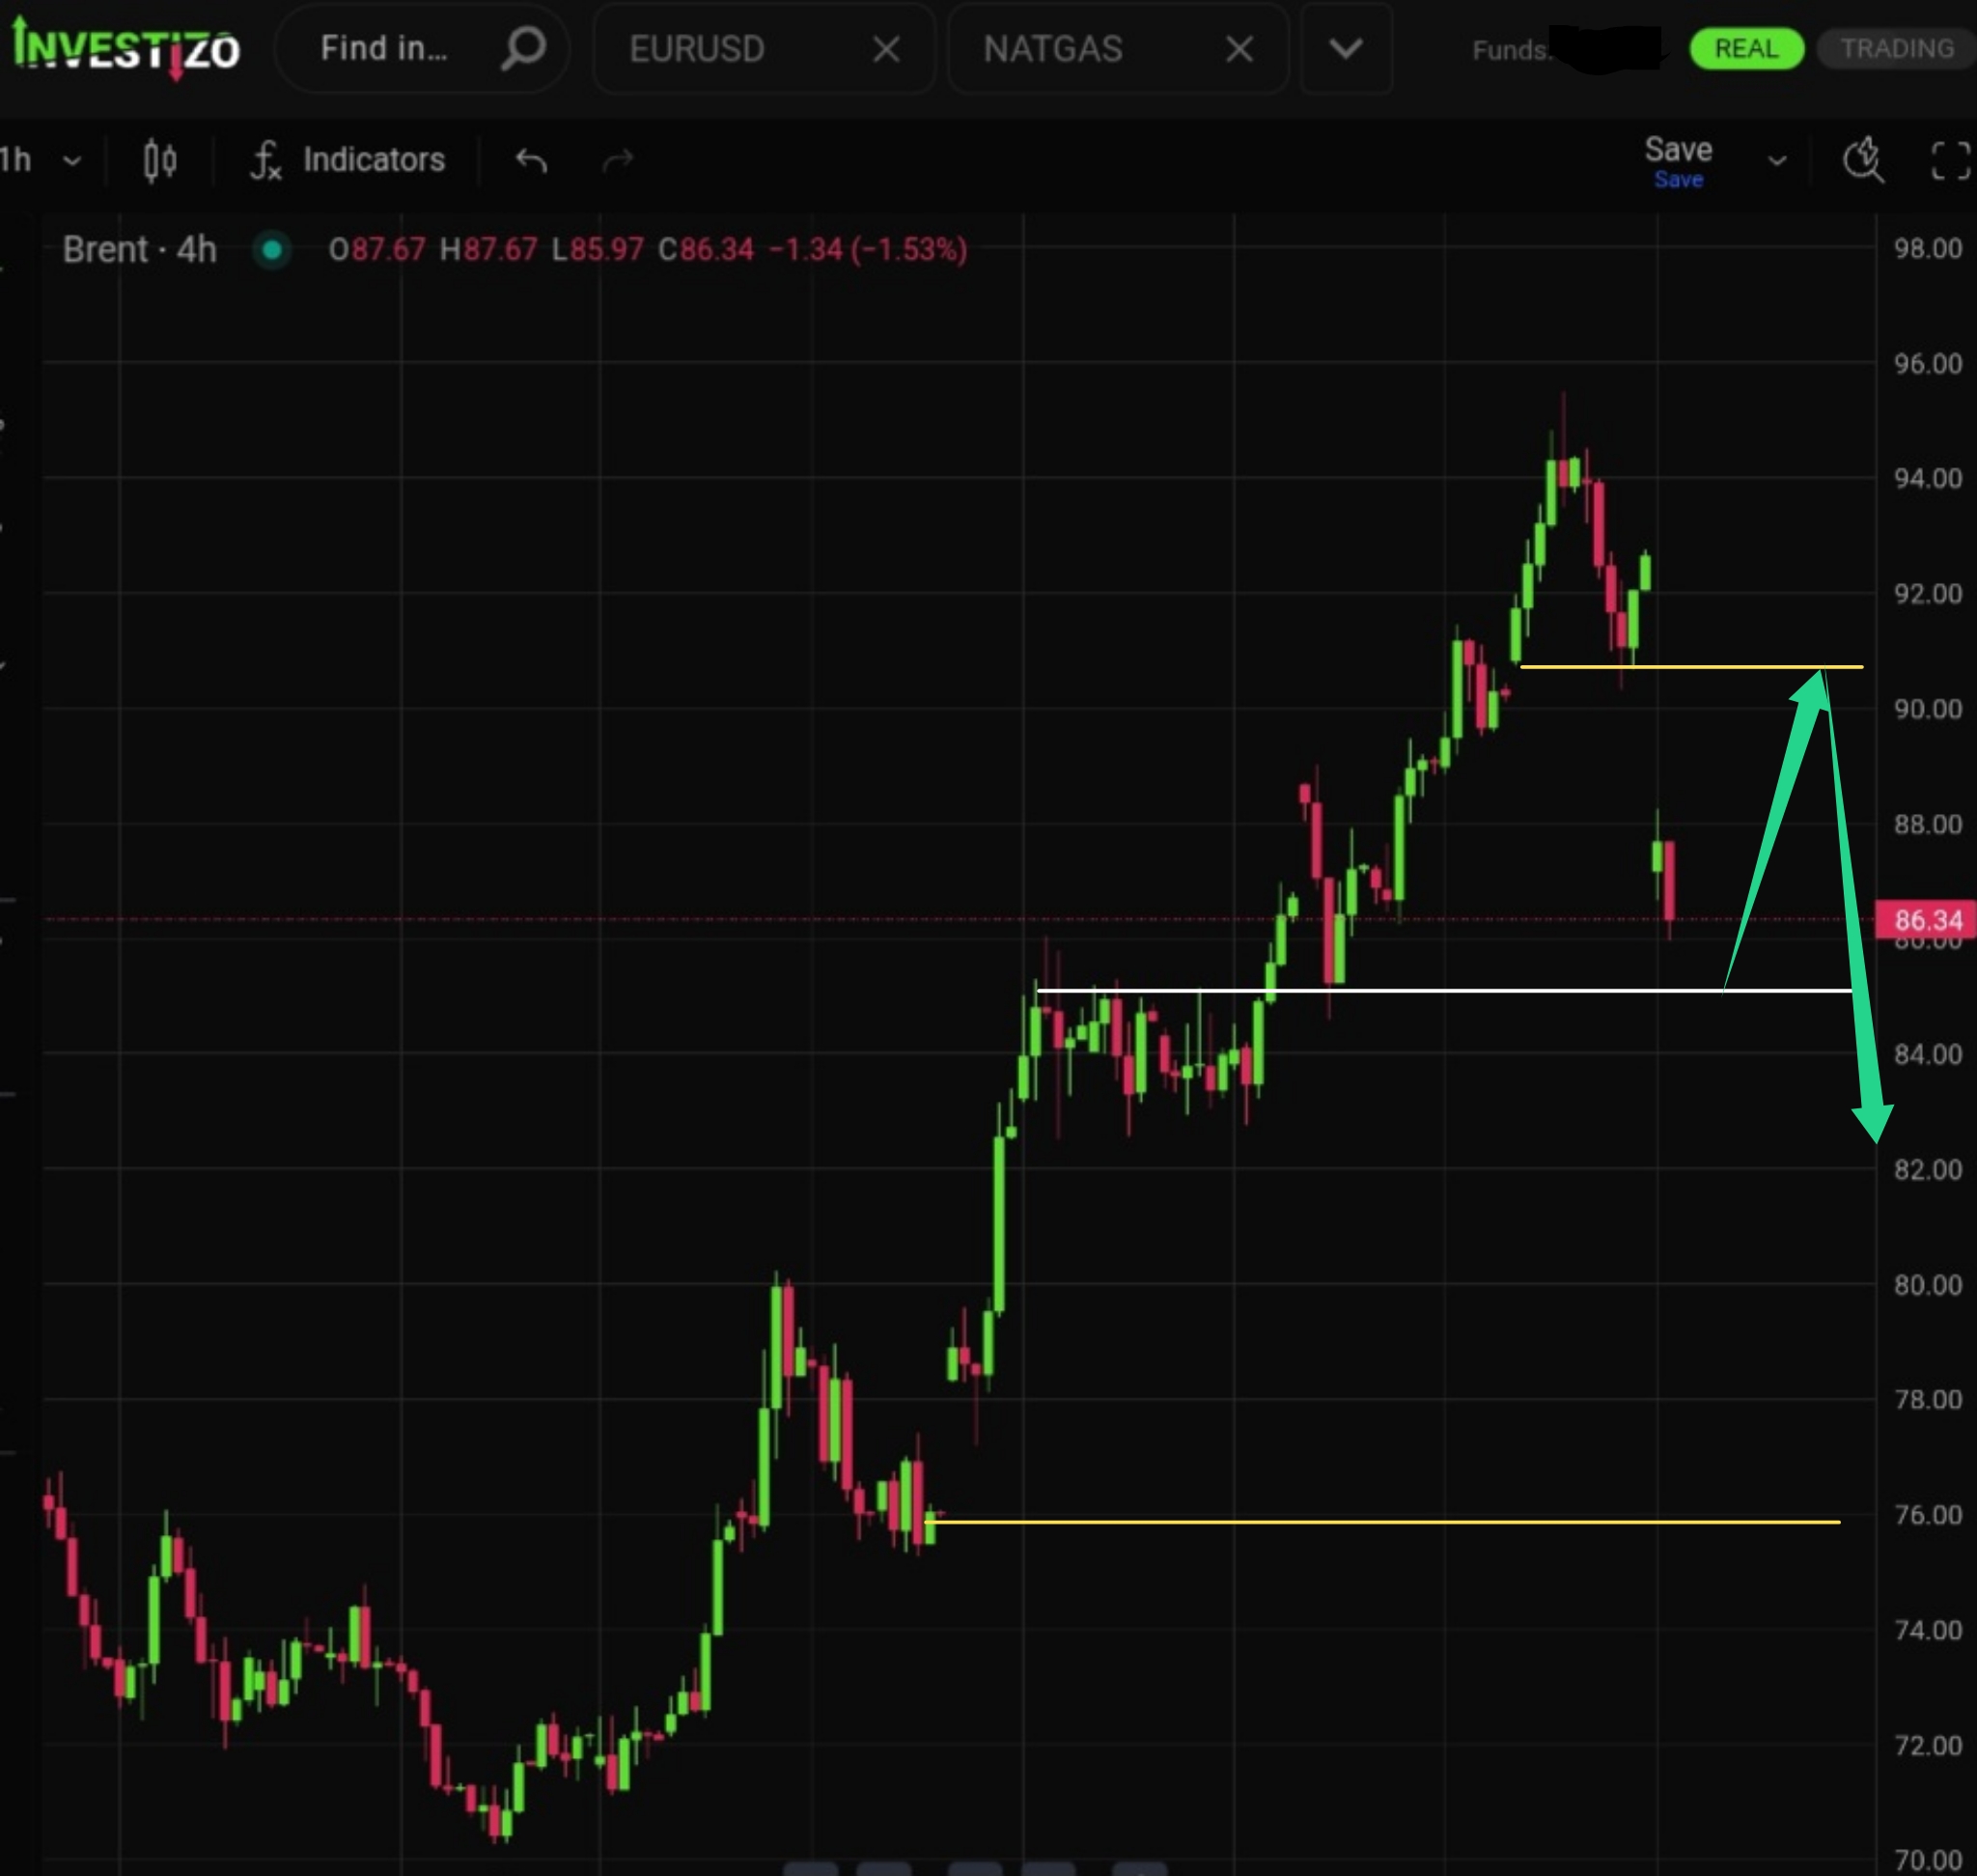
Brent Crude trades at 84.32 this Tuesday morning, as a fragile diplomatic pause unravels following the collapse of mediated negotiations in Islamabad.
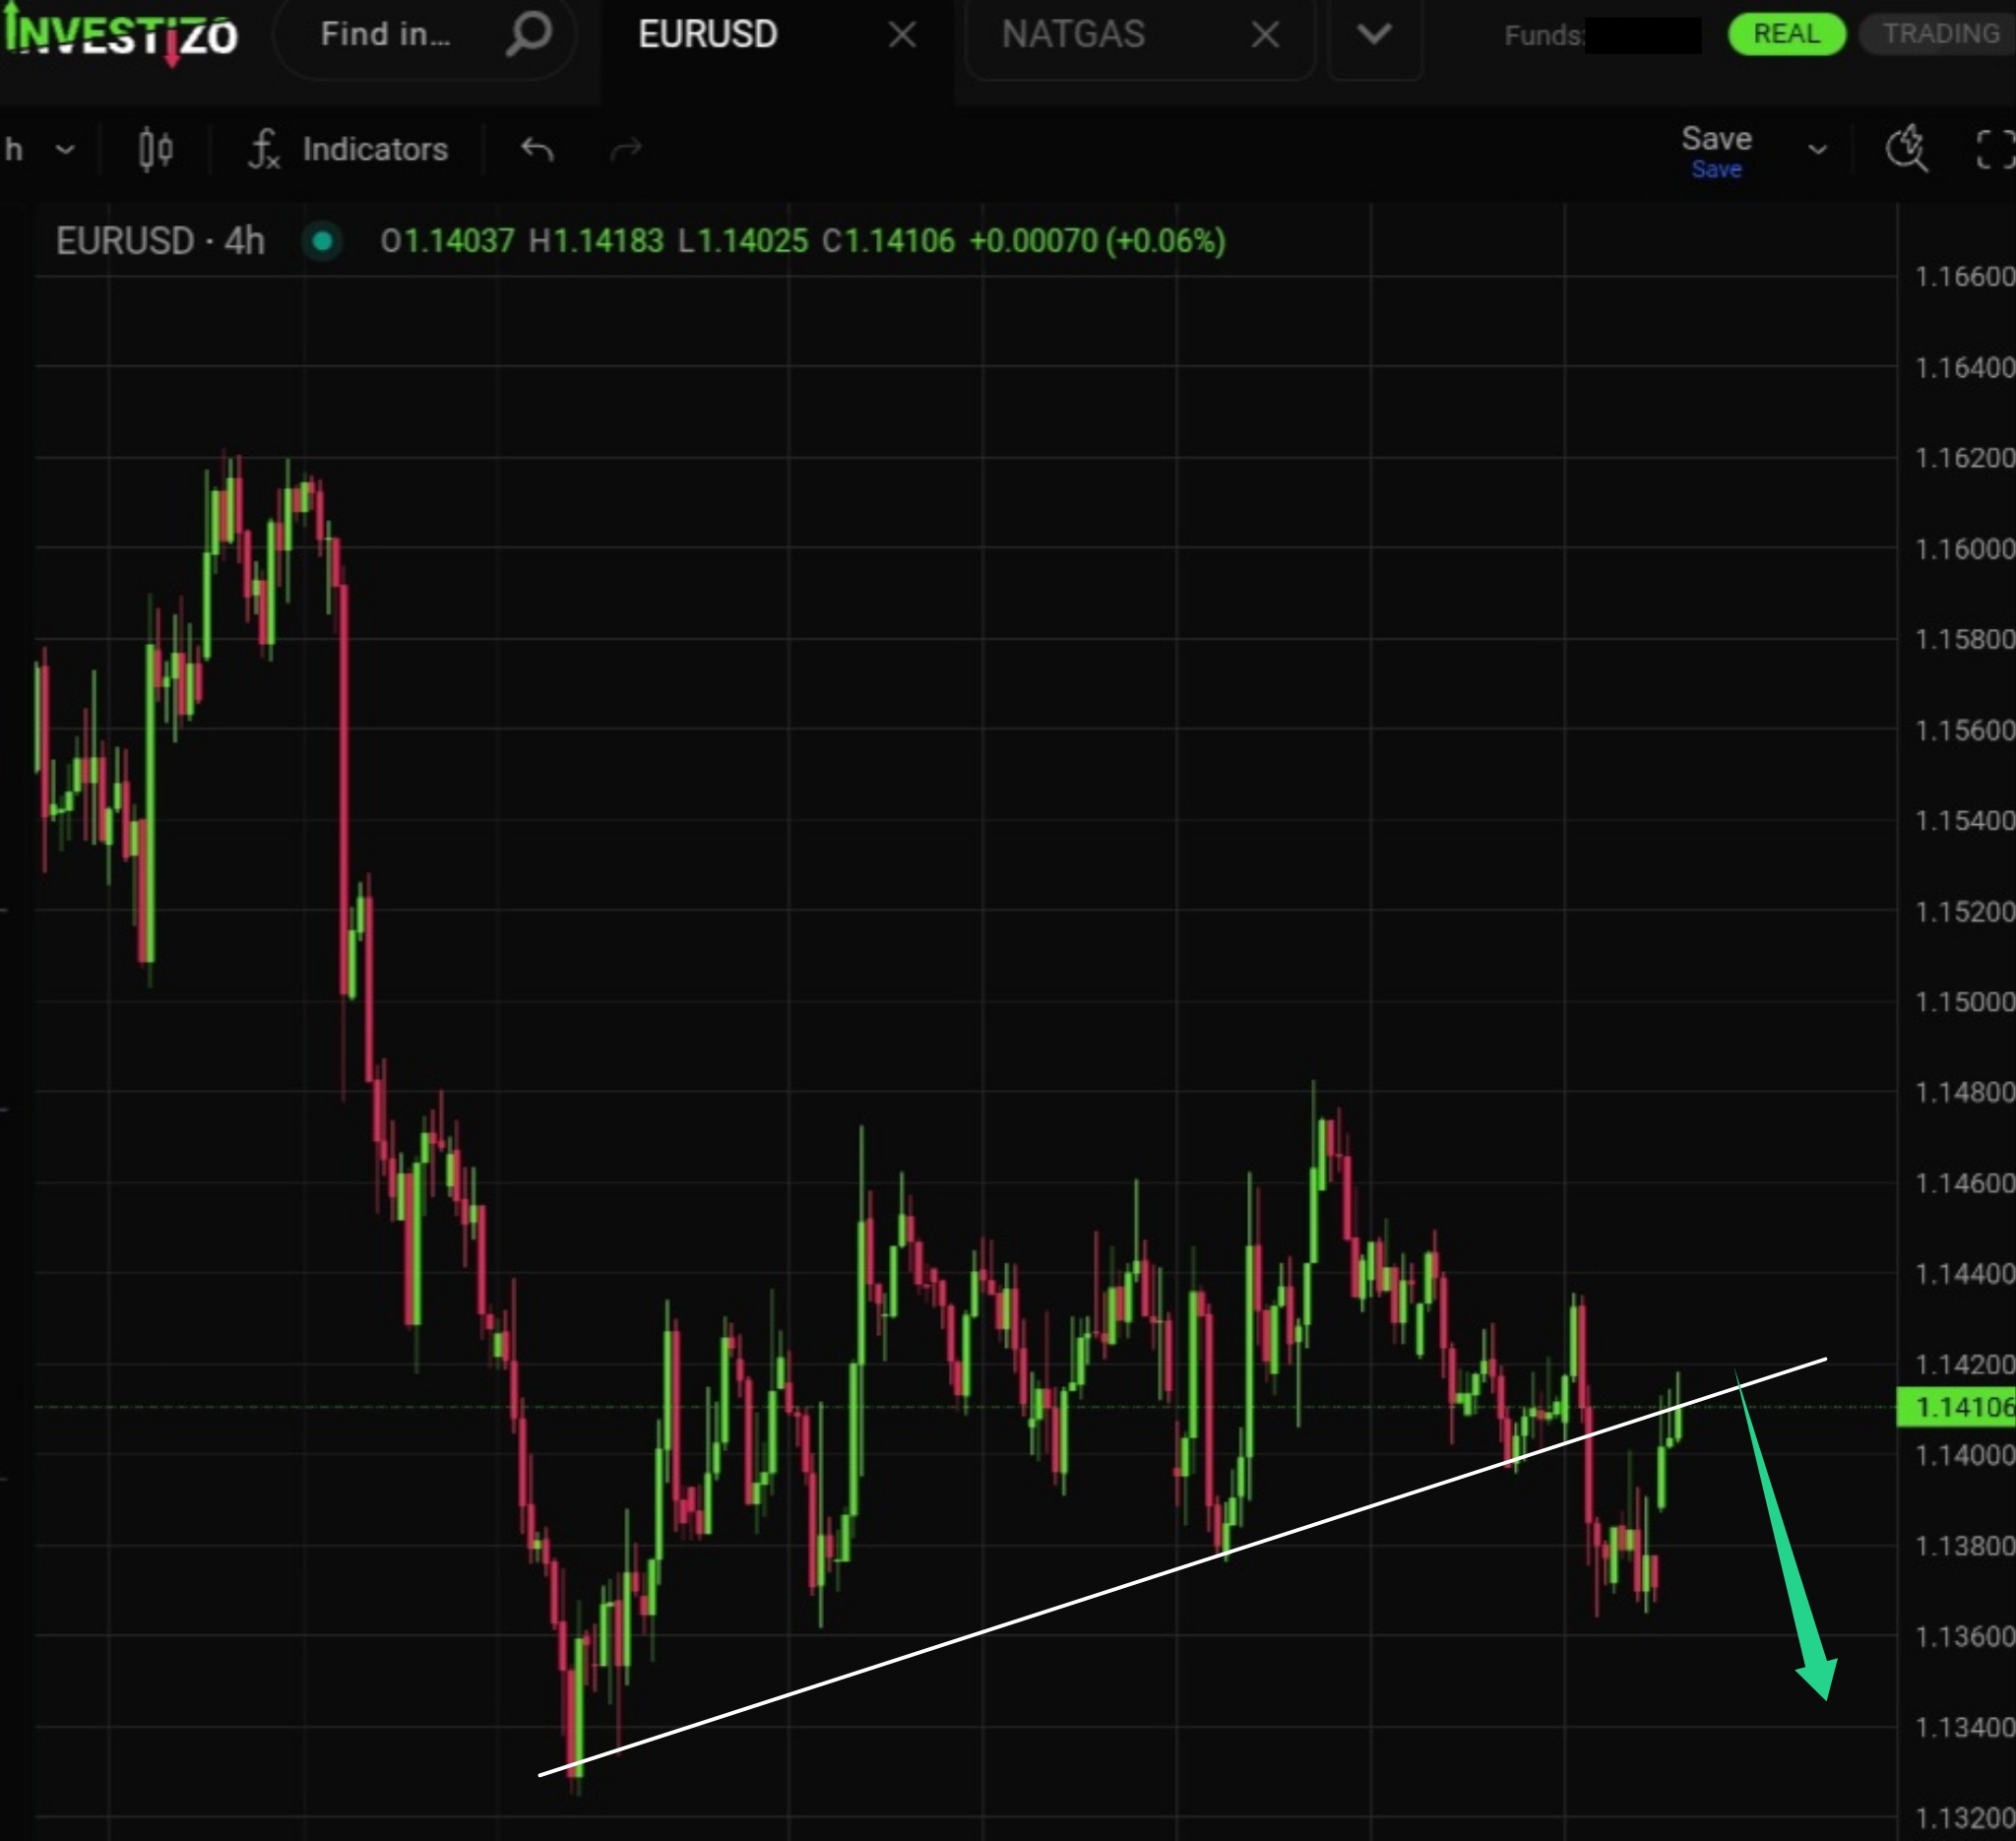
GBP/USD is currently consolidating near a key slanted support on the H1 chart, with the setup increasingly favoring a downside resolution.
We continue to monitor the development within the “megaphone” (broadening formation) pattern, which has been working flawlessly so far.
The pair is repeating the pattern of a chaotically expanding megaphone formation, which has been observed previously.
The upward technical correction has reached its optimal height.
Bitcoin (BTC/USD) trades at 65,490 this Monday morning, finding temporary stabilization following reports of a diplomatic pause between the US and Iran.
Brent Crude trades at 86.34 this Monday morning, dropping roughly 10% across the past two trading sessions as emerging diplomatic channels trigger a sharp unwinding of the geopolitical risk premium.
Another bullish continuation pattern is forming — a classic “Bull Flag.”
The medium-term structure remains bullish for now, with consistently higher local lows and renewed highs.