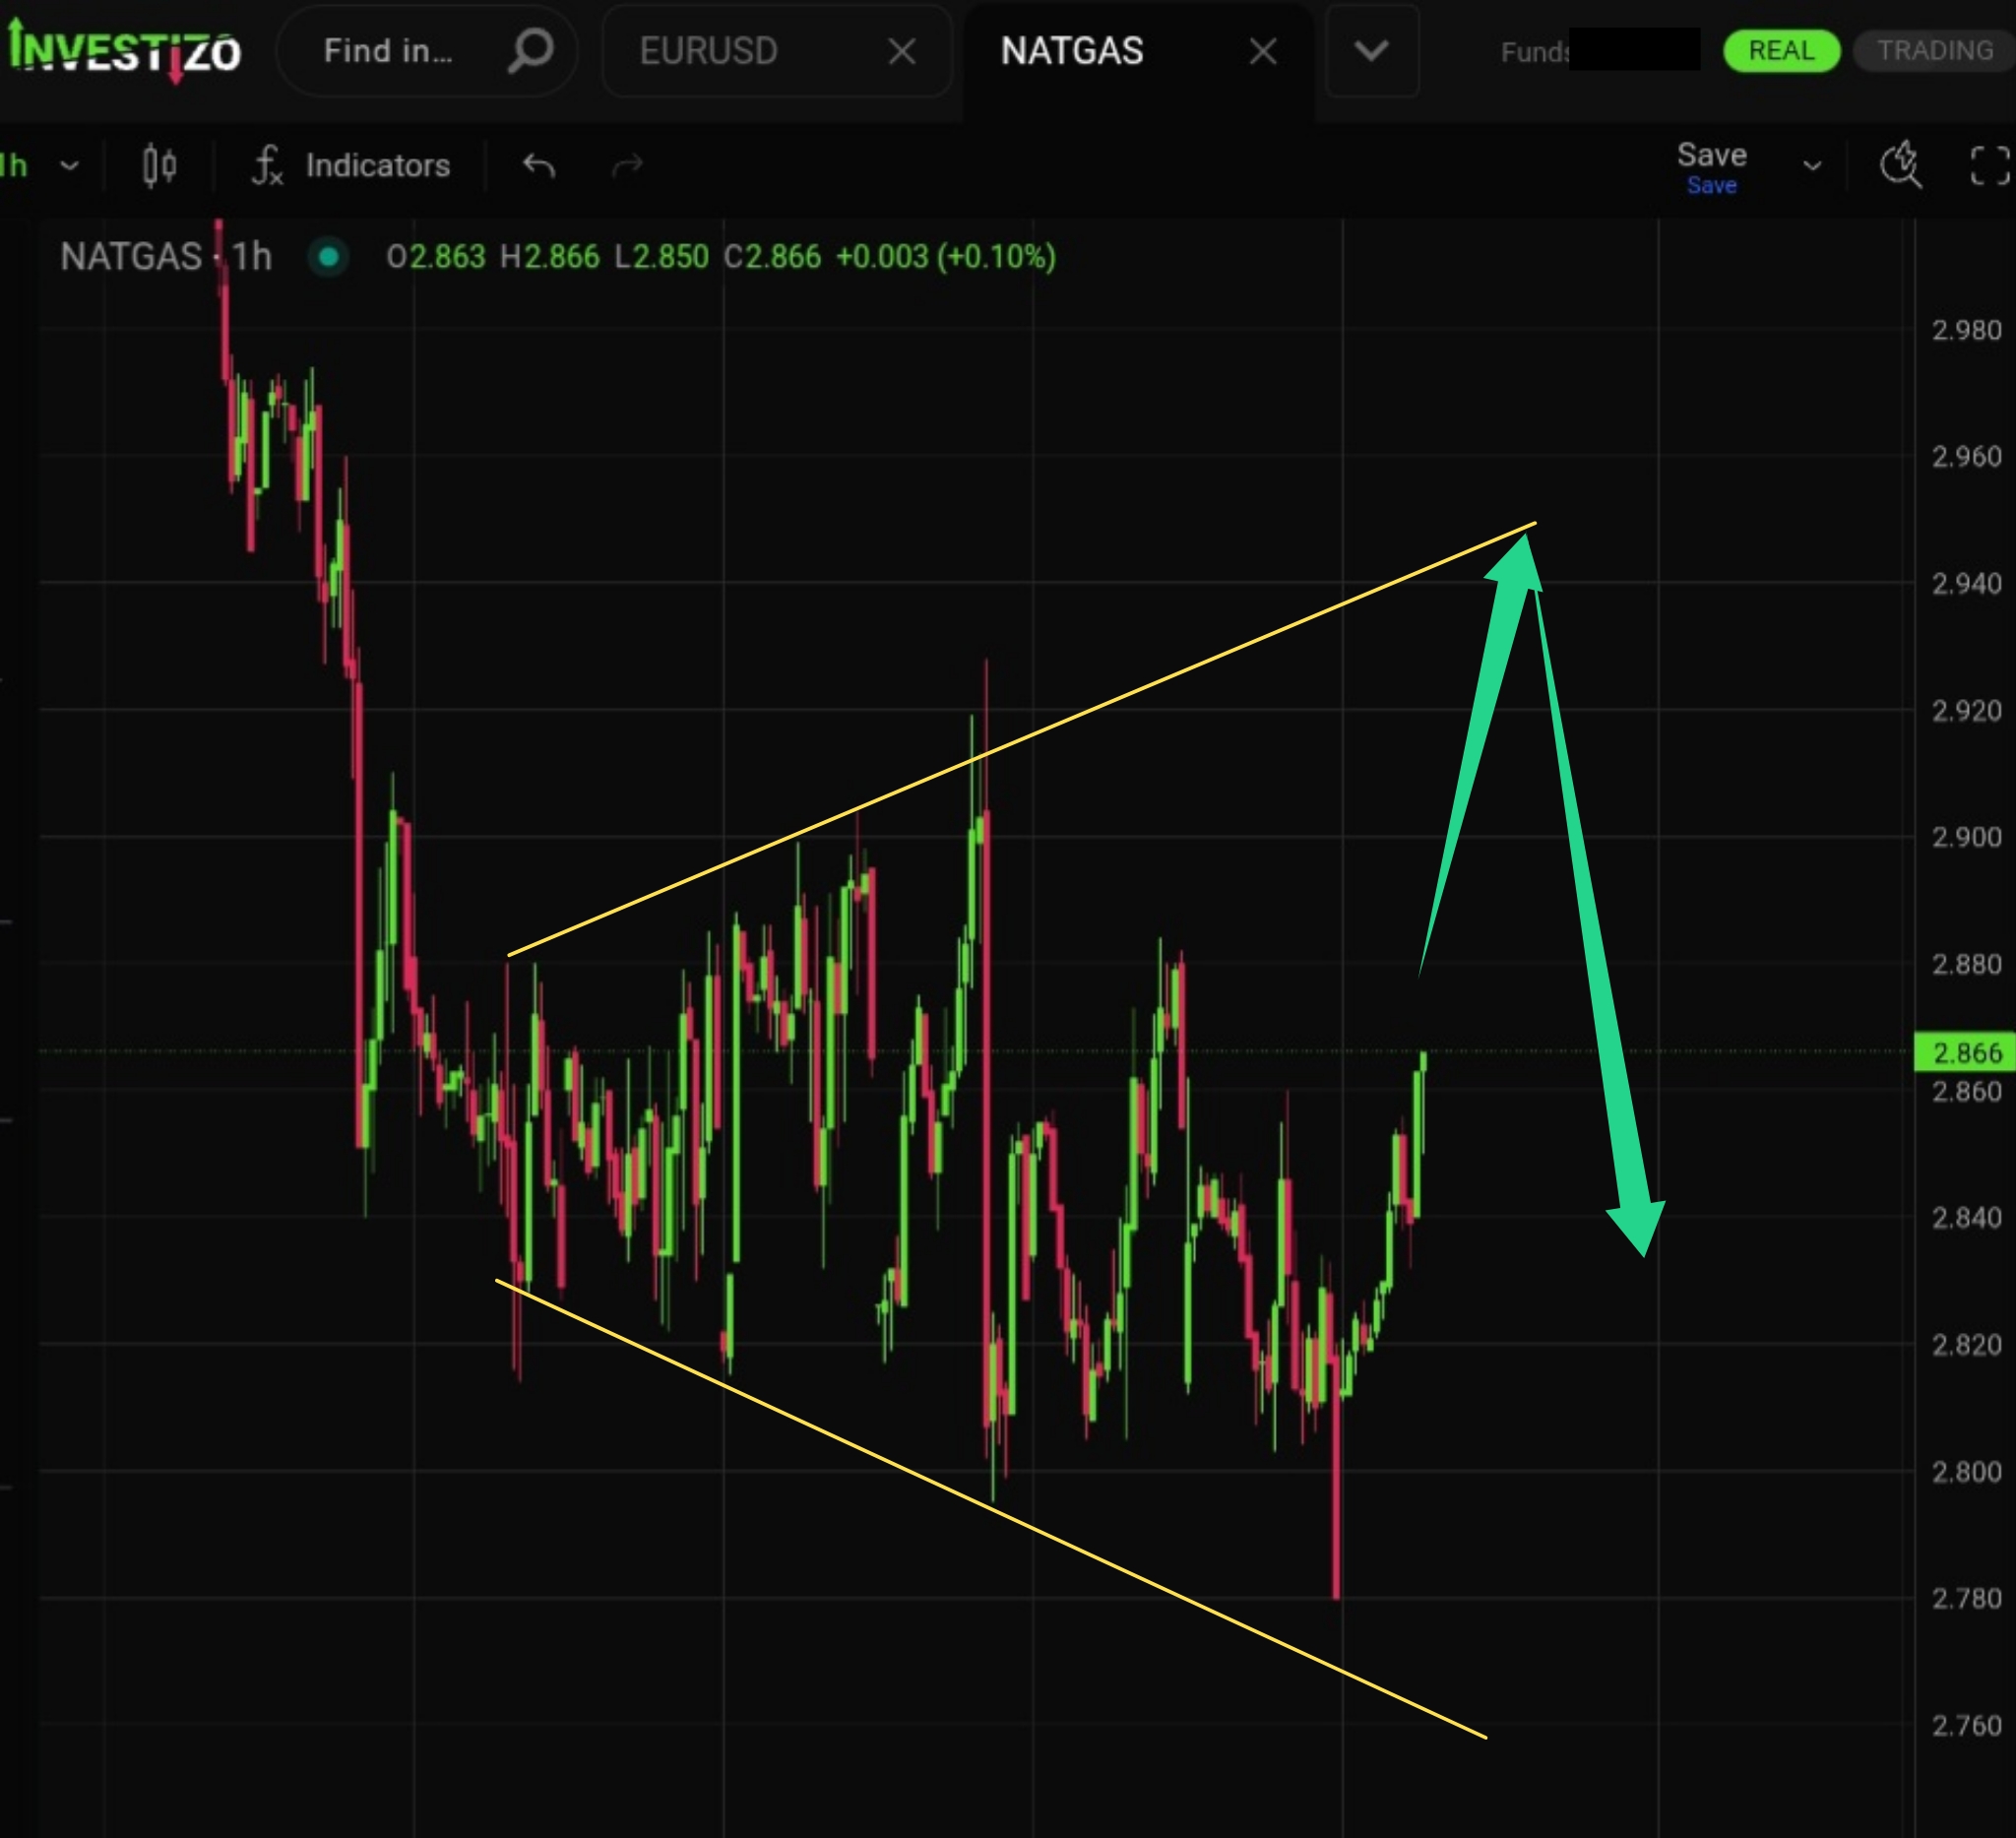
Natural Gas, Technical Analysis – H1
The formation of an expanding “megaphone” (broadening wedge) pattern is being confirmed.
Investizo LTD. Business company number 25432 BC 2019
Suite 305, Griffith Corporate Centre,
P.O. Box 1510, Beachmont, Kingstown,
St. Vincent and the Grenadines
DUNS 817053497
Phone:+996312610515
E-mail: [email protected]
© 2019-2026 Investizo 18+ Todos los derechos reservados
Advertencia de riesgo: los CFD son productos financieros complejos que se negocian con margen. El comercio de CFD es arriesgado y puede no ser adecuado para todos los inversores. Asegúrese de comprender los riesgos involucrados, ya que puede perder todo su capital invertido.
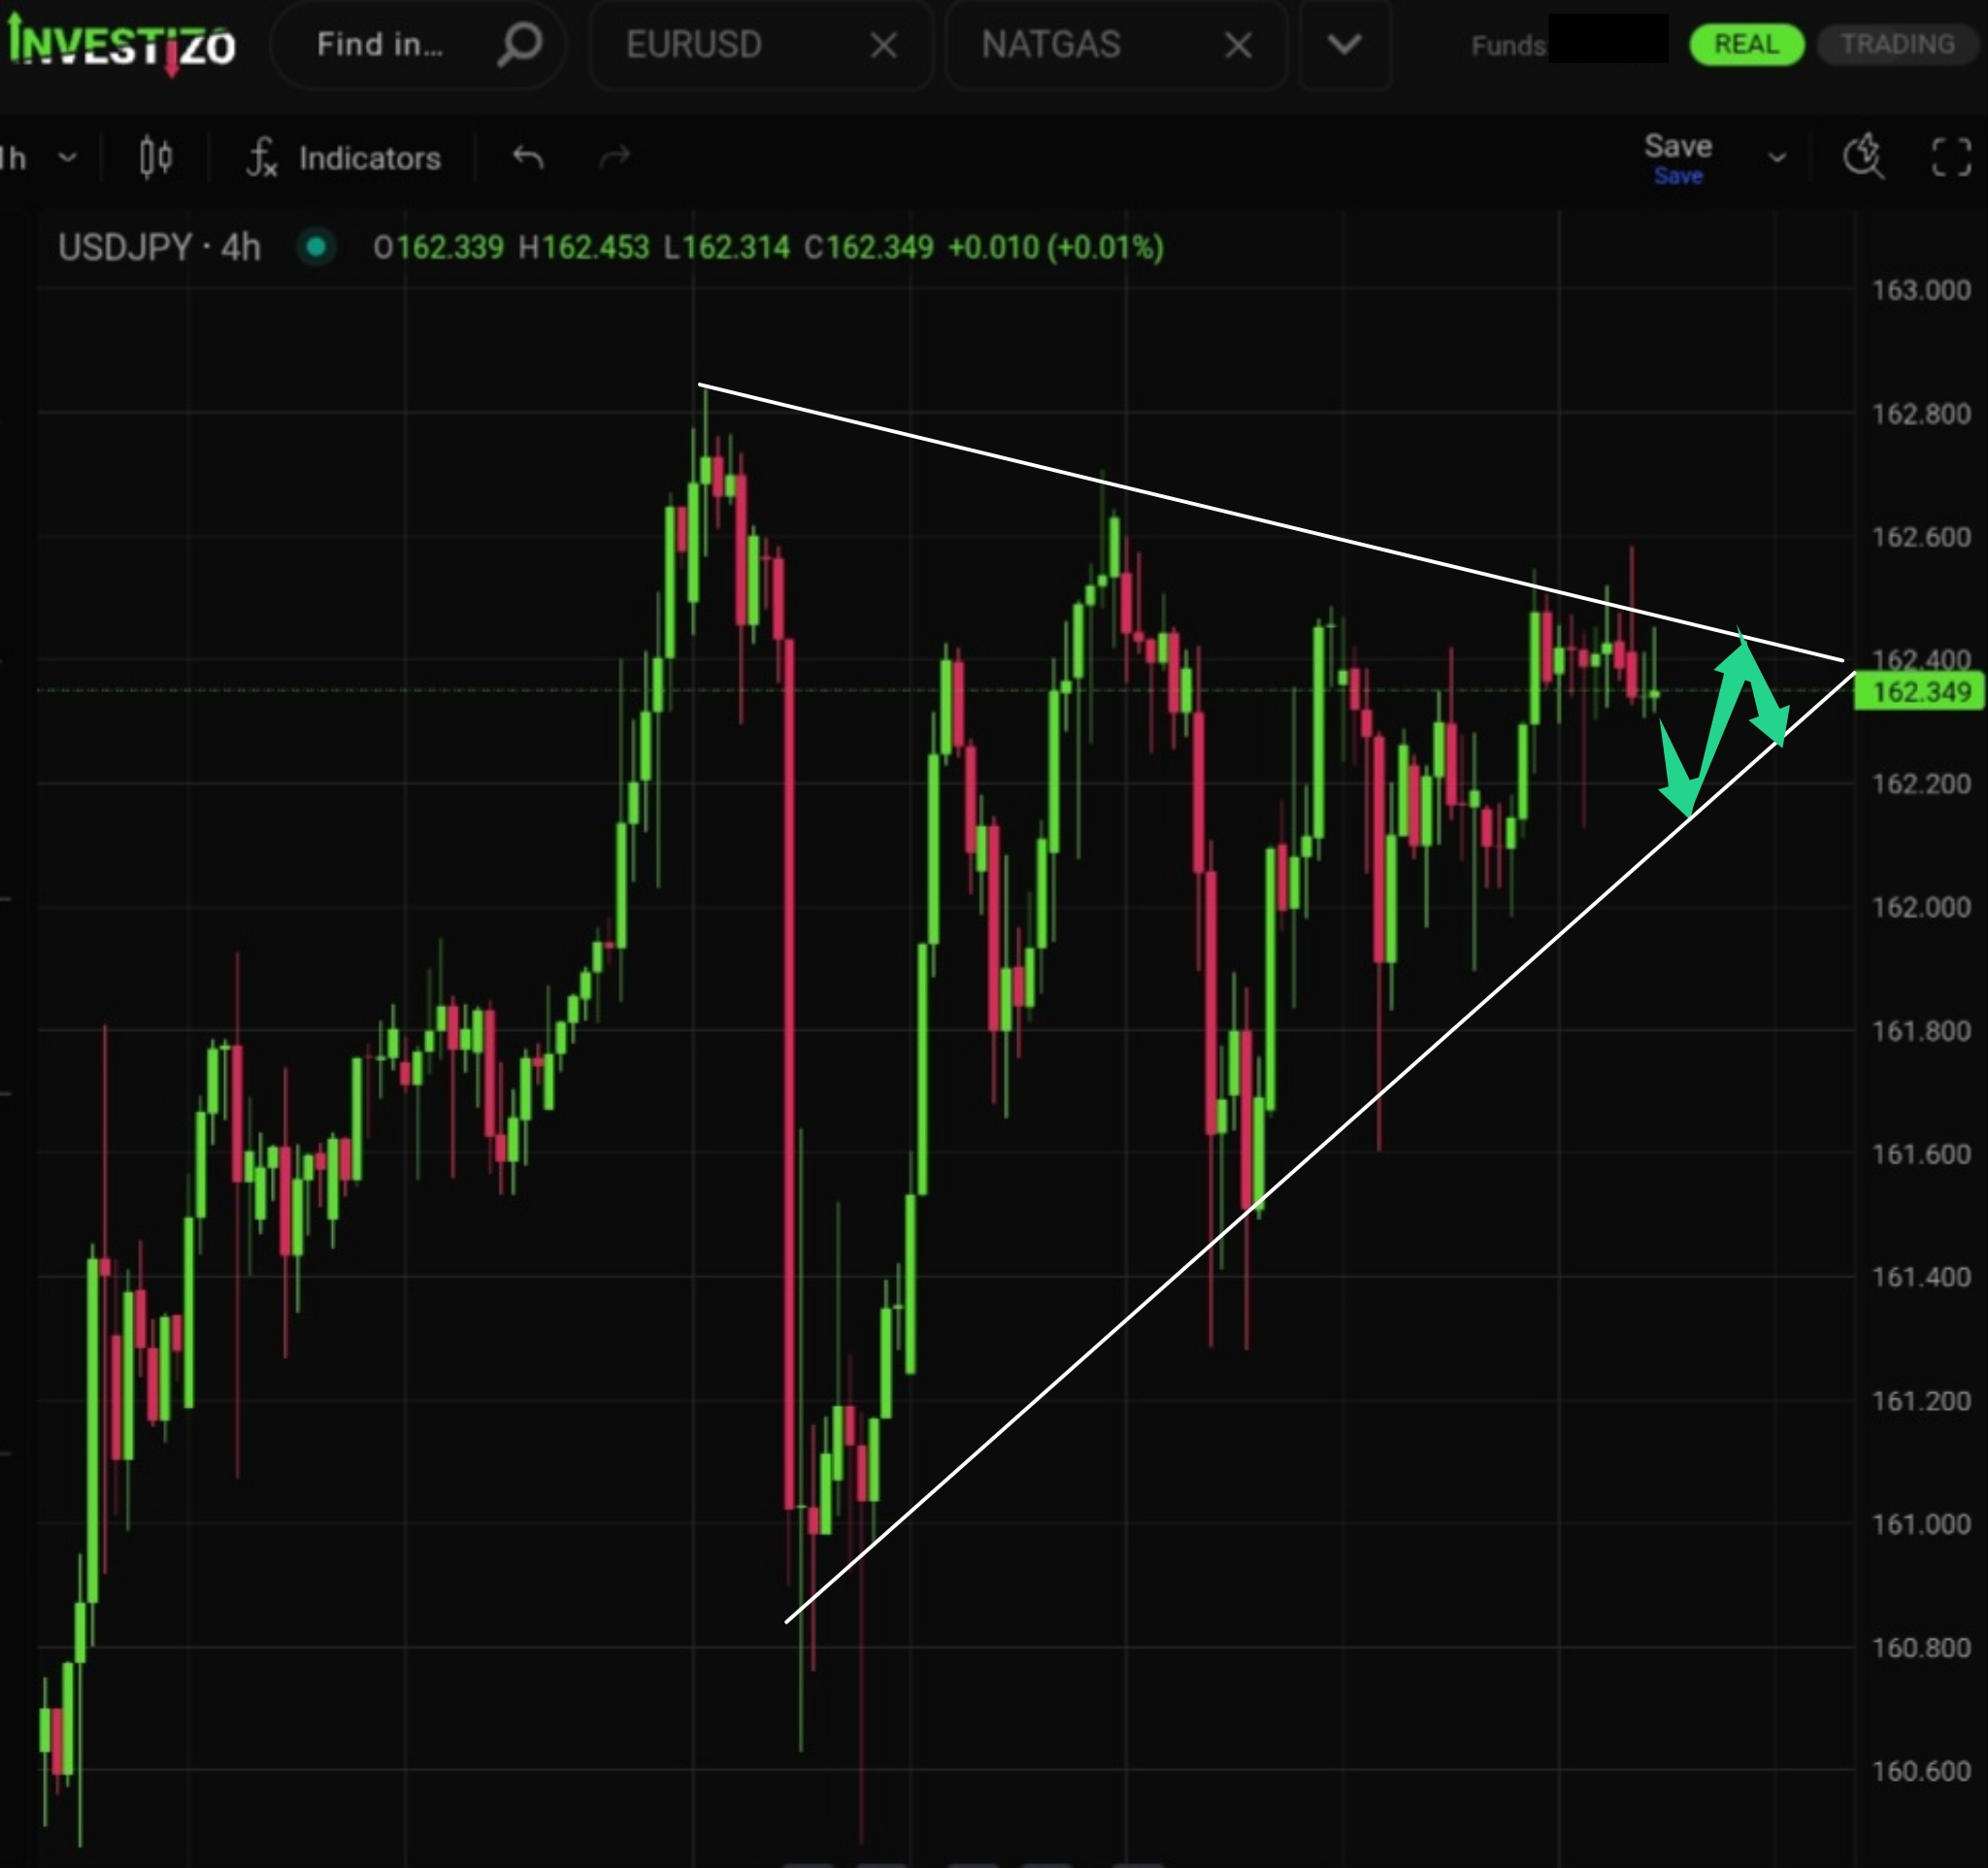
The formation of an expanding “megaphone” (broadening wedge) pattern is being confirmed.
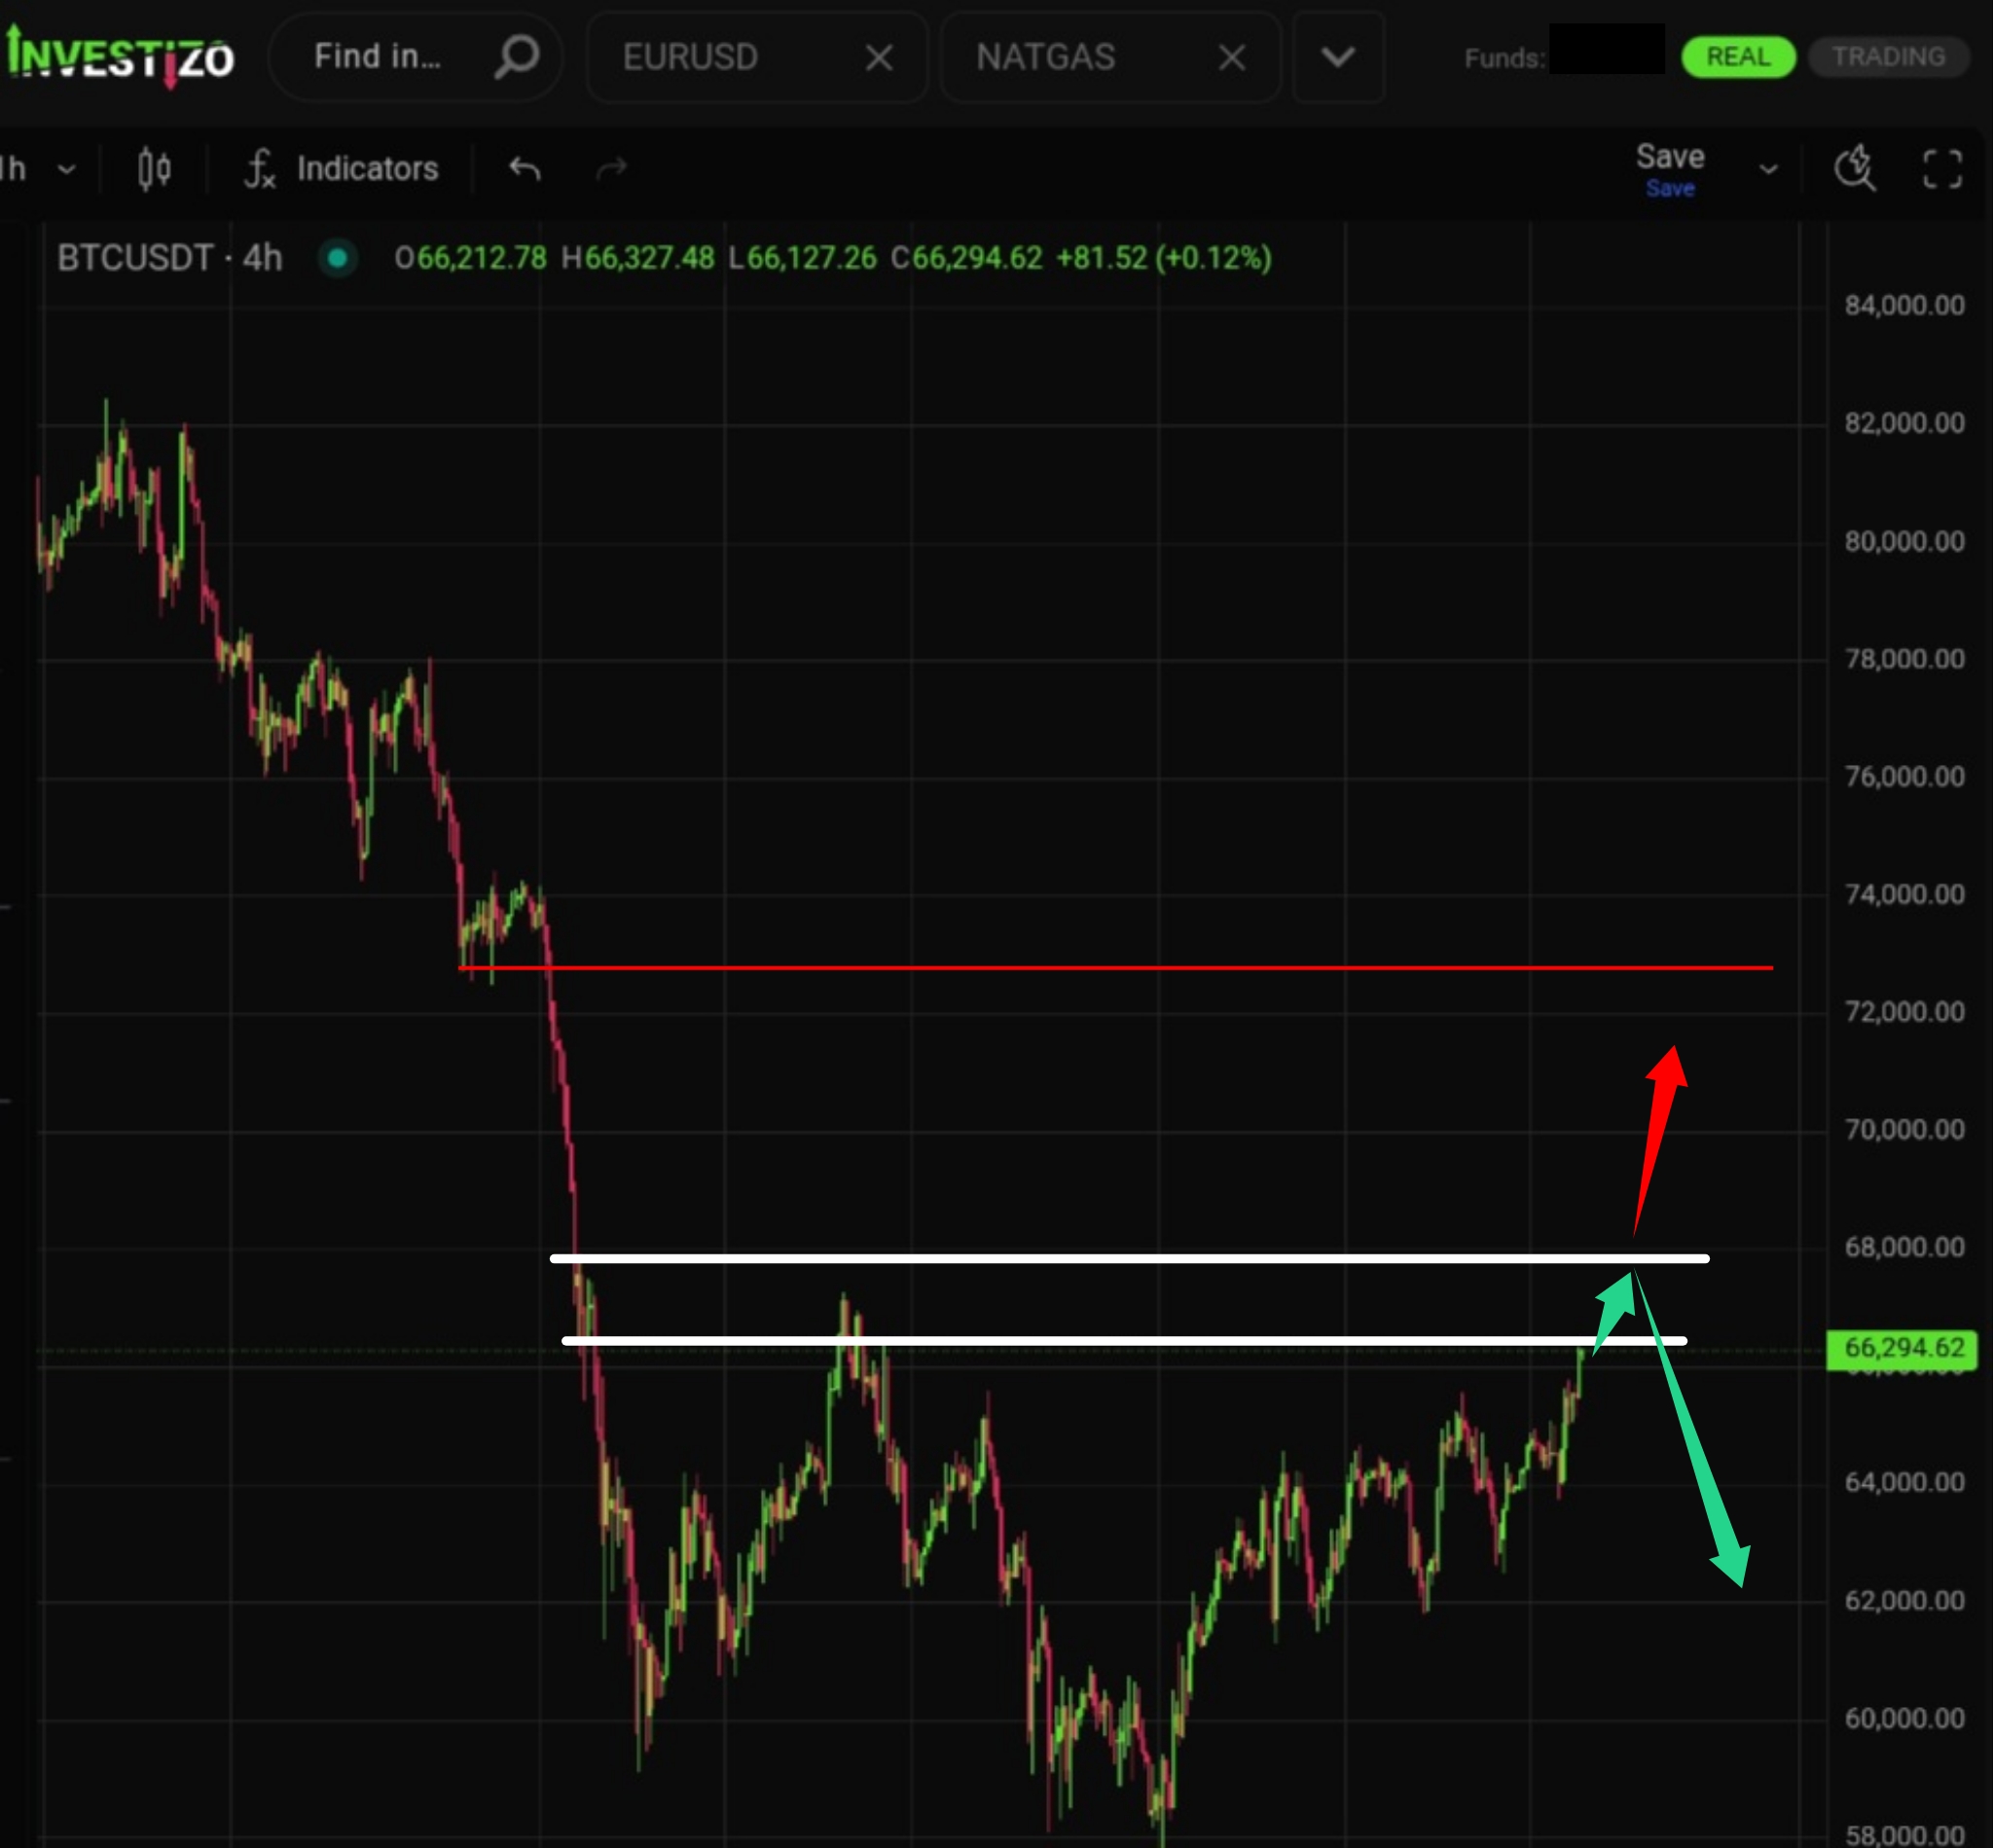
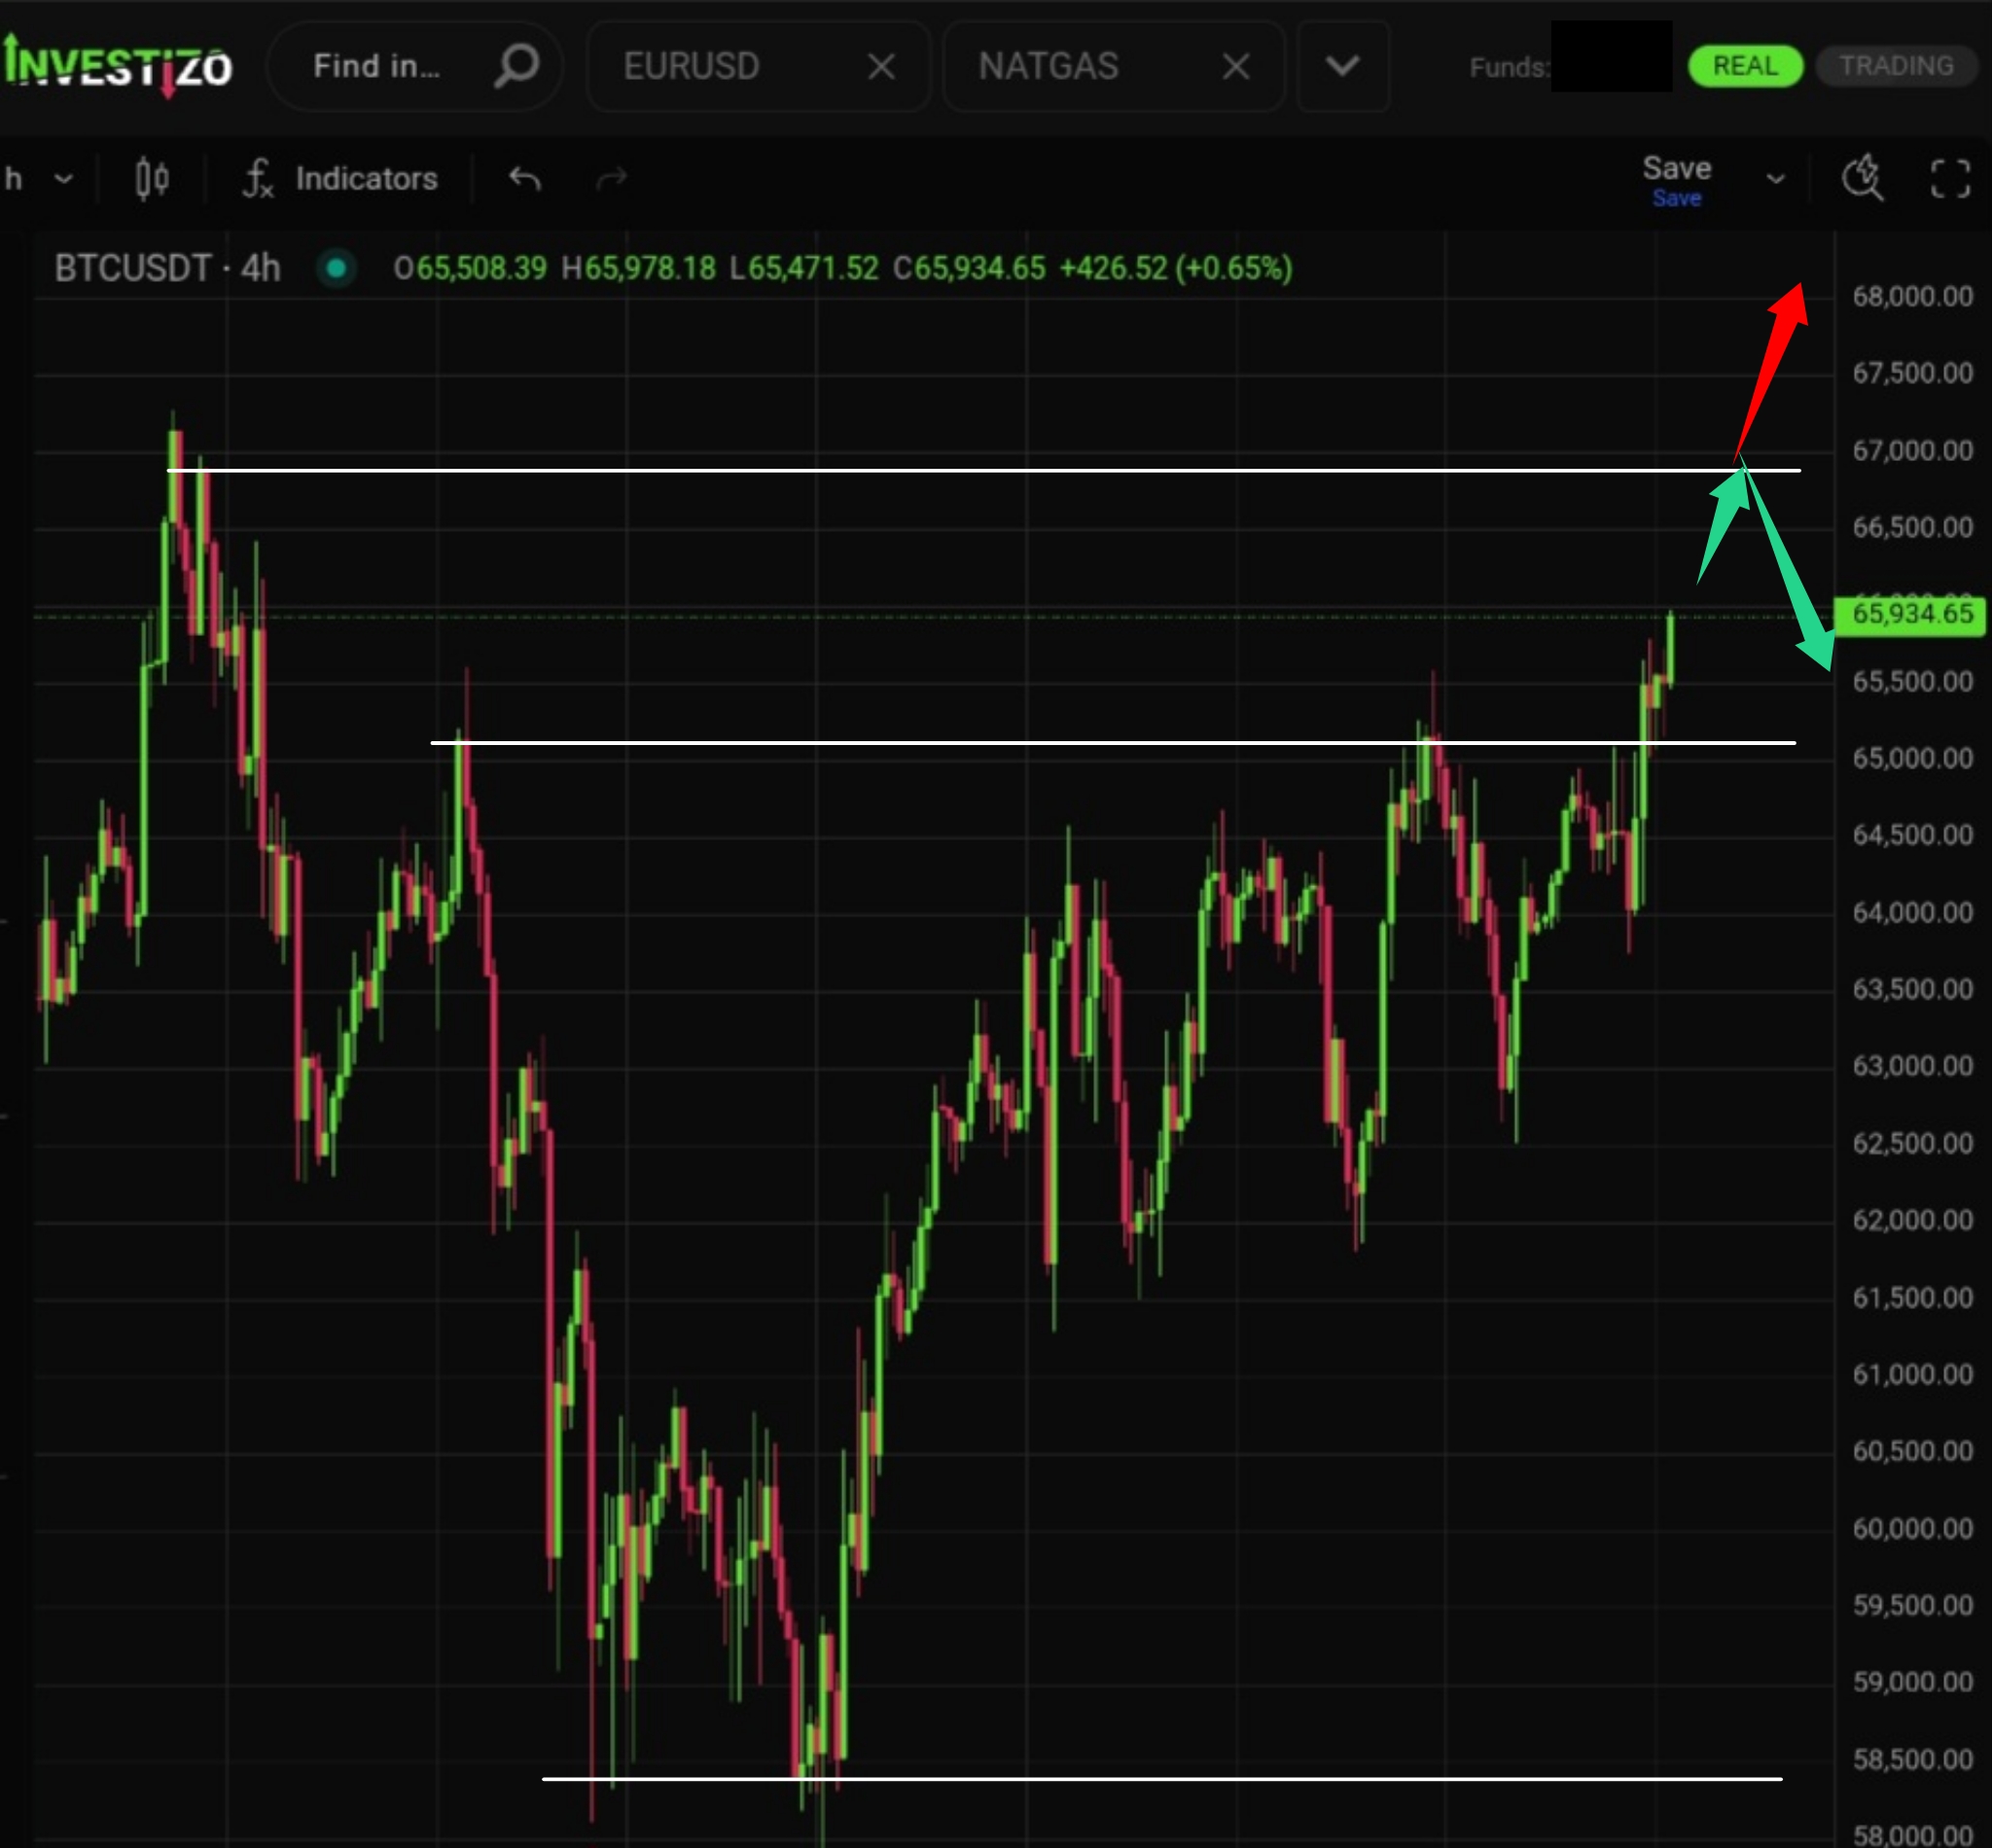
Bitcoin is approaching a critical resistance zone at $67,000–68,000. This area will largely determine the medium-term outlook.
The weakness of the bulls continues to be confirmed.
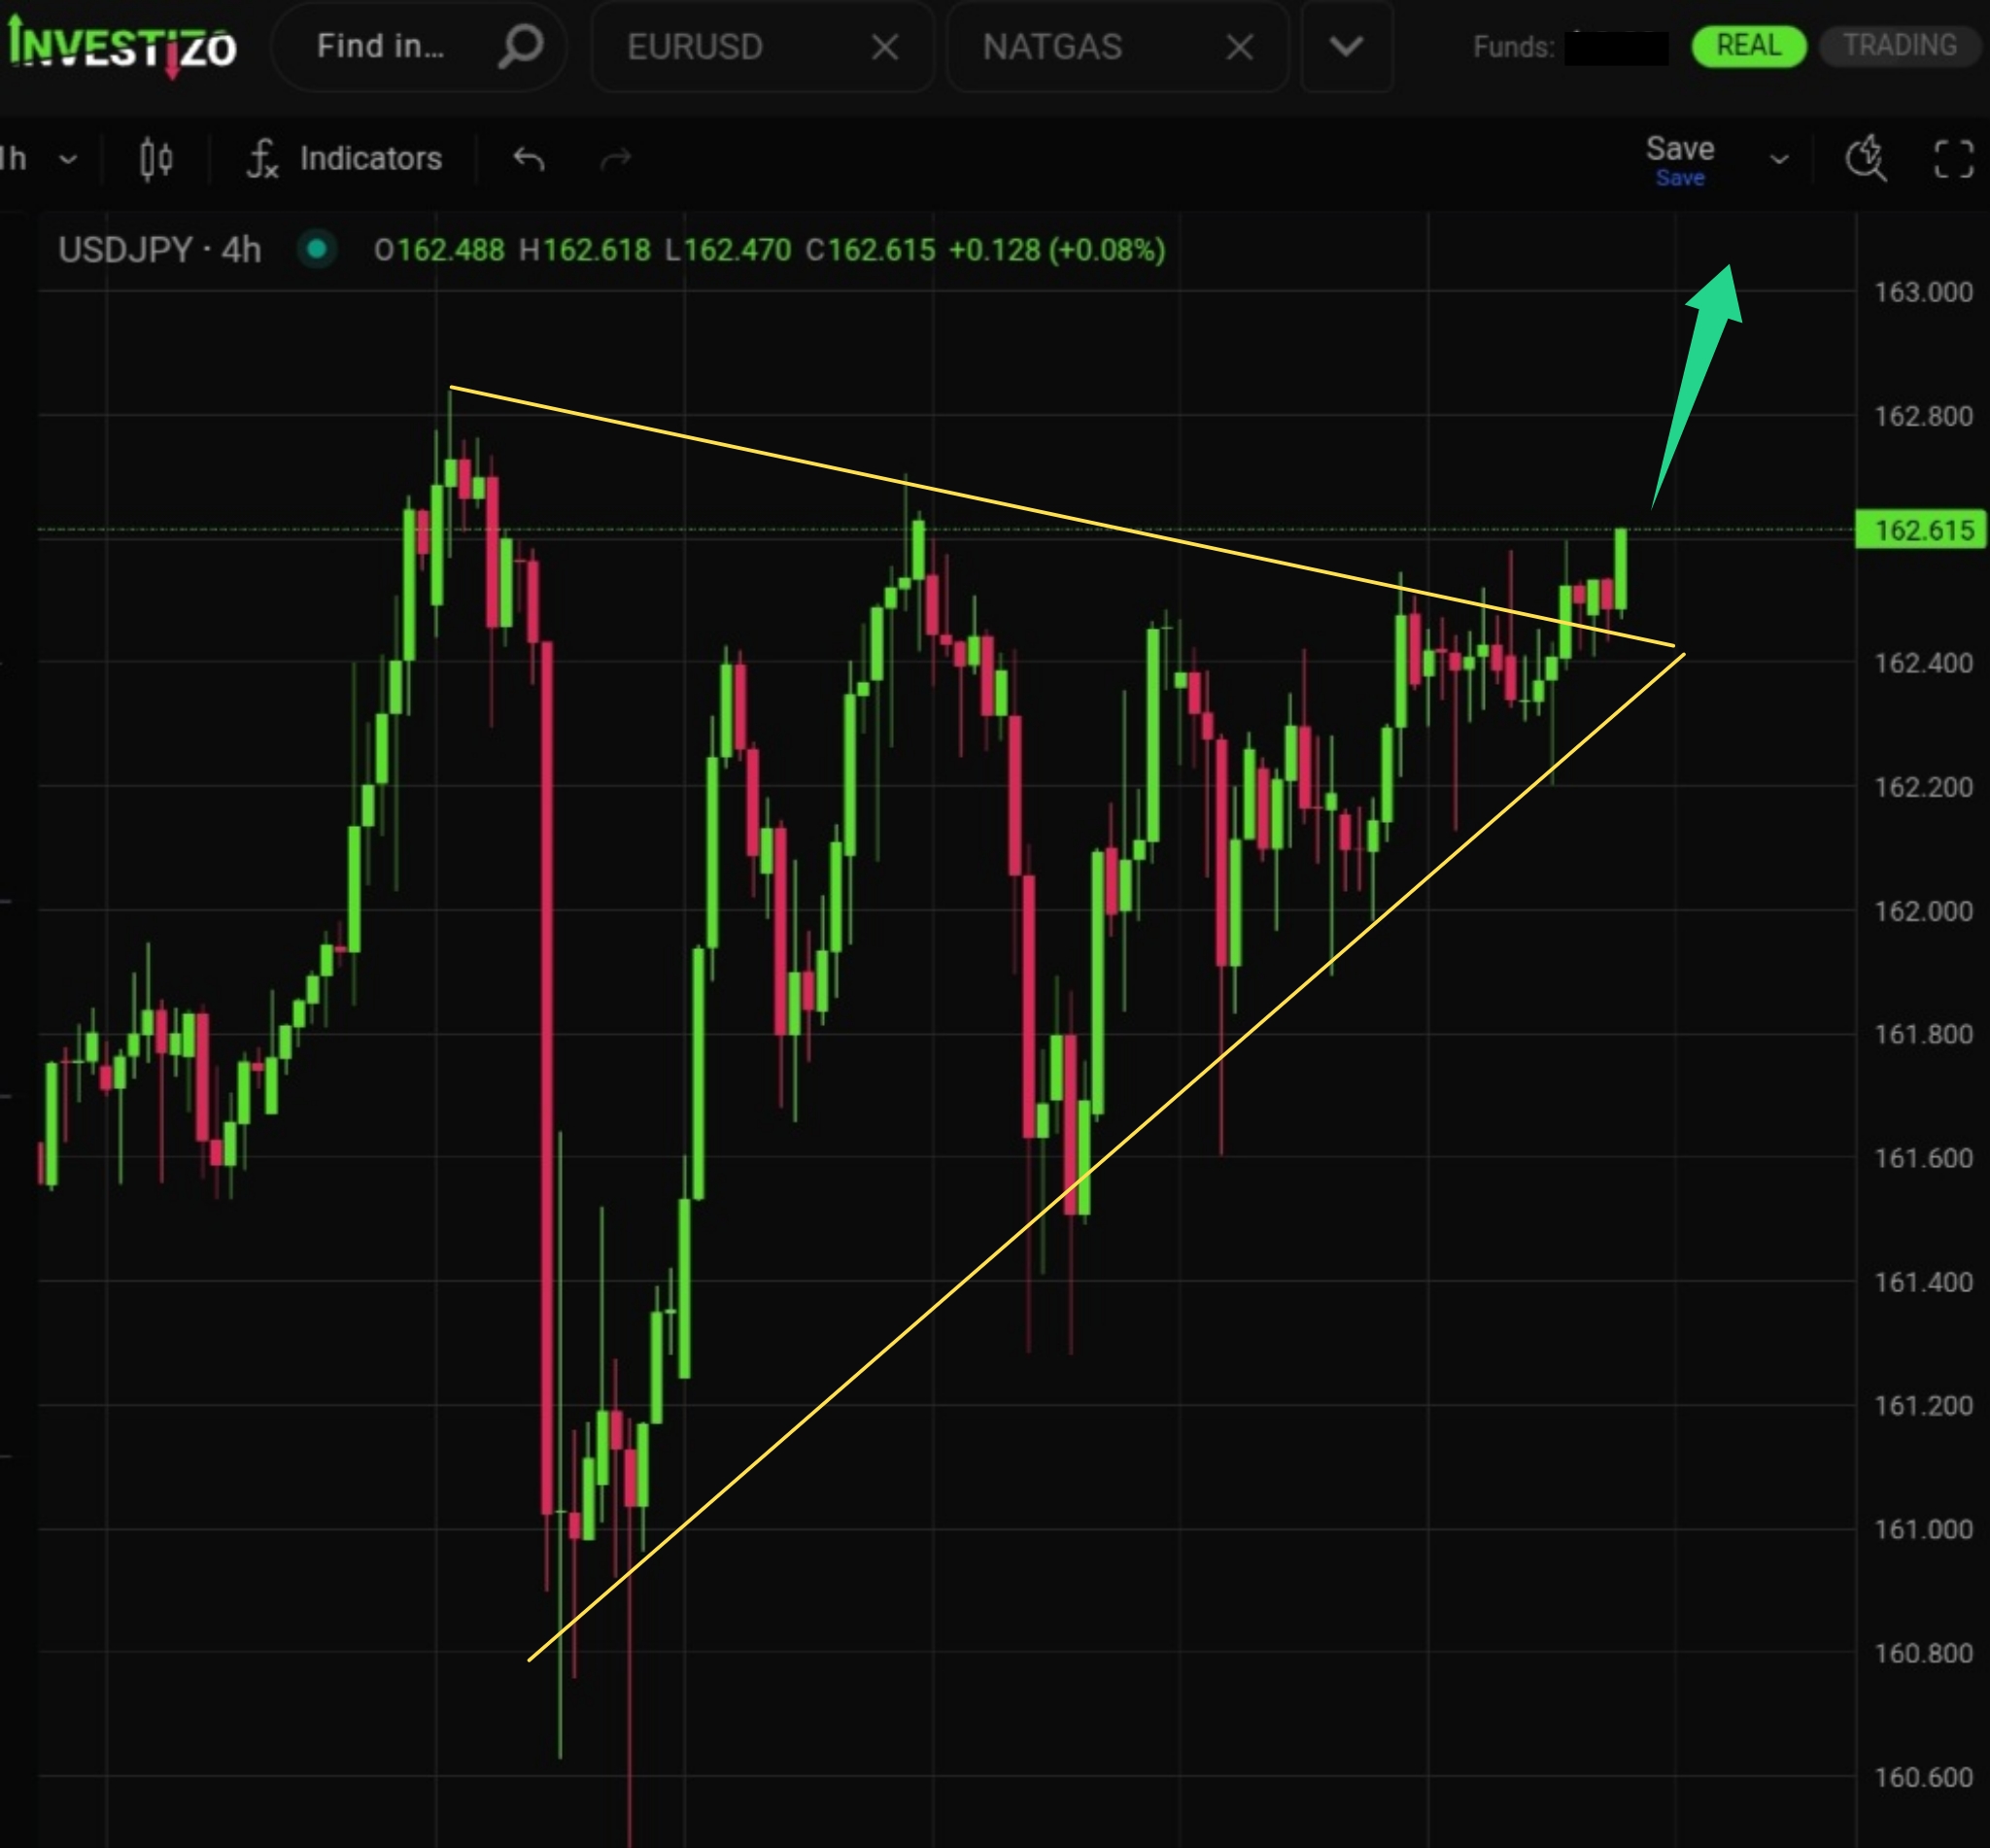
The long-awaited breakout from the triangle has finally occurred. The market has clearly chosen the upside direction.
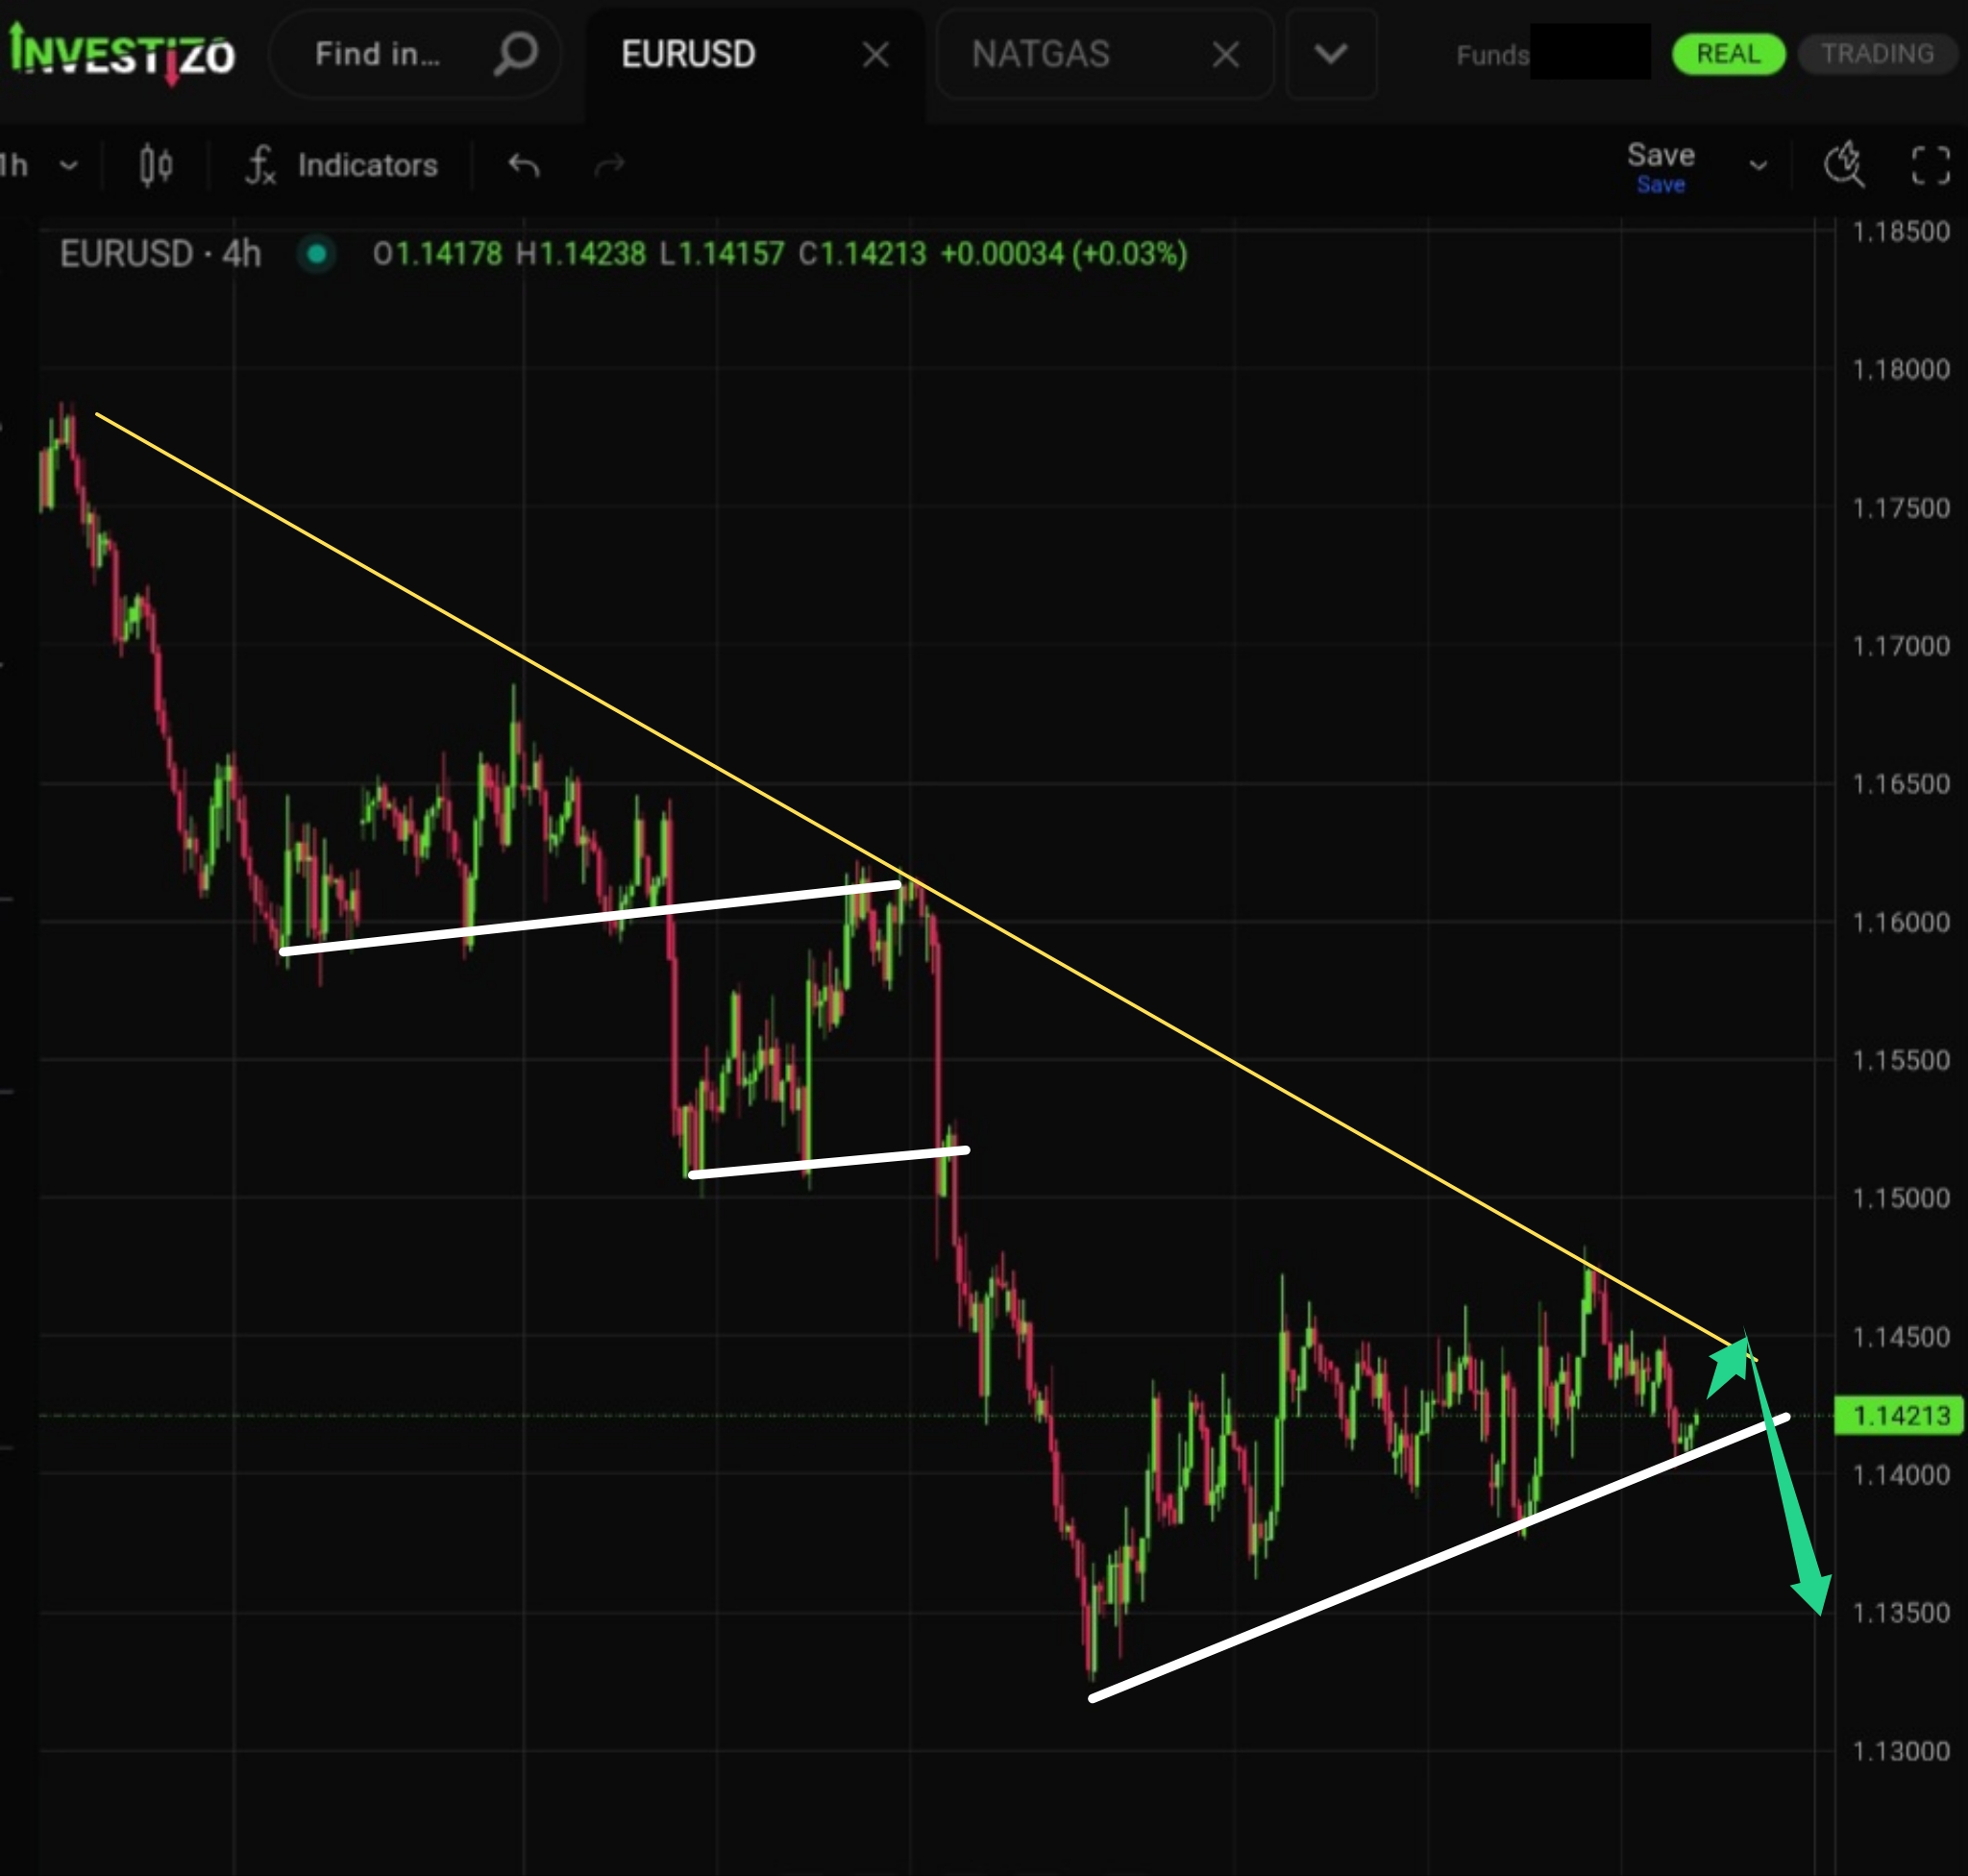
The pair continues to consolidate above the sloping support but is approaching a critical compression of the trading range near the medium-term trendline.
Bitcoin trades at 65,935 this Tuesday morning, holding onto recent gains as short-term market participants return to profitability alongside a broader resurgence in risk appetite.
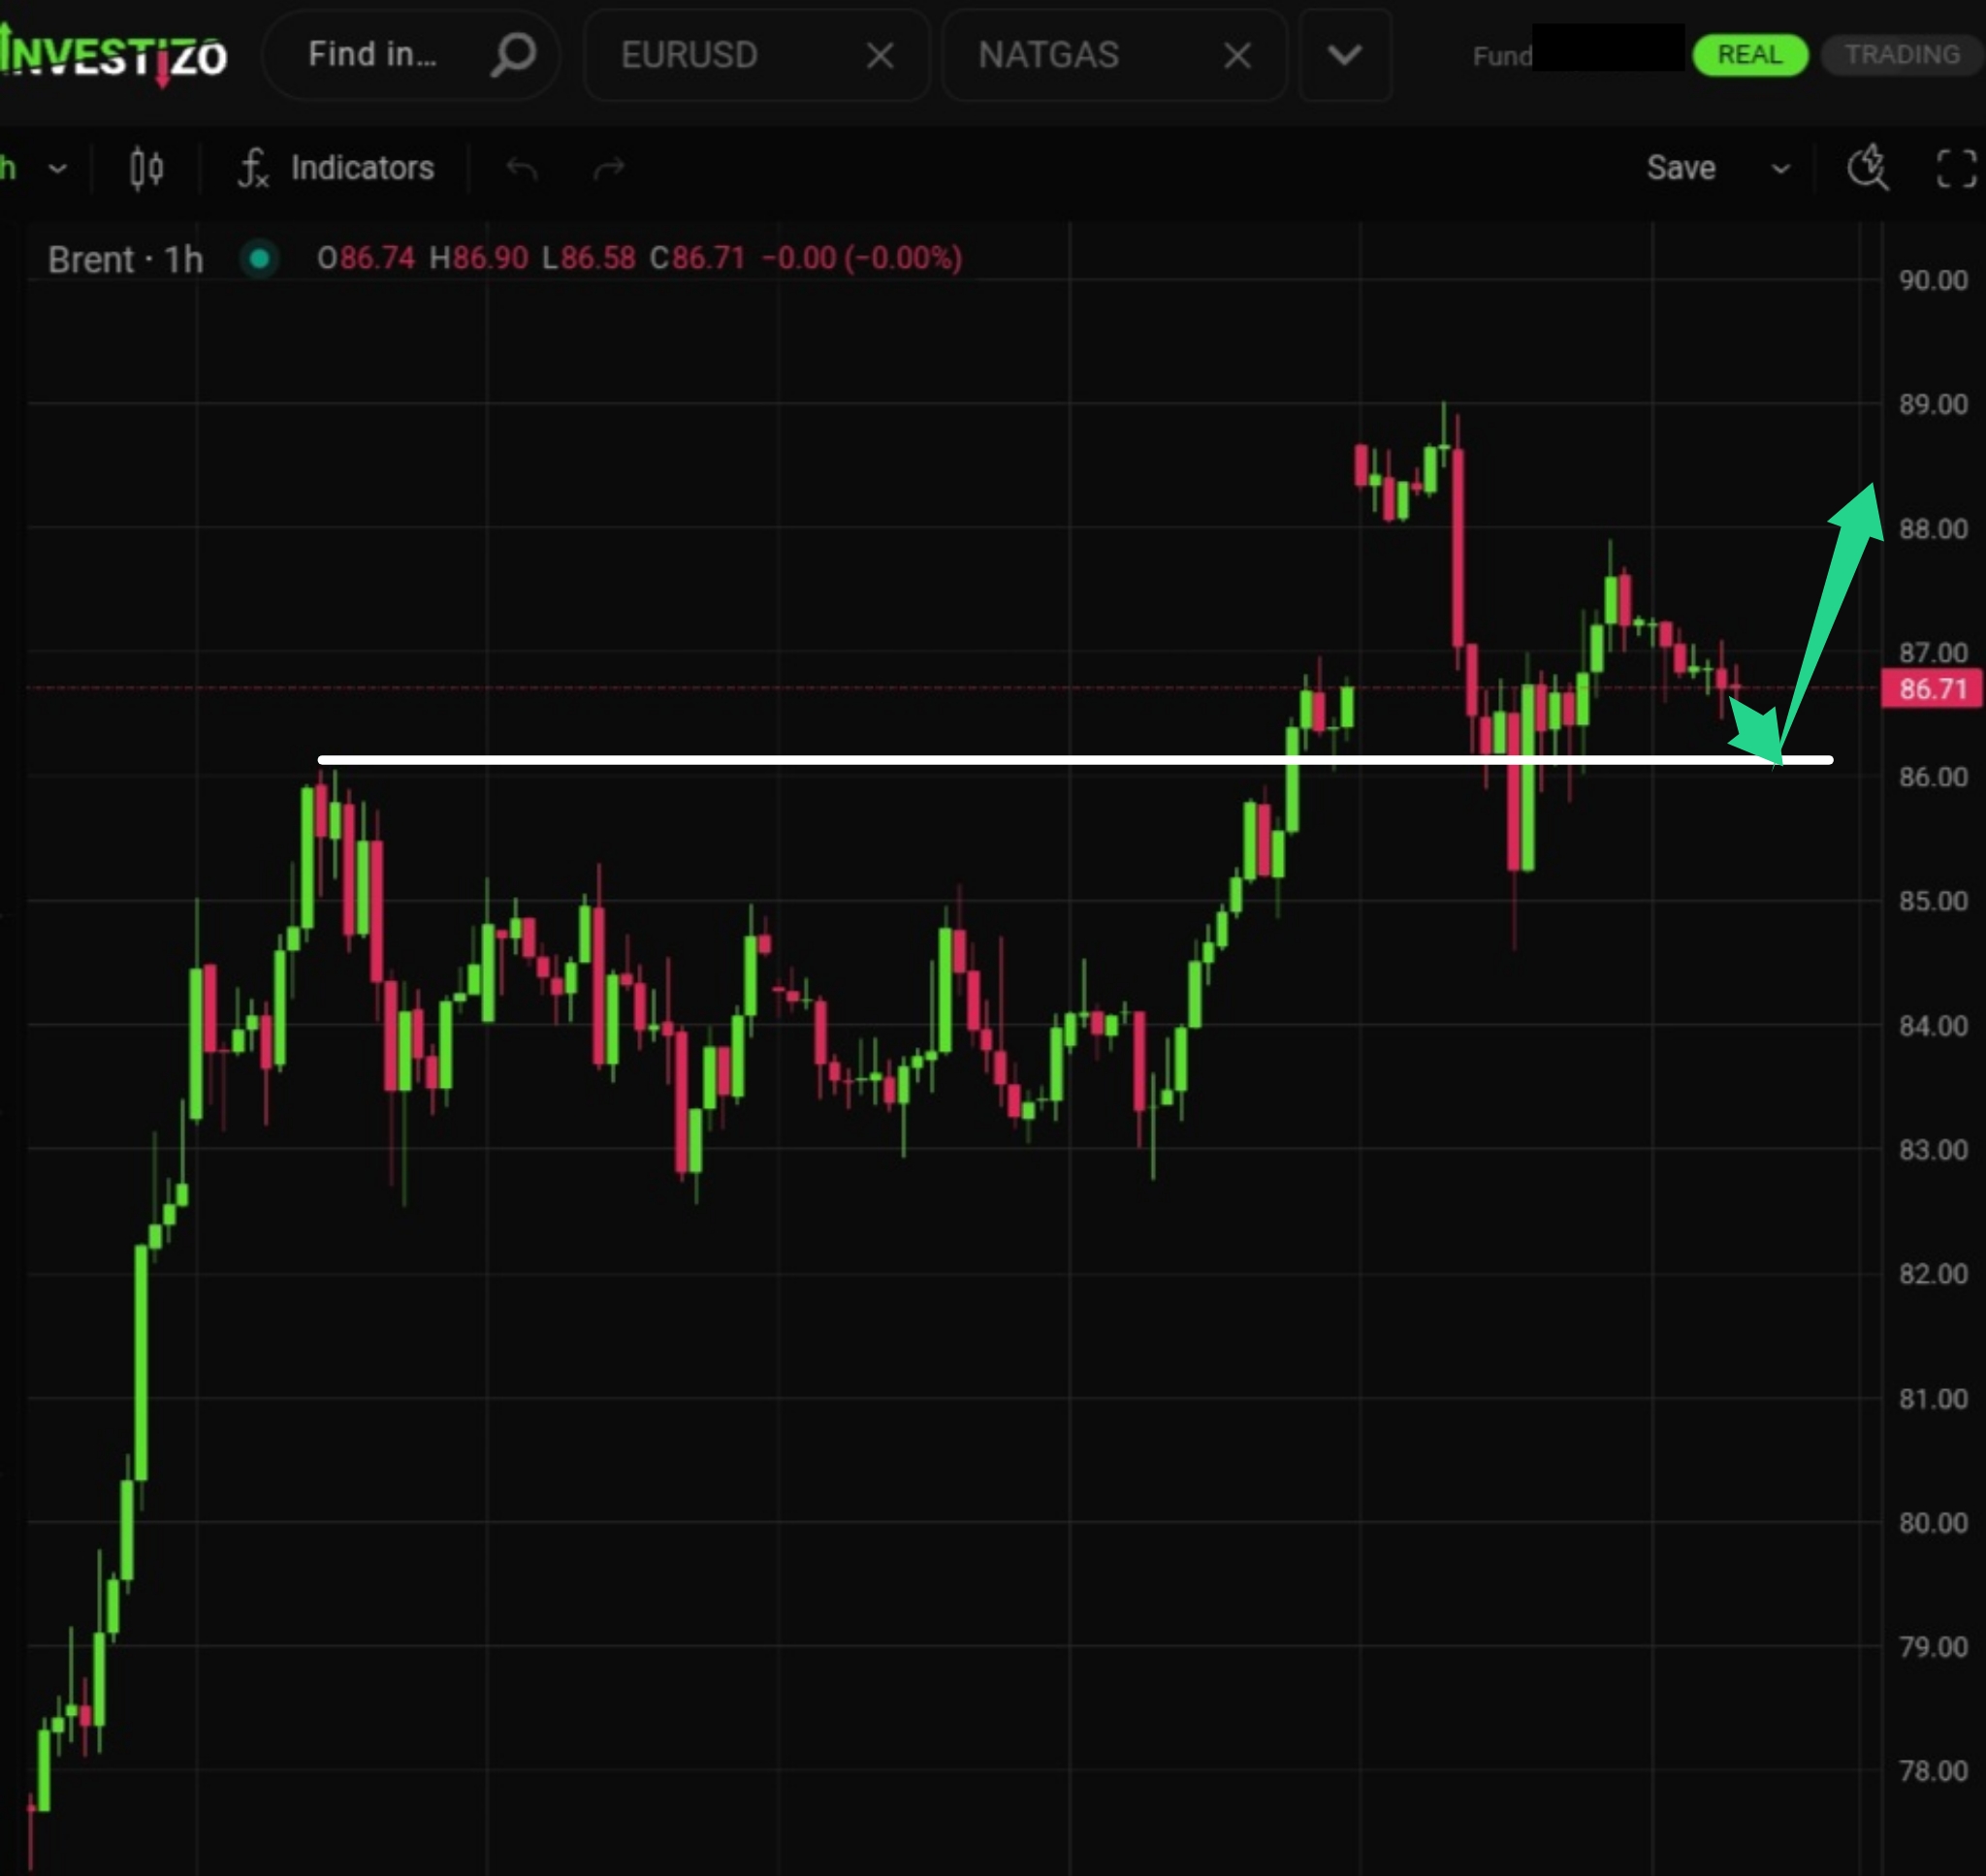
Brent Crude trades at 86.71 this Tuesday morning, consolidating near its highest levels since June 11.
Local support for the price appears unstable. The market will likely need to test the demand zone at 2,700–2,720.
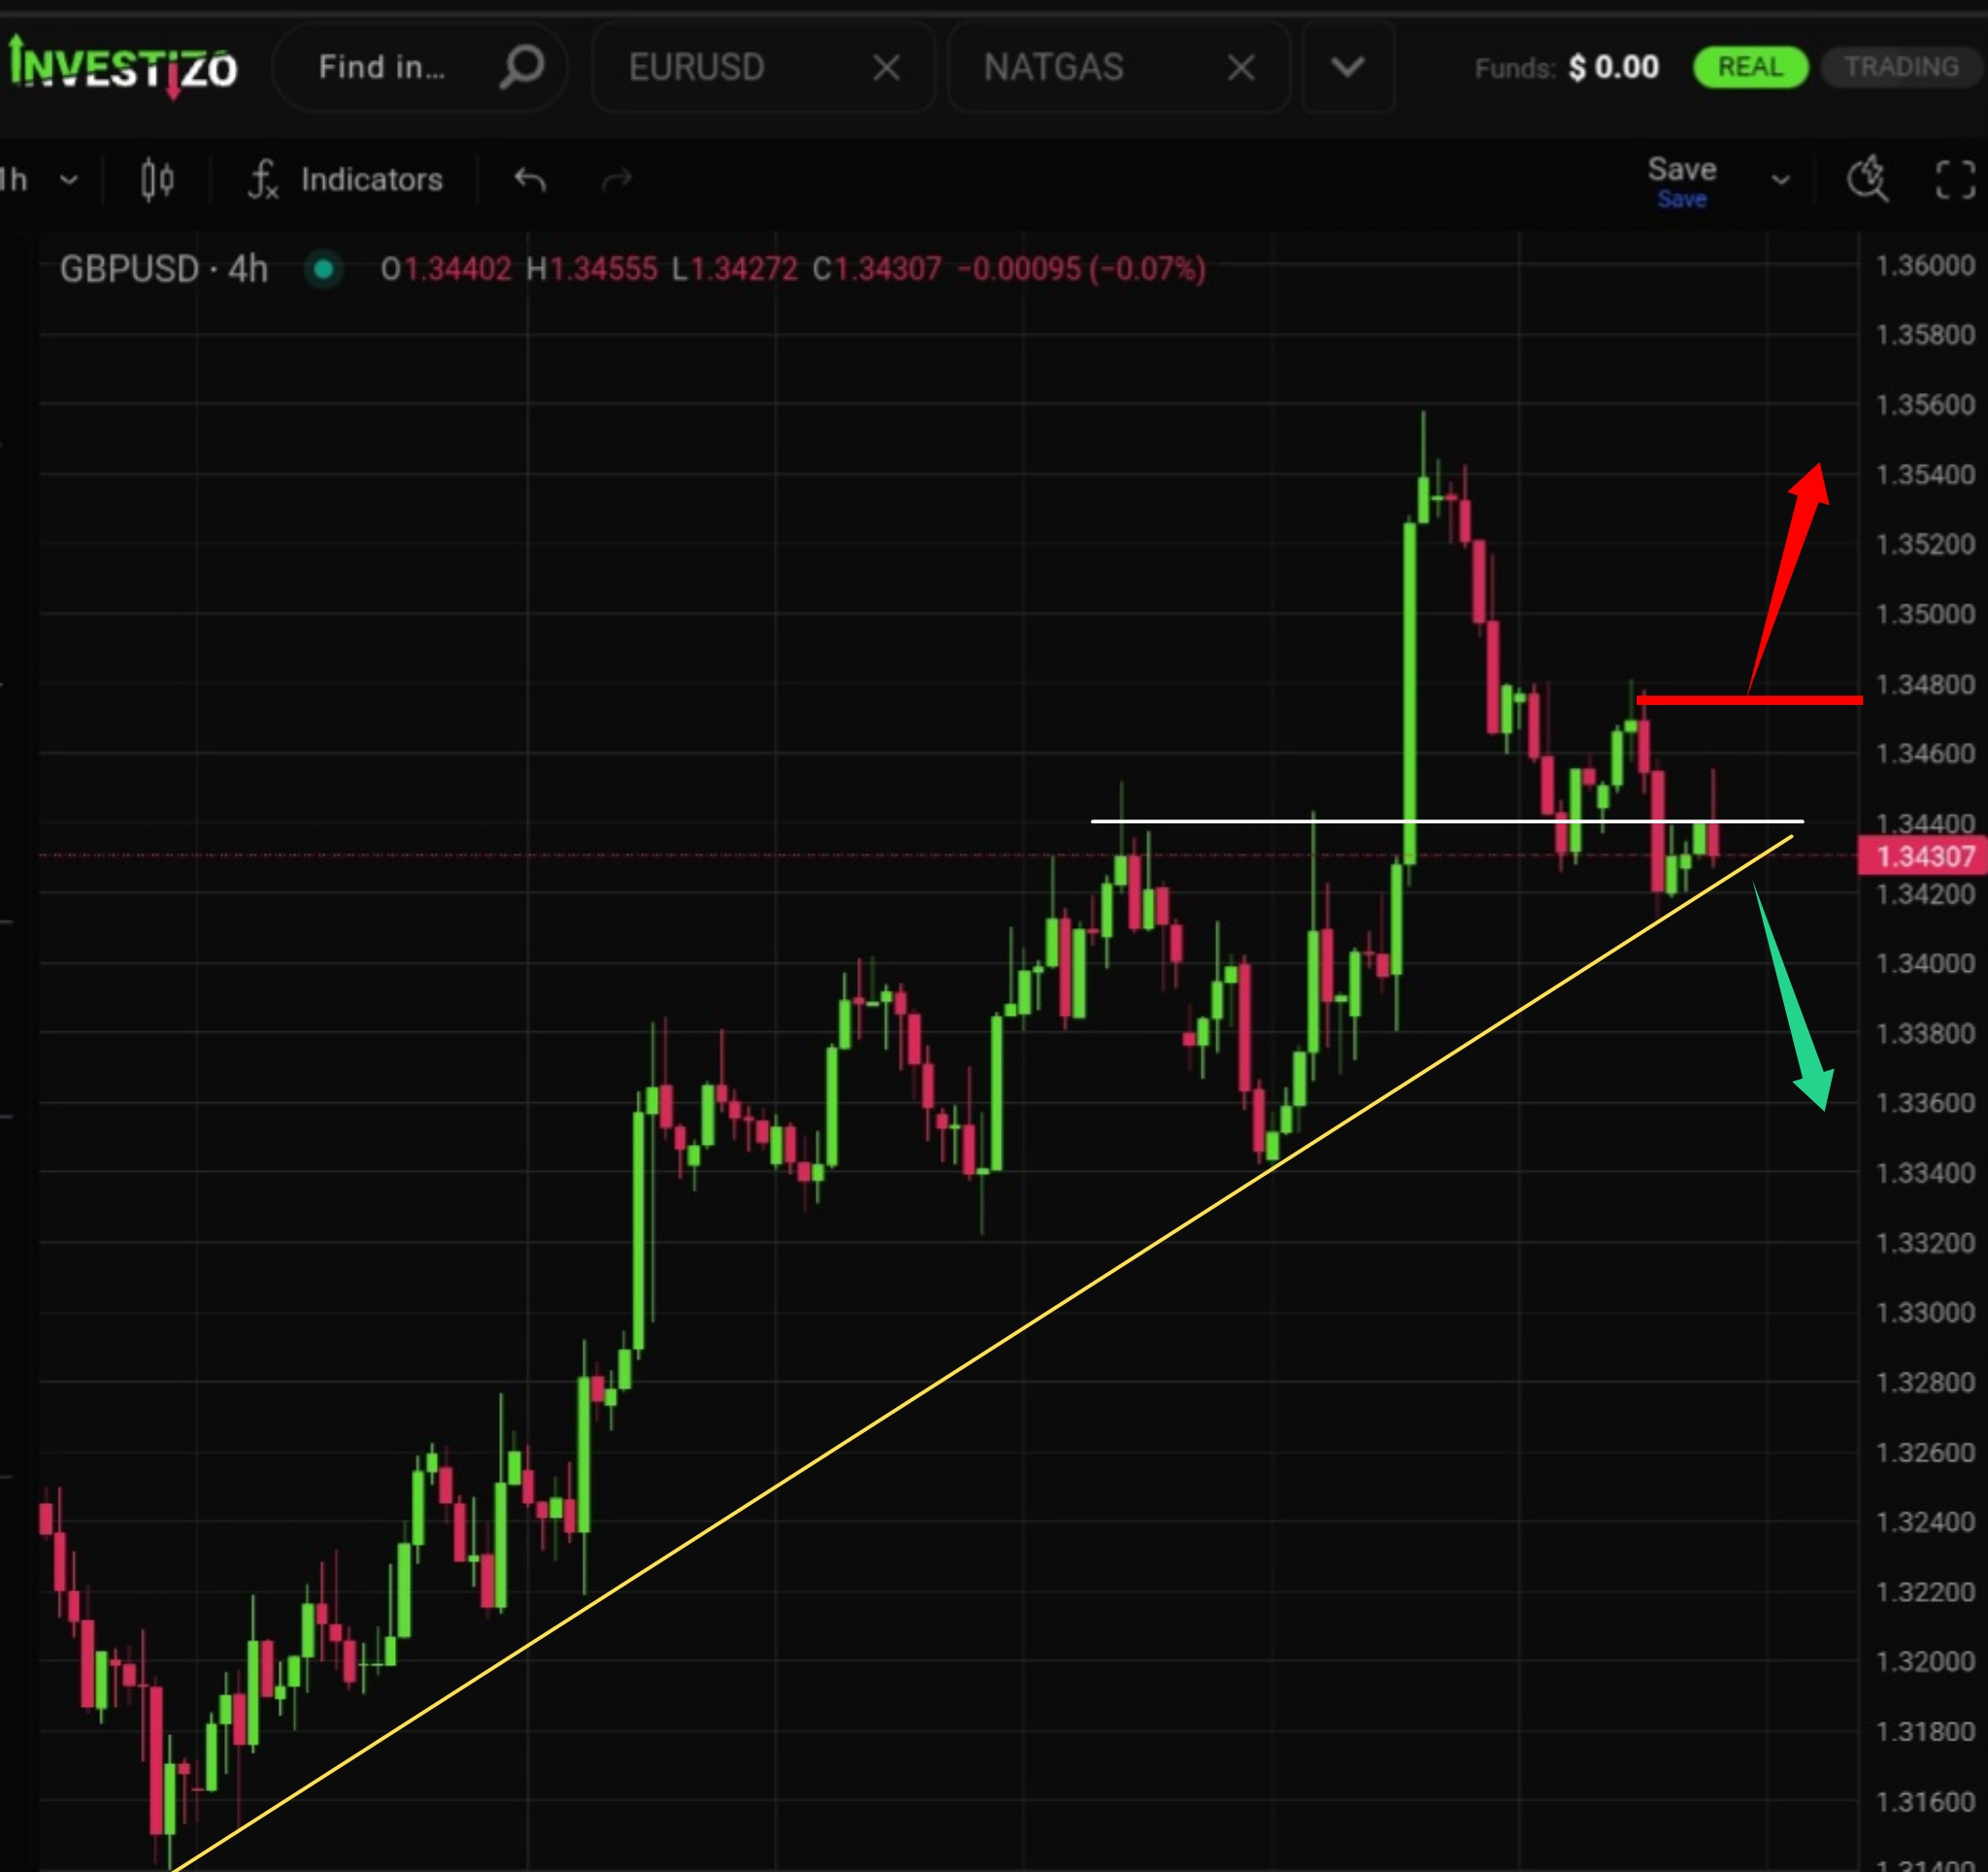
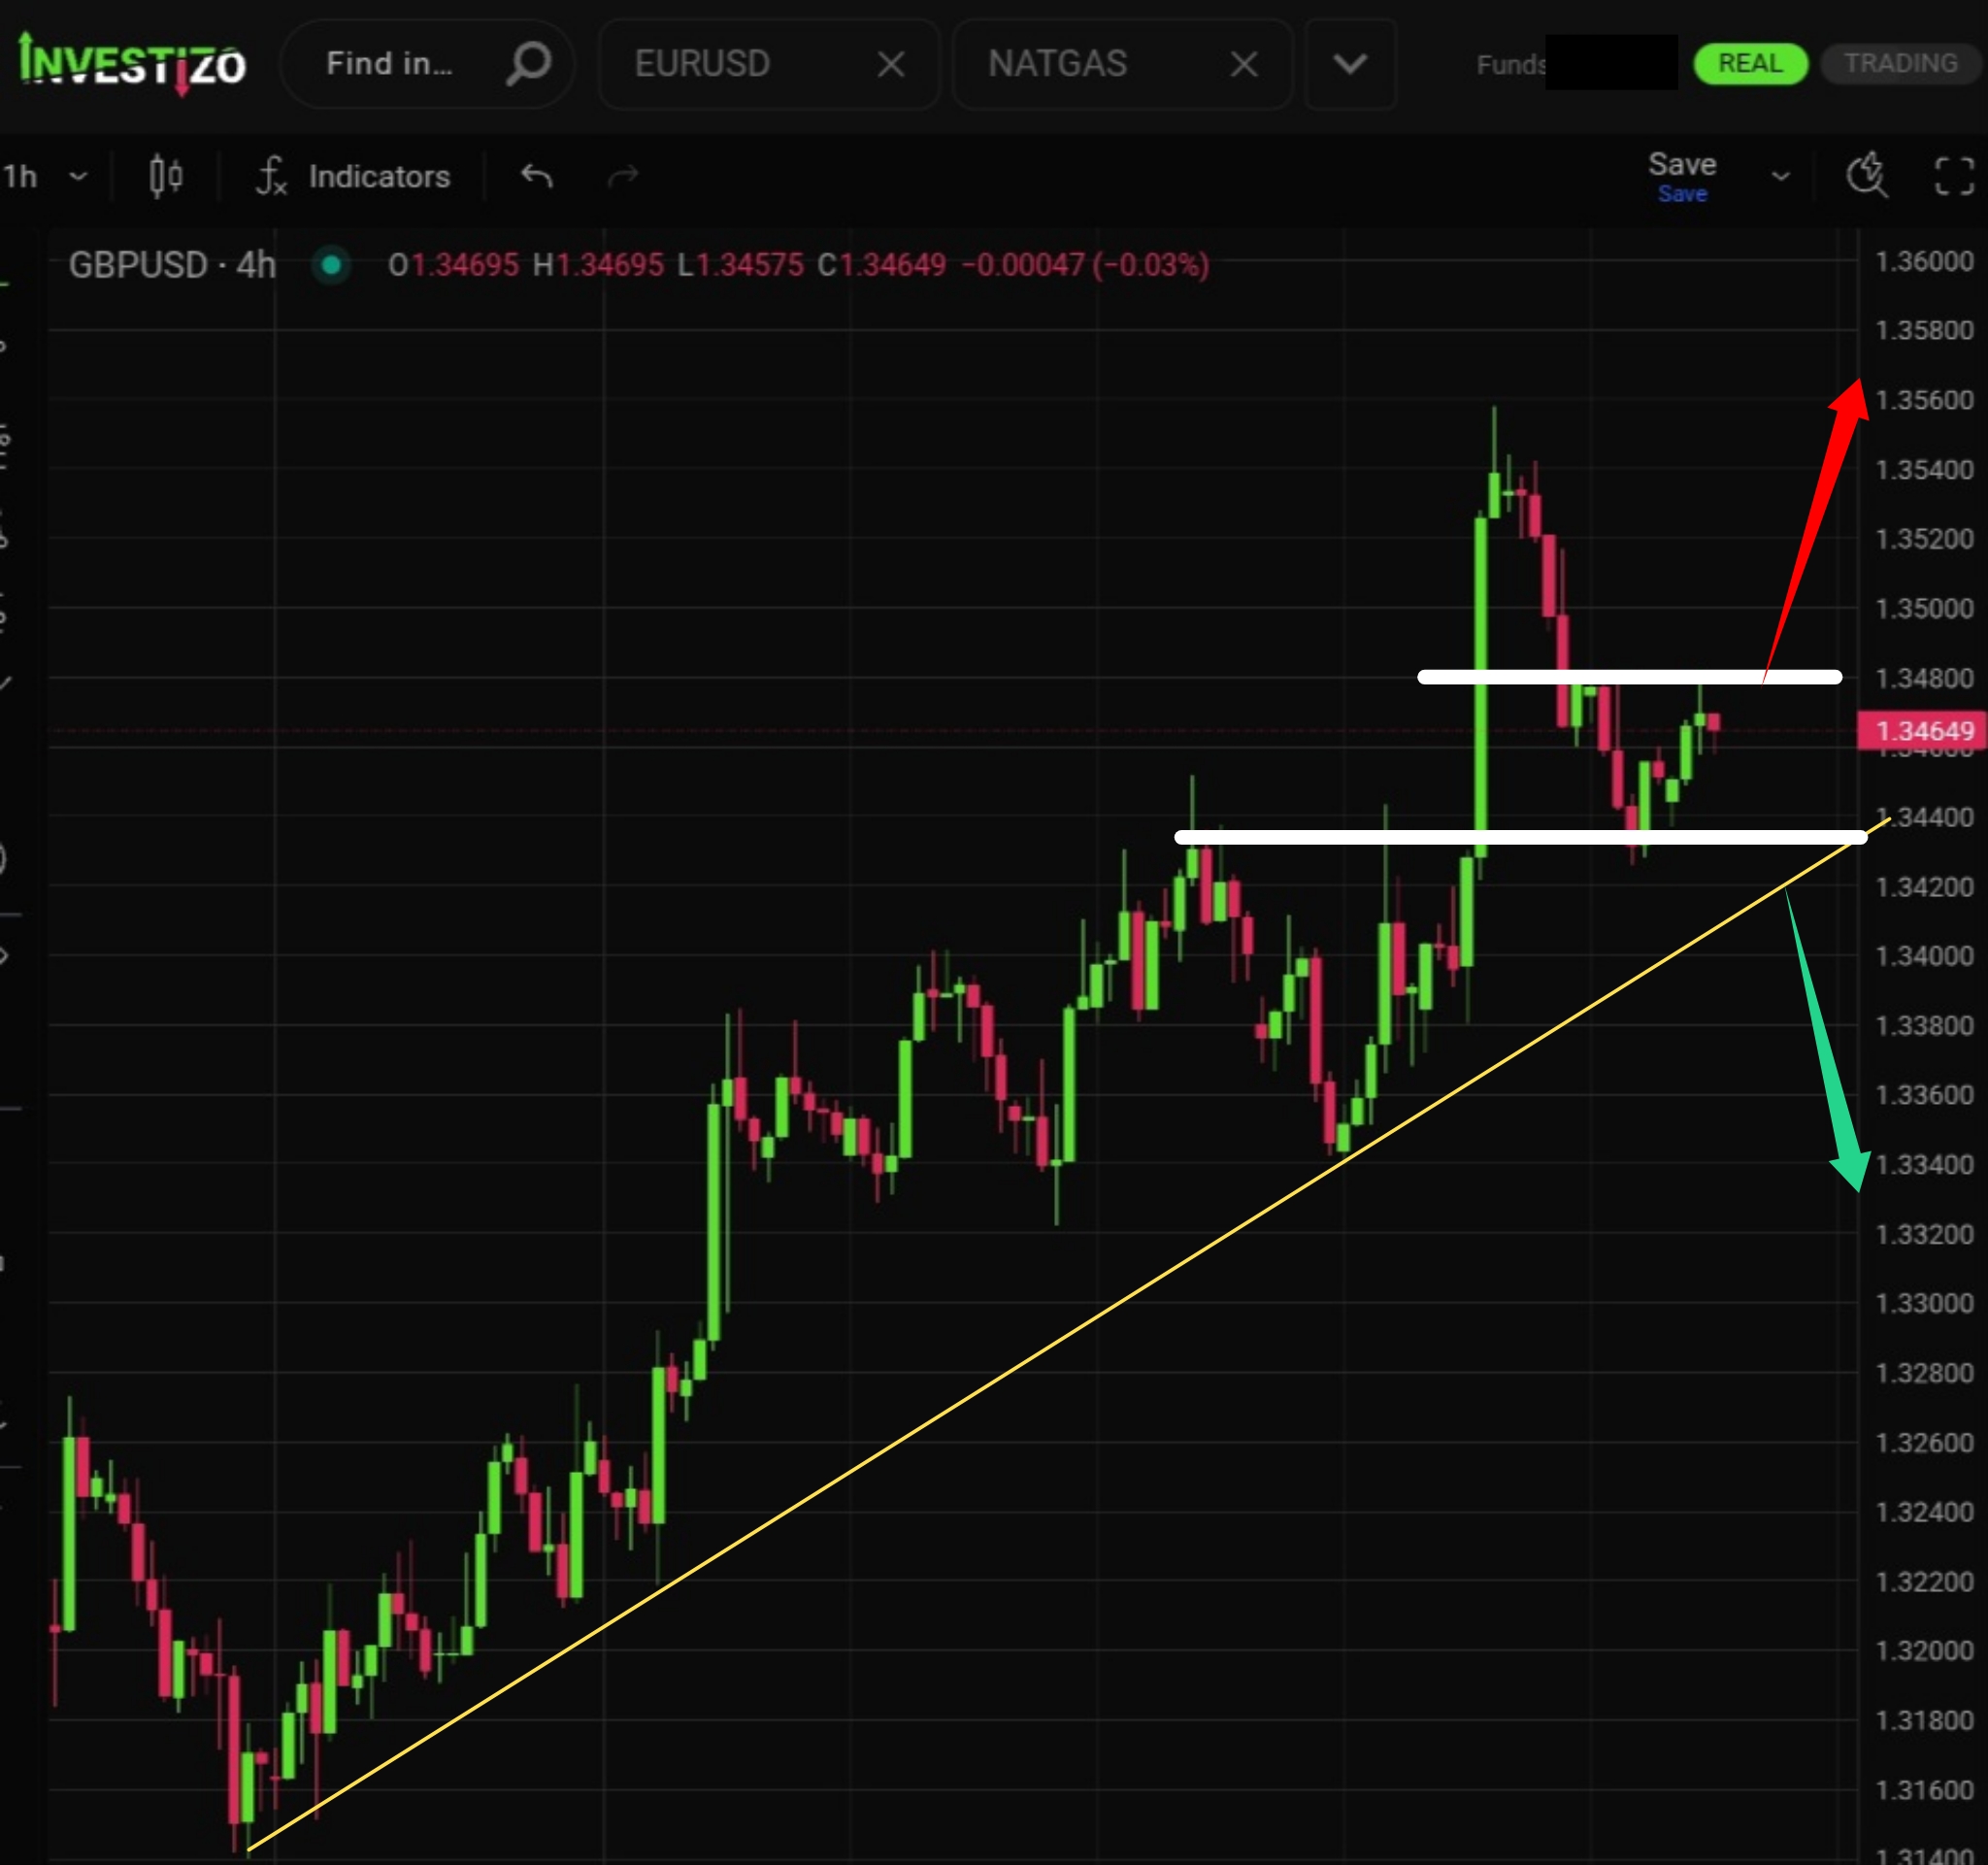
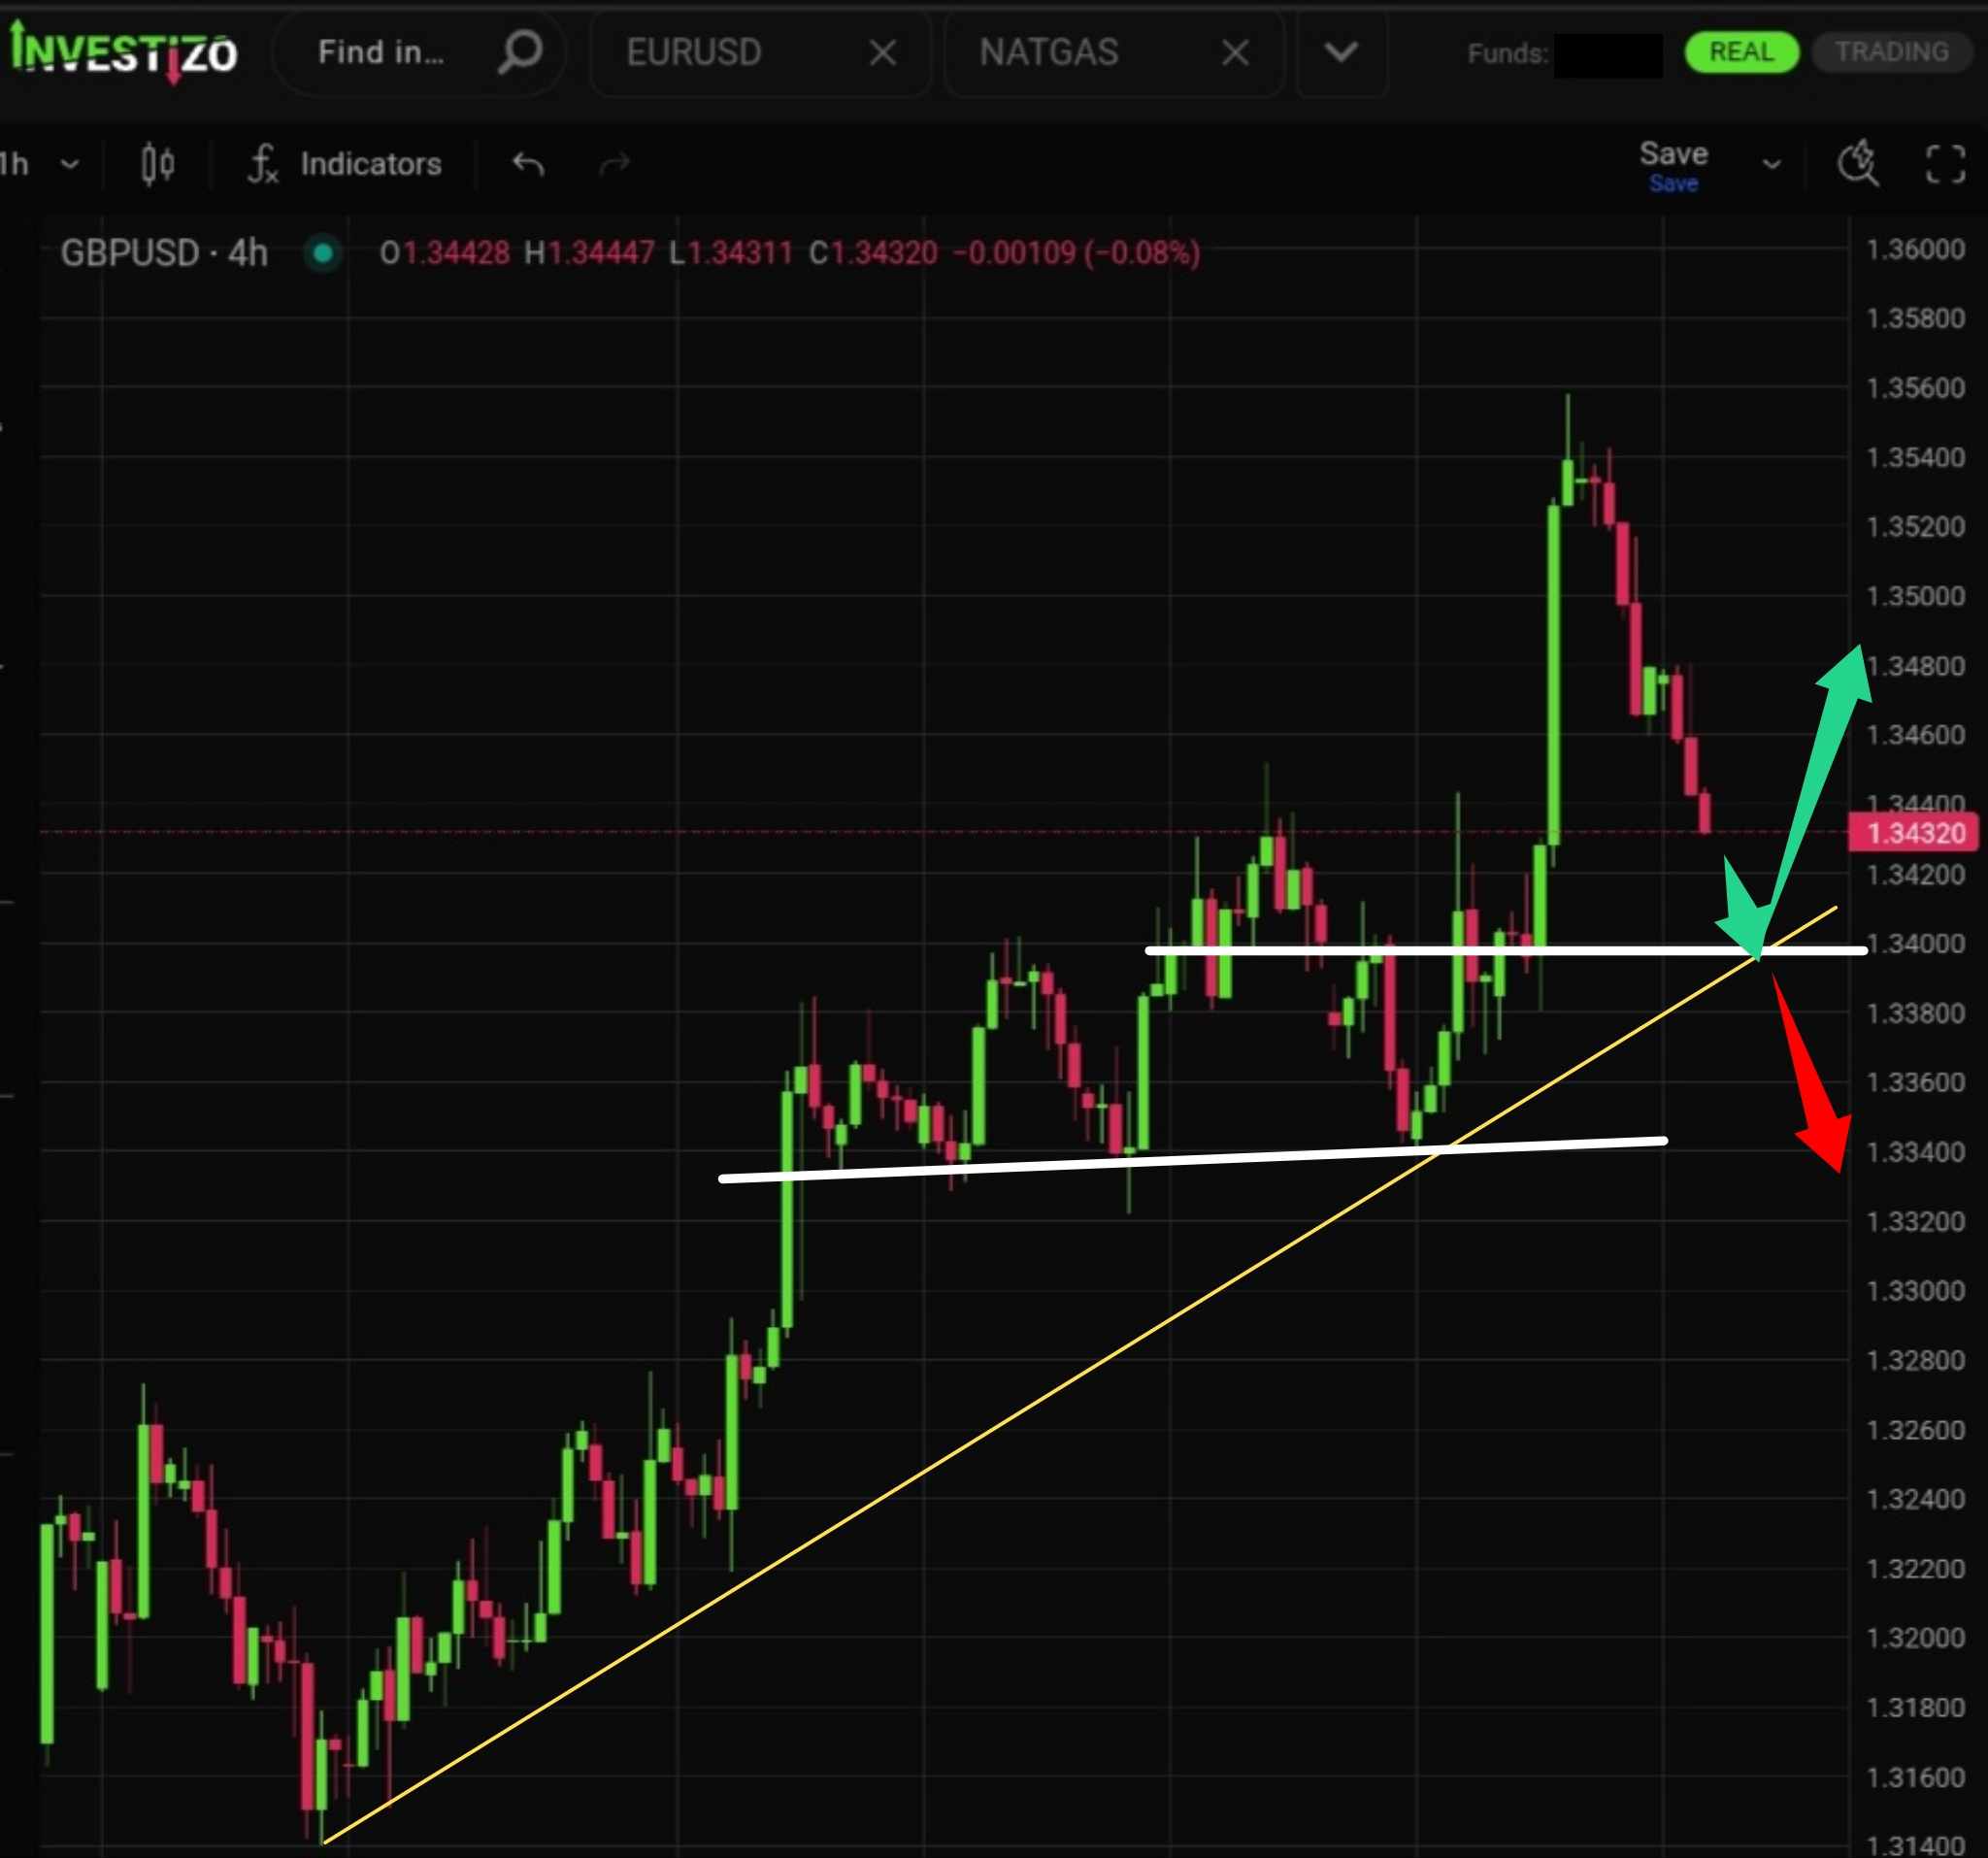
The pair technically maintains its uptrend for now (valid as long as the medium-term trendline around 1.3420 remains intact).
The pair’s trading range continues to tighten sharply. There is still enough room left for today’s session.
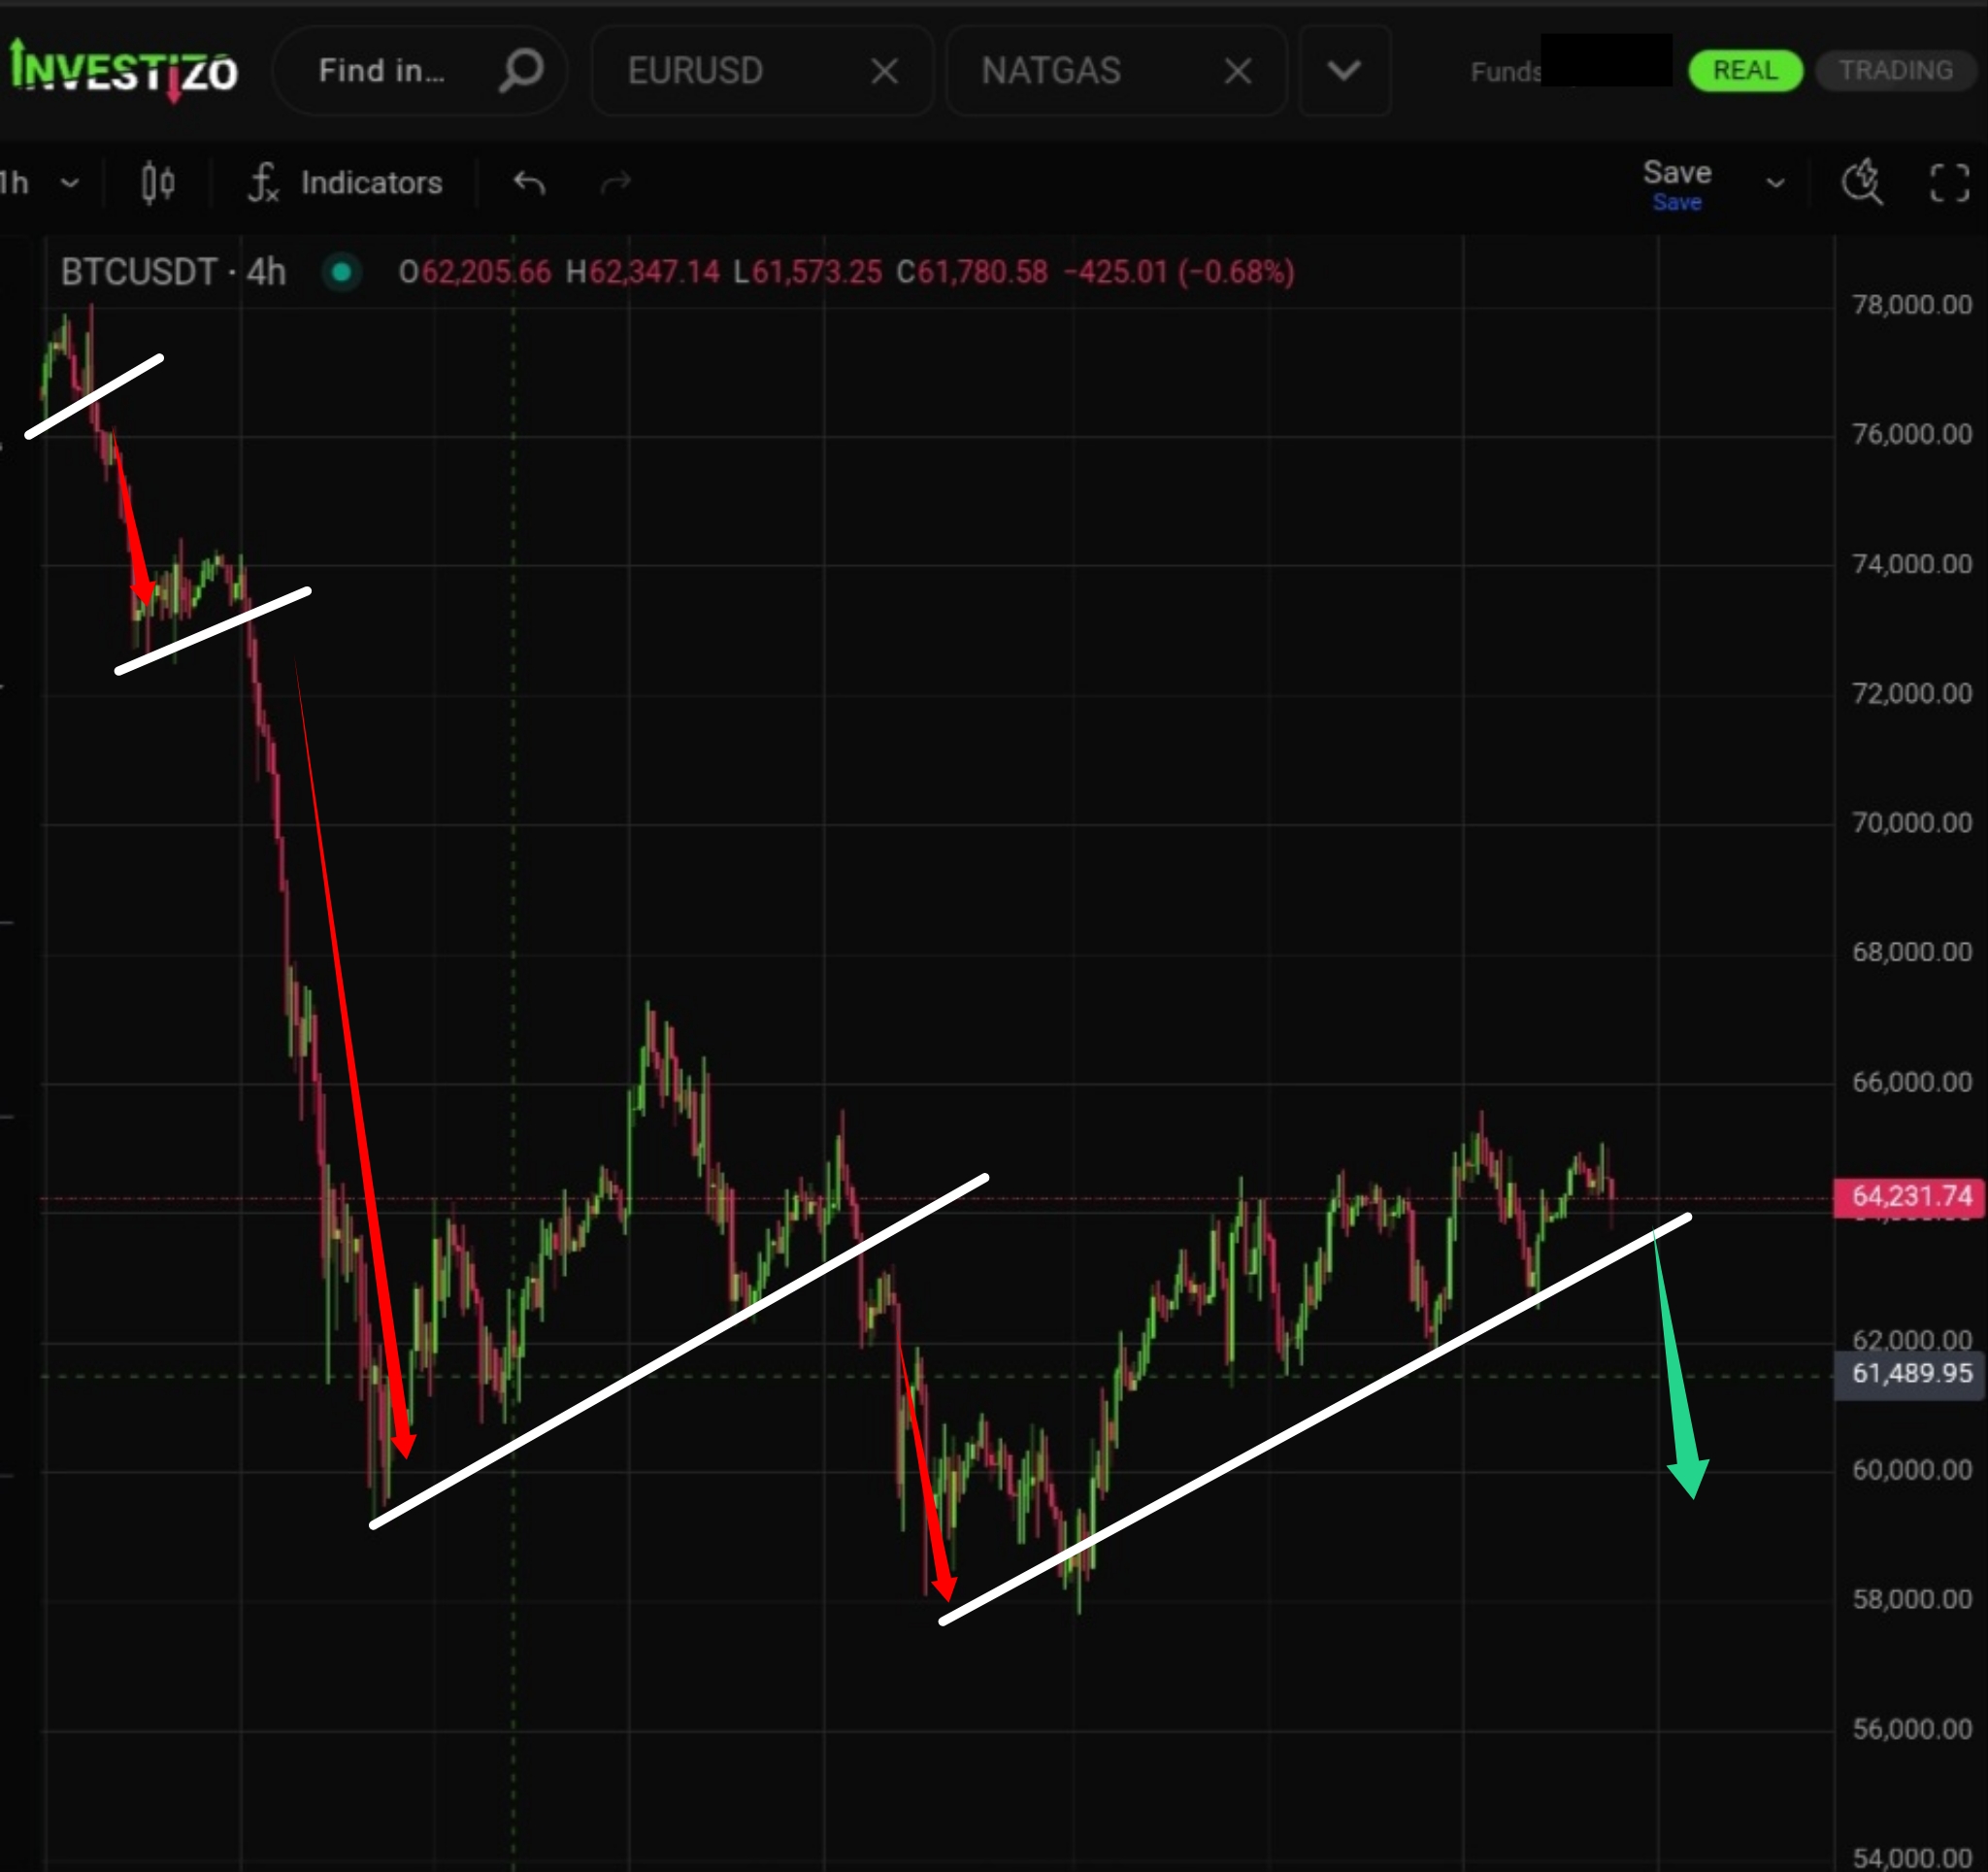
Bitcoin is currently in a consolidation phase ahead of a likely continuation of the medium-term downtrend.
Despite some optimism for the euro seen last week, the pair remains under persistent downside pressure.
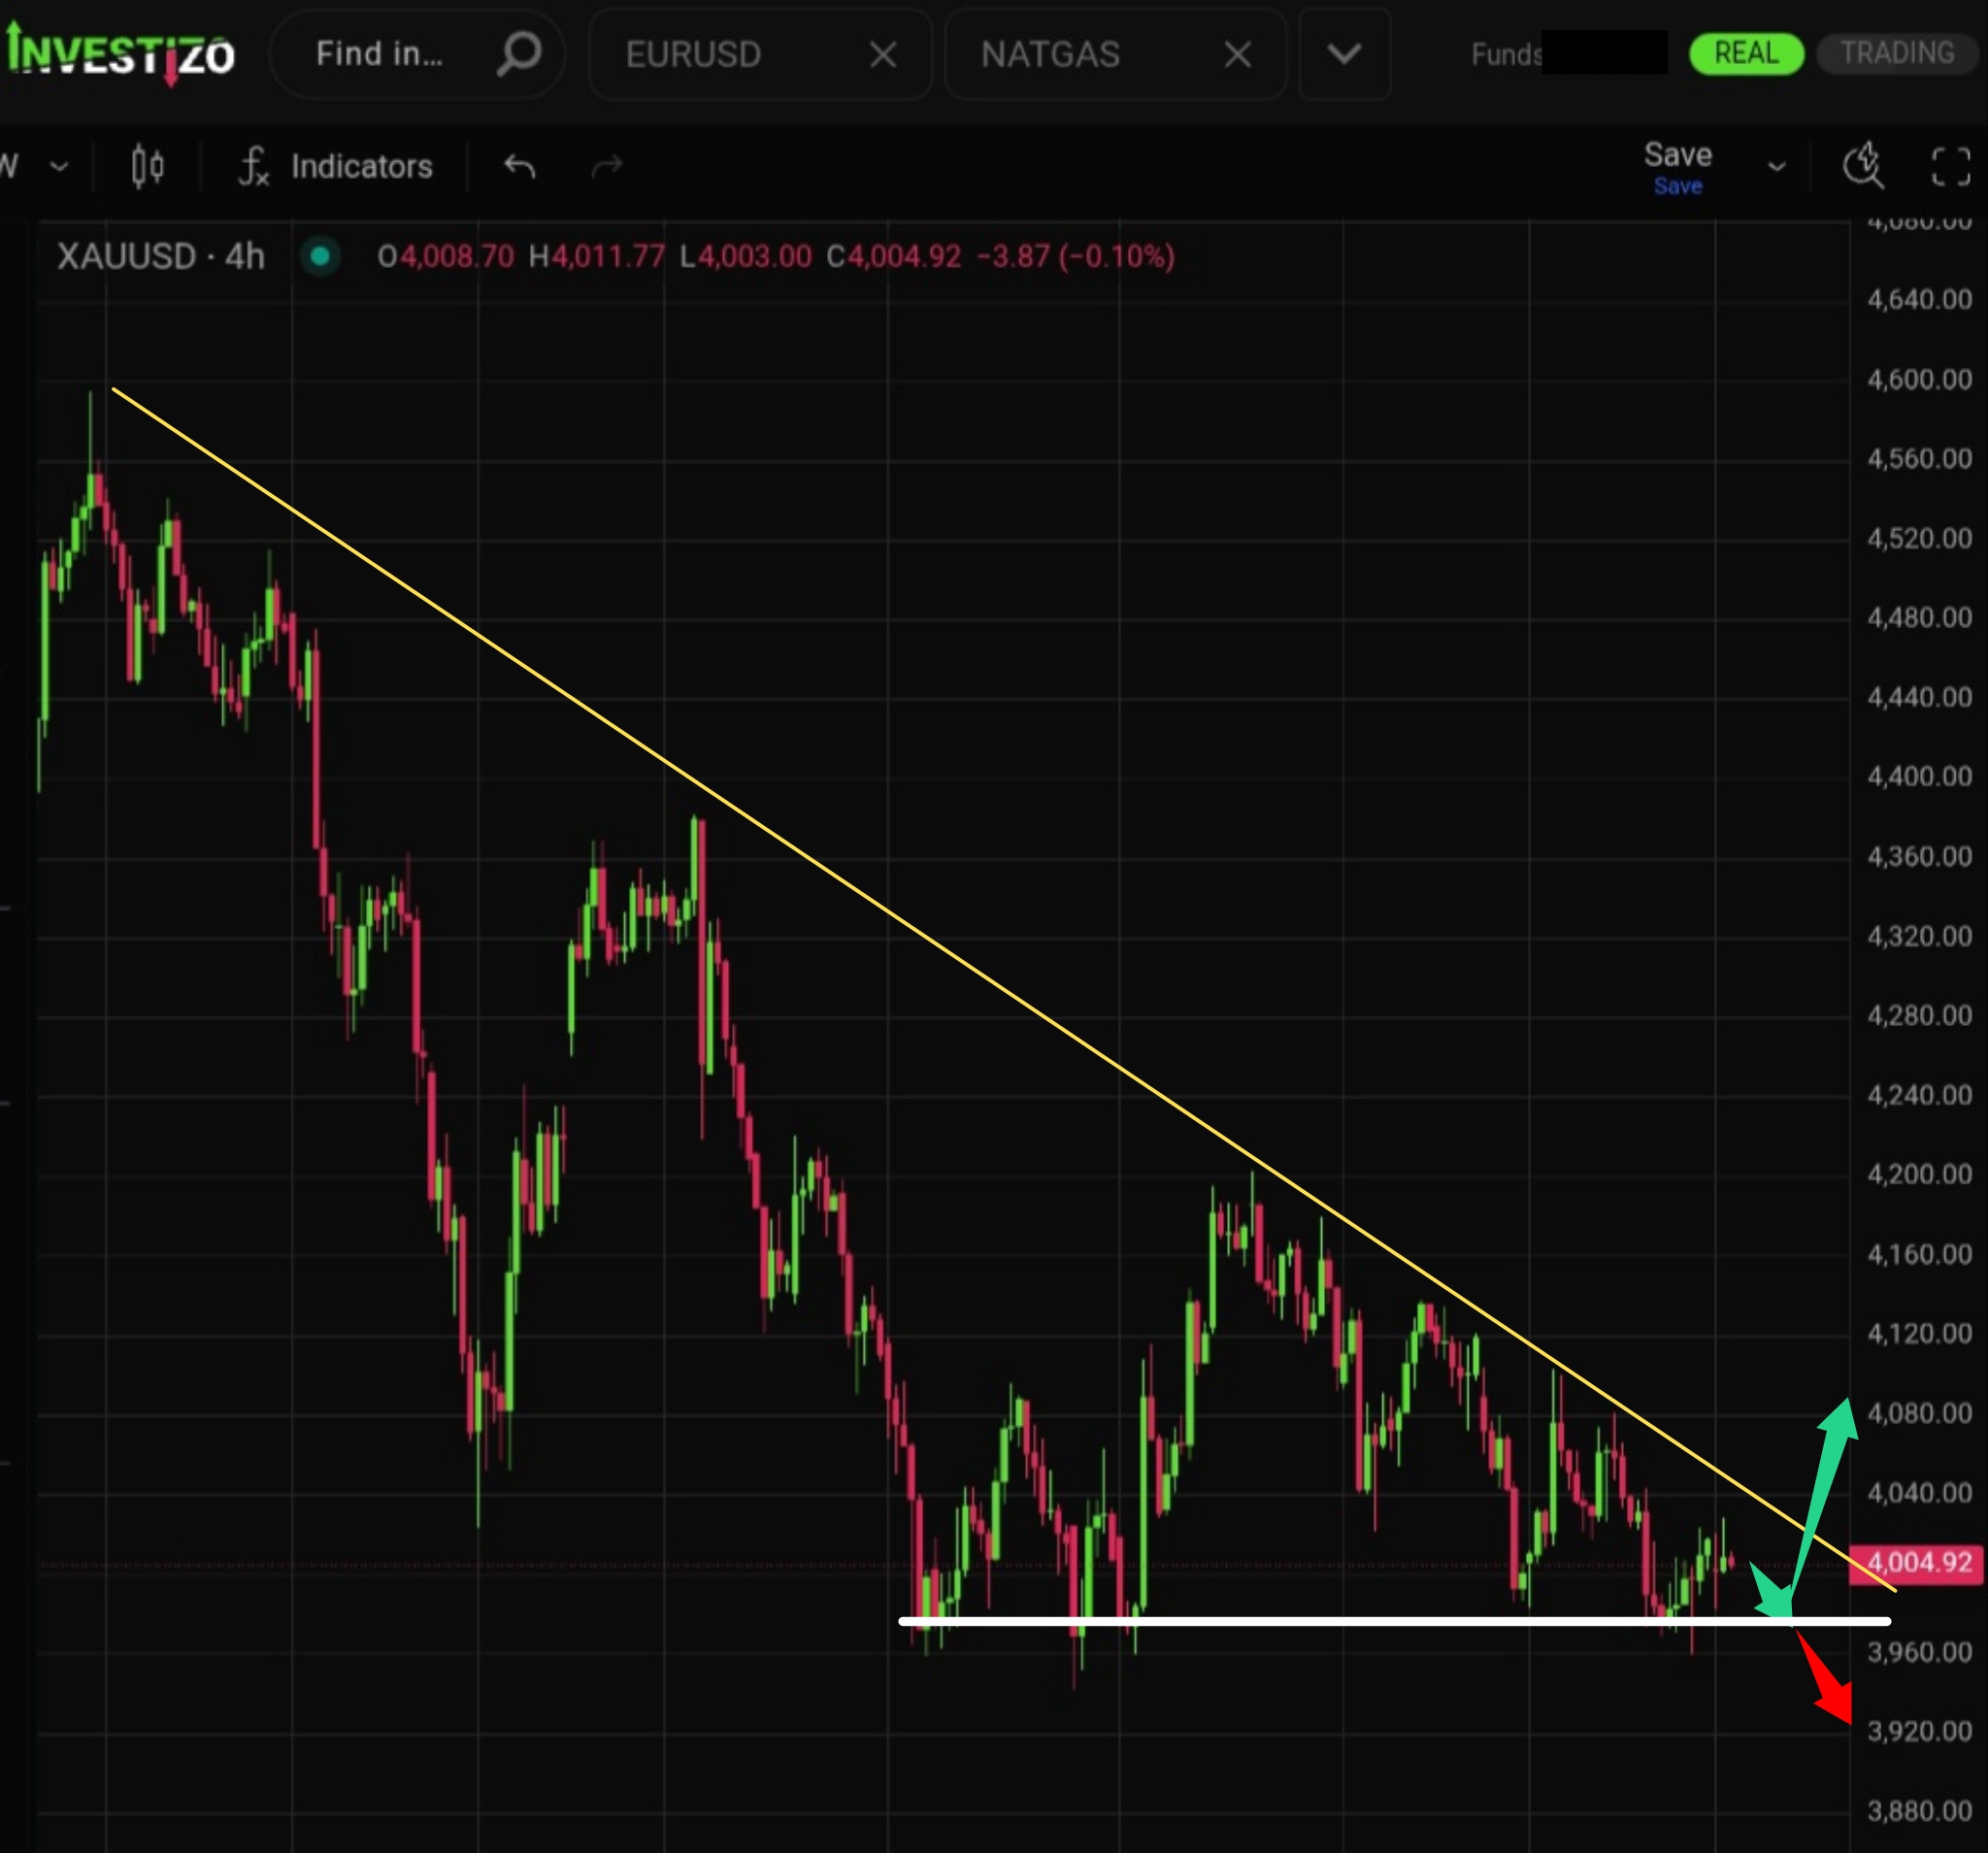
Gold trades at 4,005 this Monday morning, extending its sharpest weekly decline in six weeks.
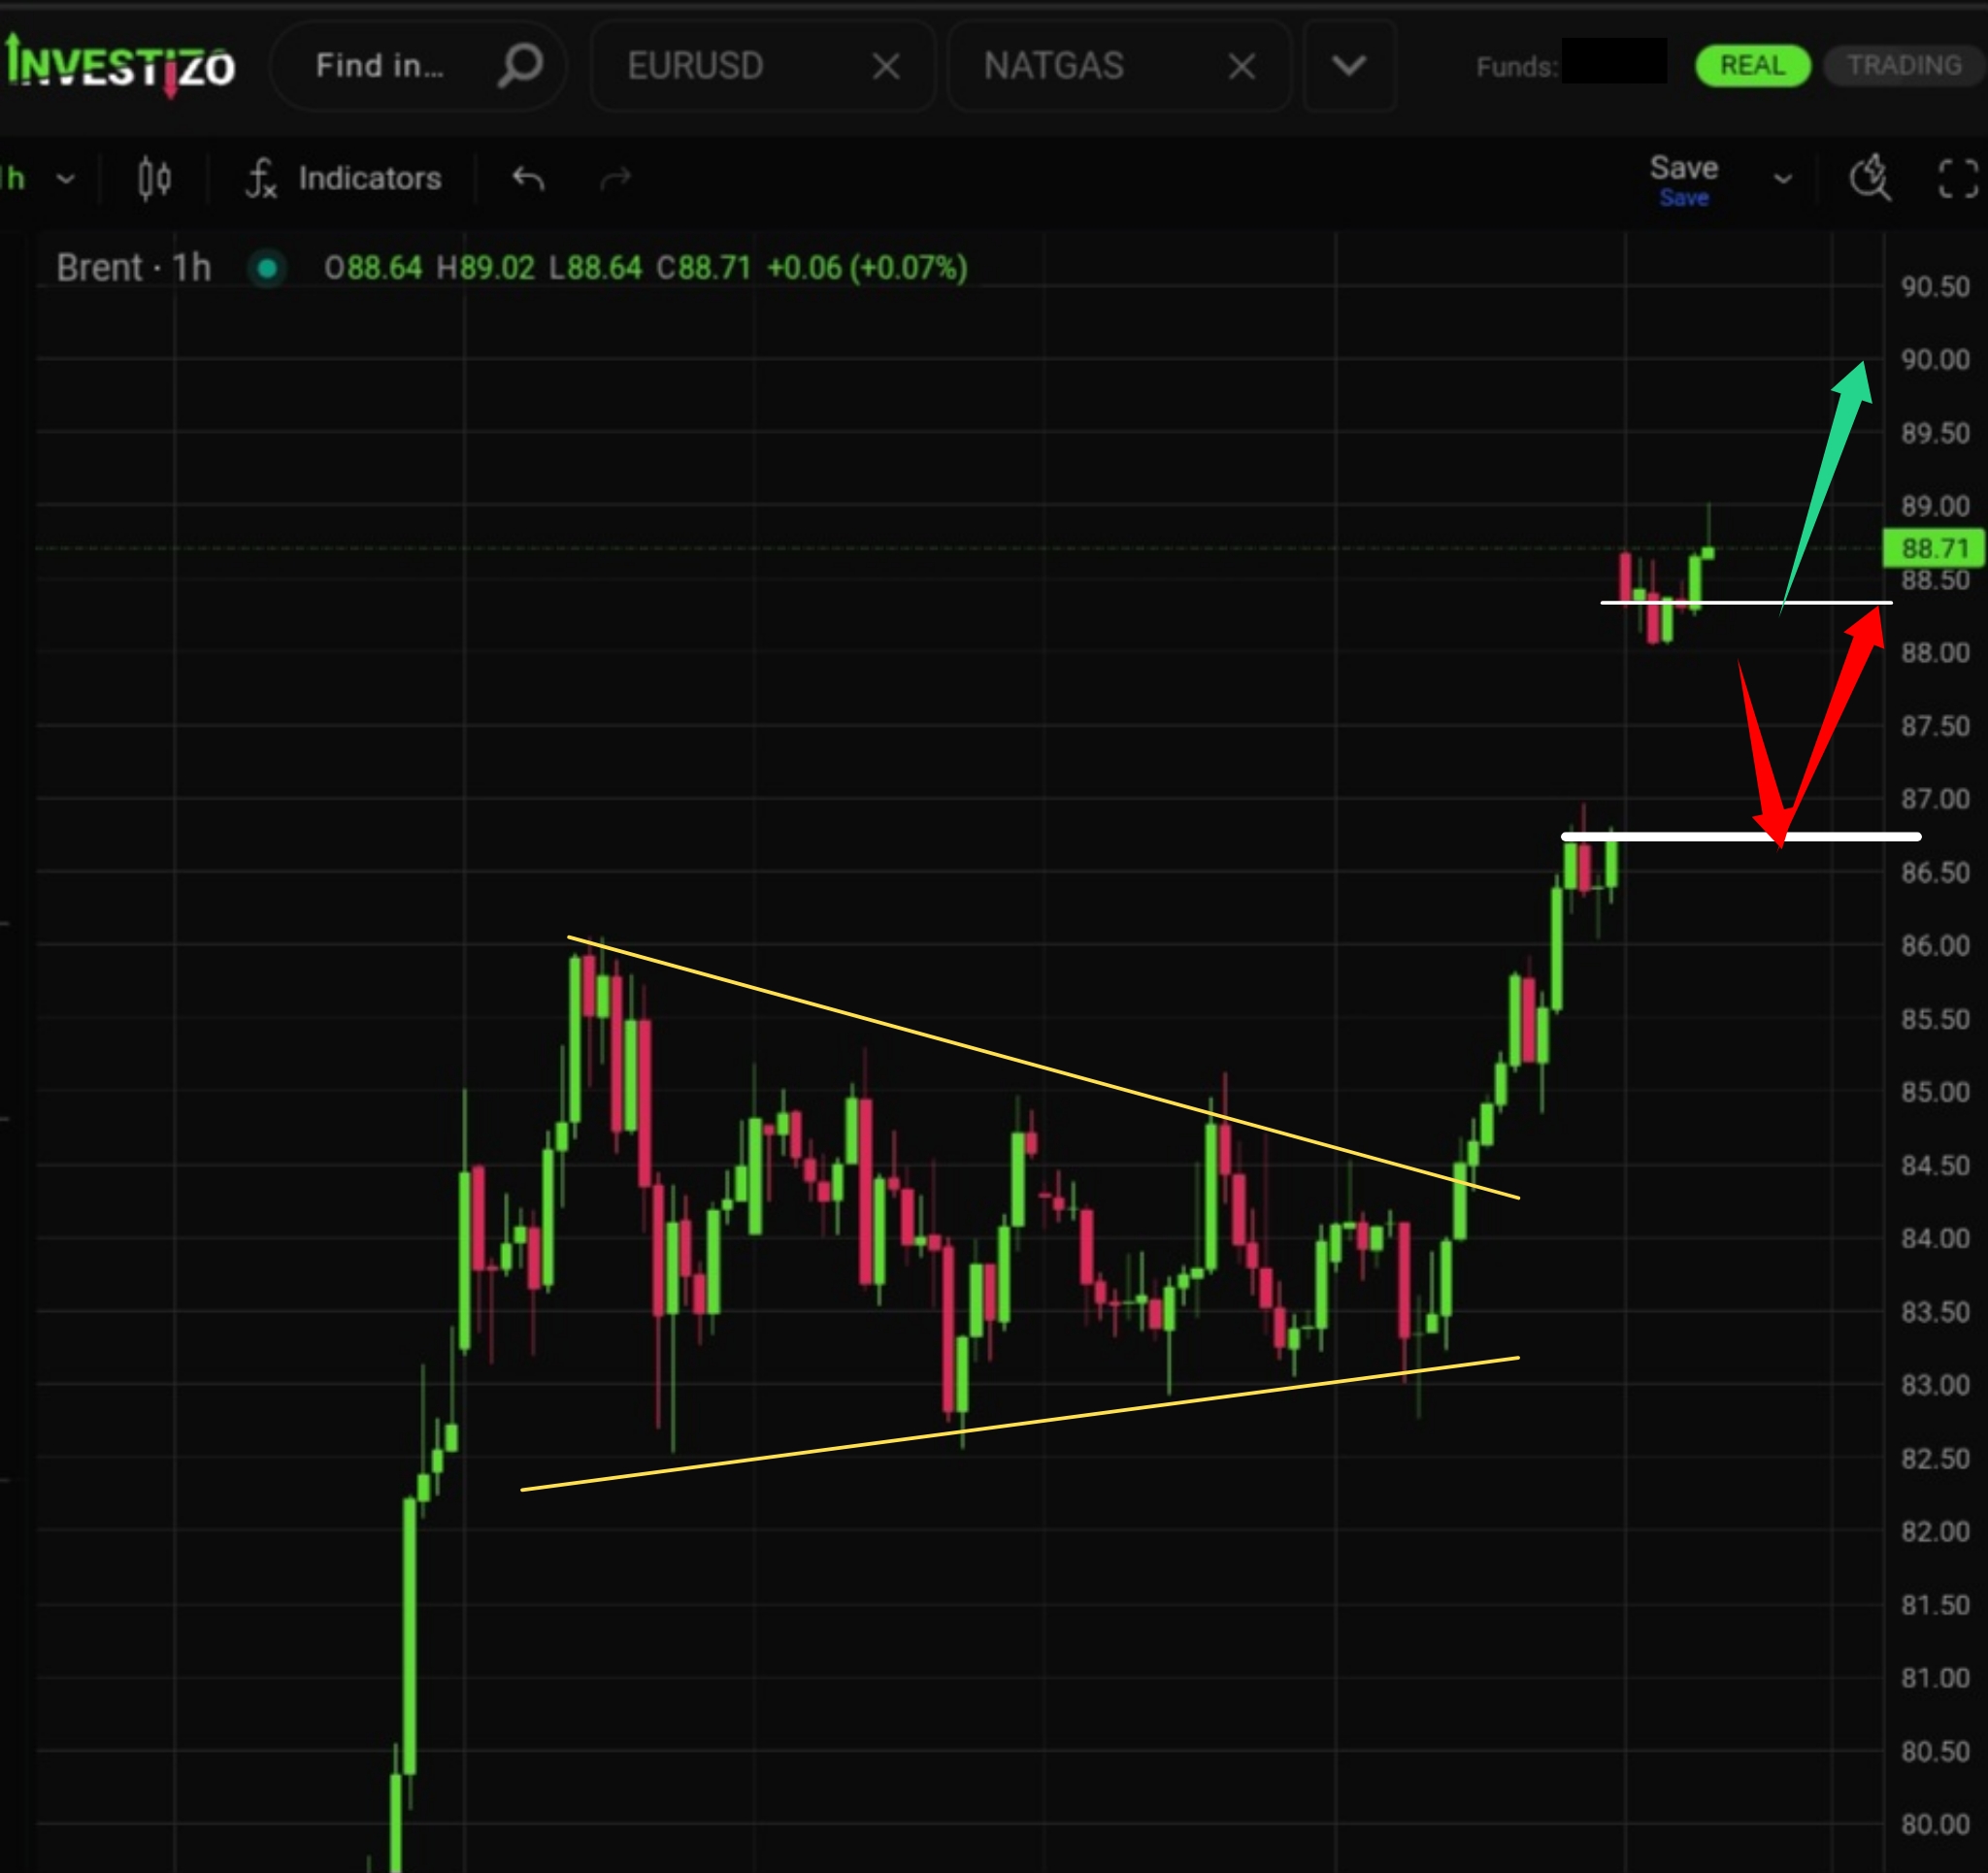
Brent Crude trades at 88.71 this Monday morning, opening the week with a massive upside gap in the region of 86.80 and sustaining its most explosive weekly rally since April.
The downward correction is targeting the strong support level at 1.3400, which represents a significant confluence zone.