USDCAD H1: The Chaos Theory Forecast for the Asian Session on 3.2.2025
01.02.2025 01:16
Técnico
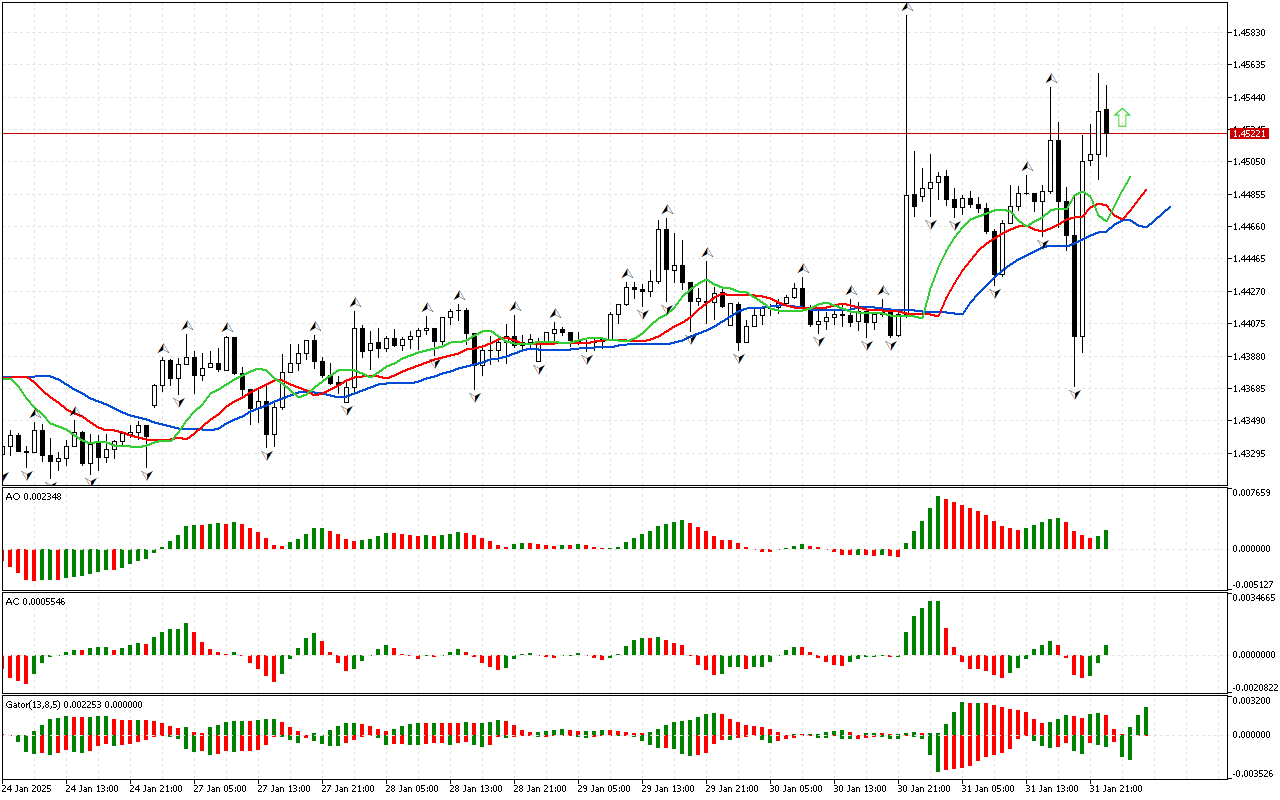
According to USDCAD, the phase space is defined as northern, since the price has risen above the upper fractal. Now we can examine signals from other market dimensions within the framework of Bill Williams' strategy.
The phase space is defined as northern, but the Alligator's lines are intertwined, which signals a high degree of uncertainty in the market because the Alligator is sleeping. However, the signal from the first phase of the market remains relevant.
The Saucer signal has appeared on the Awesome Oscillator indicator. This signal indicates a possible change in the direction of the market movement to upward. As Bill Williams notes, the Saucer signal is one of the strong AO indicator's signals and can be used to determine when to enter or exit the market. Traders may be considering opening a position up. This signal can be strengthened by other indicators.
There is a series of green bars below the zero mark on the AC indicator. A positive signal indicate an increase in energy of the movement in the northern direction.
As it is seen, the AC and AO indicators are in the green zone, which indicates that there is enough strength and energy to continue the movement in the northern direction.
The histogram of the Gator indicator has not formed a clear signal yet. The color of the histograms changes, indicating a change in market phase.
Let's summarize. The phase space is defined as northern. The same direction of movement is predominantly proved by other indicators. Against this background, intraday it is worth considering the long positions.
📊 Buy Stop 1.45585
❌ Stop Loss 1.44795
After entering the market, Stop Loss is carried along the red line after the closing of each candle. The profit is fixed by moving Stop Loss, or when opposite signals appear on the AO, AC, Gator indicators.