
General analysis AUDUSD for 05.07.2022
Current dynamics
Despite the upbeat start of the AUD/USD pair at the beginning of this week's trading session. However, the pair lost its gains in the second half of its session today, Tuesday, after the announcement of the interest rate hike from the Reserve Bank of Australia. The pair had witnessed its lowest level in two years at the end of last week's session.
Whereas, although the Australian monetary policy makers decided during the Reserve Bank of Australia meeting to raise interest rates by 50 basis points from 0.85% to 1.35%, which came in line with expectations. However, the Reserve Bank of Australia's neutral tone on future monetary policy expectations may be one of the main reasons for the pair's recent decline, along with persistent fears of economic recession.
Reserve Bank of Australia Governor Philip Lowe stated through his monetary policy statement that strong demand, a tight labor market and capacity constraints in some sectors are contributing to the increasing pressure on prices and that the RBA intends to take additional steps towards normalizing financial conditions, adding that in Australia, inflation is high, But it is not as high as in many other countries and that the size and timing of future interest rate increases will be informed by economic data, inflation assessment and future labor market expectations.
In terms of data, Australian Building Permits for May posted a surprise jump to 9.9% MoM vs. -1.8% expected and -3.9% previously while Housing Loans also improved to 2.1% from -7.3% previous reading and -2.0% market consensus. The final reading of the retail sales index, which confirmed a growth of 0.9%, was in line with expectations, unchanged from the preliminary reading for the month of May.
Looking to the future, AUD/USD traders will focus on US factory orders for the month of May to look for evidence of today's movements, ahead of the FOMC meeting minutes and the US jobs report for June.
Support and resistance levels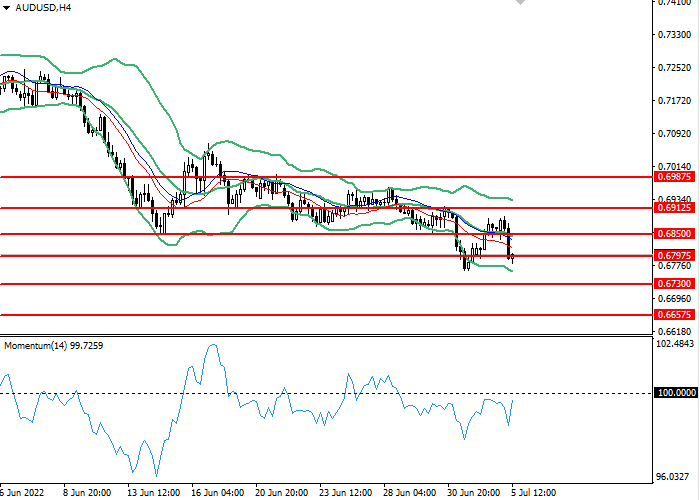
On the 4 hour chart, the instrument failed to consolidate above the Bollinger Bands moving average. The indicator is pointing downwards, which indicates that the current trend is about to continue. The momentum chart is below the 100 level, which gives buy signals. The Envelopes indicator gives sell signals.
- Support levels: 0.67975, 0.67300, 0.66575.
- Resistance levels: 0.68500, 0.69125, 1.0650, 0.69875.
Trading scenarios
- Short positions should be opened at the 0.67975 with a target of 0.67300 and a stop loss at 0.68500. Implementation period: 1-3 days.
- Long positions can be opened above the level of 0.68500 with a target of 0.69125 and a stop-loss at the level of 0.67975. Implementation period: 1-3 days.