
Fundamental analysis of USDCAD
Macroeconomic news summary:
US:
The U.S. Federal Reserve reiterated its strategy of gradually reducing stimulus, which caused the dollar to strengthen. This may increase pressure on the CAD.
The latest U.S. jobs data beat forecasts, which also supports the U.S. currency.
Canada:
The Canadian economy has shown solid growth, which supports the CAD. However, the Bank of Canada kept interest rates unchanged, which can put pressure on the CAD.
Oil prices are rising in Canada, which may also support CAD, considering that Canada is one of the biggest oil exporters.
Macroeconomic Statistics Impact:
S&P Global's Business Activity Composite Index (PMI) (May): If the actual figure exceeds the forecast, this could indicate a strengthening U.S. economy and support the USD.
Services Business Activity Index (PMI) (May): An increase in this index could also indicate a strengthening U.S. economy and put pressure on the CAD.
Factory Orders (MoM) (Apr): Should it rise, it may indicate an increase in demand for manufactured goods and support the USD.
Non-Manufacturing Employment (ISM) (May): A slight increase in this indicator could indicate an improvement in the U.S. labor market and support the USD.
ISM Non-Manufacturing Purchasing Managers' Index (May): If this figure declines, it could indicate slowing growth in the non-manufacturing sector and put some pressure on the USD.
Technical Analysis and Scenarios:
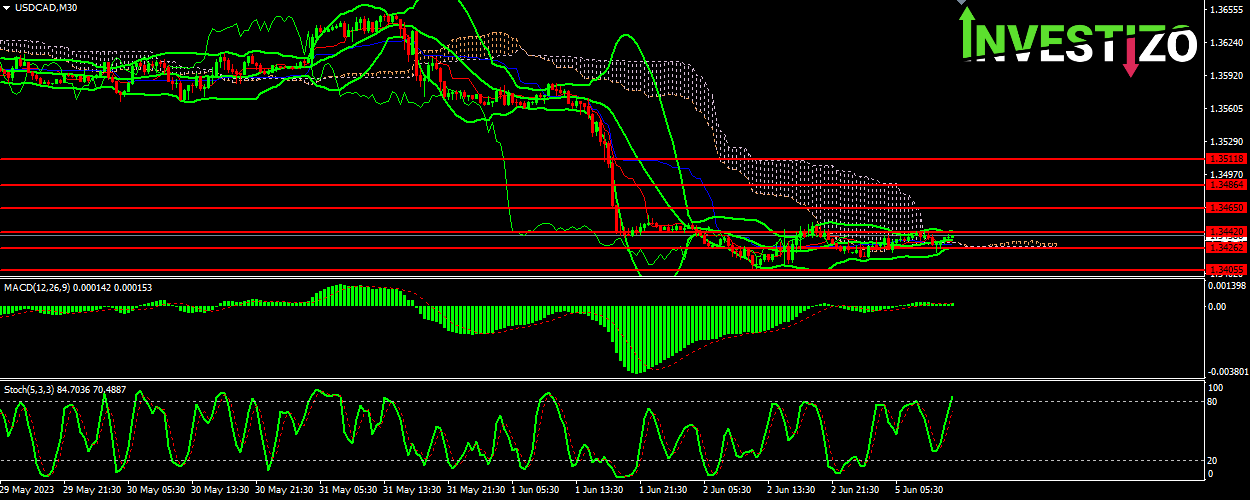
Stochastic Oscillator: The value of 67.5182 indicates that the USD/CAD currency pair is in a zone below overbought, which may portend a possible decline in the near future.
Bollinger Bands: The price is in the upper range of the indicator, which may indicate a possible decline. However, given that the indicator is pointing sideways and the price range is much narrower, this might also indicate a possible start of a new trend.
MACD: MACD value is below the signal line which could indicate a continuation of the down trend. However, the difference between the MACD and the signal line is small, which could indicate a possible weakening of this trend.
Support levels: 1.33955, 1.34050, 1.34265
Resistance levels: 1.34400, 1.34650, 1.34865, 1.35110
Main scenario: If the price overcomes the resistance level of 1.34400, it may indicate the beginning of an uptrend. In this case, the next resistance level of 1.34650 could be the target for take profit, while the support level of 1.34265 could be the stop loss level.
Alternative scenario: If the price overcomes the support level of 1.34265, it may indicate the strengthening of the downtrend. In this case, the next support level of 1.34050 could be the take profit target and the stop loss level could be the resistance level of 1.34400.