
Fundamental analysis of XAU/USD
Gold is expected to rise for the third week in a row amid negative sentiment on the economic recovery, given the Fed's expectations for a delay in inflation beyond July and important statements from central banks in the US, Europe and Japan. Rising U.S. labor market data combined with losses in U.S. energy and technology stocks drove up U.S. Treasury yields and supported the dollar. However, this was somewhat influenced by concerns over the economic situation in China, putting gold enthusiasts on high alert. Despite these storms, hedging against the world's second largest economy and the dollar ahead of the next Fed meeting led to a rebound in the XAU/USD exchange rate, breaking a two-day decline. It should be noted that after July, which created positive expectations for gold investors, most information in the United States did not fully confirm the Fed's decision to raise interest rates.
Market analysts expect the last rate hike in the current tightening cycle to be 25 basis points at the Fed meeting scheduled for July 25-26. Low interest rates may increase the attractiveness of gold as a safe haven asset. However, gold's future path will not be easy. Real interest rates will limit its upside in the short to medium term, especially in the absence of major shocks to the economy. Although the US Dollar Index (DXY) is down slightly, it is still rising this week, as are US Treasury yields. China's currency regulator is keen to keep the yuan stable and avoid major fluctuations in the exchange rate. In the coming days, market attention will be focused on the Bank of Japan's policy change meeting, as well as a Reuters analysis showing a forecast for a 25 basis point rate hike by the European Central Bank. Overall, the gold price looks strong. Investors are willing to keep a close eye on central bank meetings and stock markets for more guidance from the market.
Technical analysis and scenarios:
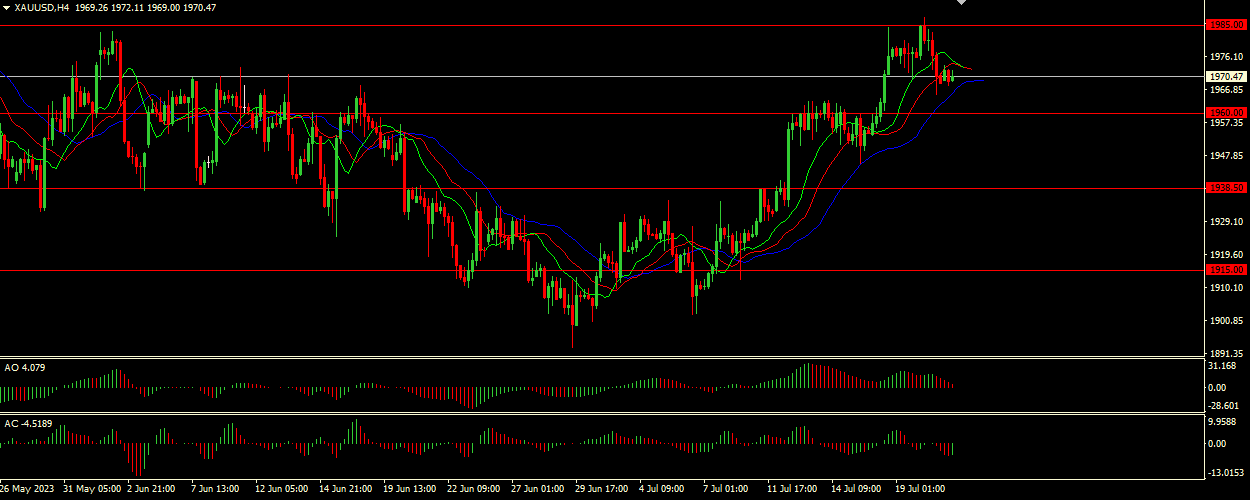
The gold pair (XAU/USD) is currently trading at 1970.50. This price is located between several key support and resistance levels: immediate resistance is located at 1985.00, followed by 1990.00 and the key psychological level of 2000.00. On the downside, support is located at 1960.00, followed by 1938.50 and 1915.00. Indicator analysis shows that the market is in a range, which is confirmed by the Alligator, which is hibernating. This indicates that the moving averages are intertwined and the instrument is flat, indicating that there is no clear market direction. In addition, the Awesome Oscillator (AO) and Accelerator Oscillator (AC) are in the "gray" zone, indicating a divergence. Given this divergence, the signals are not strong enough to speak with confidence about the optimal entry point.
Main scenario (BUY)
Recommended entry level: 1985.00.
Take Profit: 1990.00.
Stop-loss: 1982.00.
Alternative scenario (SELL)
Recommended entry level: 1969.50.
Take Profit: 1938.50.
Stop loss: 1980.00.