
Fundamental analysis of USD/JPY
The USD/JPY pair is trading around the 141.400 level as market participants adopted a wait-and-see stance ahead of Federal Reserve (Fed) and Bank of Japan (BoJ) interest rate decisions.
Mixed US PMI data, including last week's data showing economic losses and improving business conditions, sparked speculation that the Fed should not tighten monetary policy after an expected interest rate hike in July. The market is awaiting Fed Chairman Jerome Powell's press conference on Wednesday for guidance on the direction of interest rates this year. Also, the current US consumer confidence data for July will have a significant impact on the pair. The Consumer Confidence Index is expected to rise from 109.7 to 111.5, indicating further growth in consumption, boosting economic demand.
On the other side of the Pacific, Bank of Japan Governor Kazuo Ueda dismissed rumors of a change in yield curve policy and warned that the 2% inflation target has yet to be reached. This means that the BOJ may maintain its dovish policy of keeping inflation above 2%.
Investors are looking forward to the Federal Open Market Committee and Bank of Japan meetings scheduled for Wednesday and Friday as these events could lead to changes in the financial market. Later this week, key economic indicators such as the annual core Tokyo consumer price index, U.S. GDP growth last month and personal consumption expenditures, a measure of economic demand determined by the Federal Reserve, will be released. Traders should use this information to form a trading plan for the USD/JPY currency pair.
Technical Analysis and Scenarios:
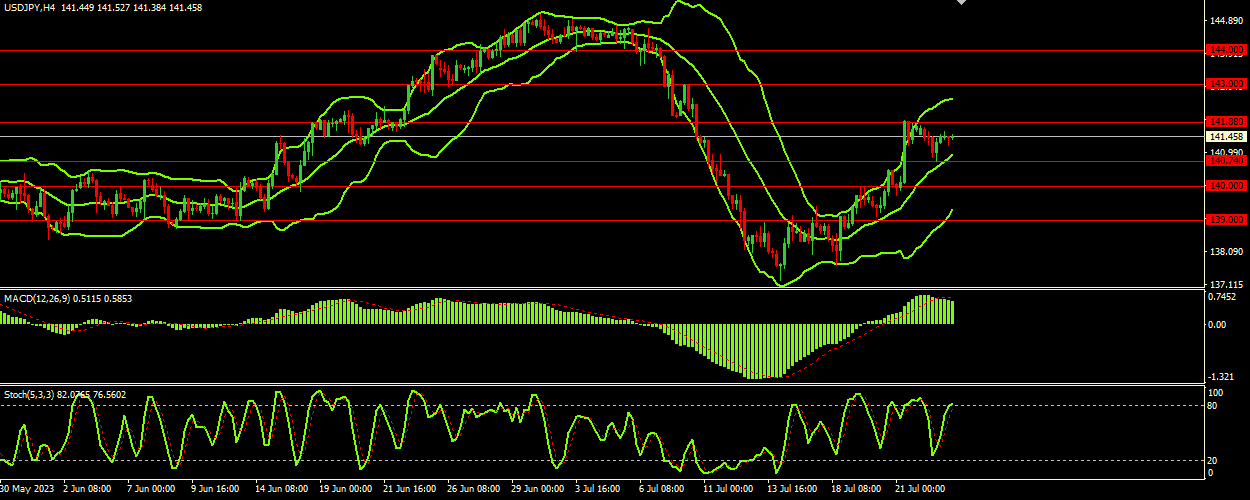
The USD/JPY pair is currently trading near the 141.480 level, staying within a relatively narrow range. The currency pair is experiencing significant support levels at 140.740, 140.000 and 139.000, while resistance is found at 144.000, 143.000 and 141.880. The Stochastic Oscillator (Stoch(5,3,3,3)) points to a value of 82.8344, which is in overbought territory, which is a bearish signal. The indicator is trending upward and crosses the signal line at 76.8129, which may indicate an upcoming price reversal. The Bollinger Bands show the upper band at 142.550 and the lower band at 139.320, while the middle band is at 140.970. The price is trading in the upper range of the indicator and the narrowing of the price range coupled with the upward bias of the indicator suggests a possible continuation of the uptrend. MACD (12,26,9) is currently at 0.5131, which is below the signal line at 0.5855. This could indicate bearish momentum in the short term.
Main scenario (BUY)
Recommended entry level: 141.880.
Take Profit: 143.000.
Stop loss: 141.100.
Alternative scenario (SELL)
Recommended entry level: 140.740.
Take Profit: 140.000.
Stop loss: 141.100.