Technical analysis AUDCAD for 22.09.2023
۲۲.۰۹.۲۰۲۳ ۰۱:۱۲
معاملات یکروزه (Intraday)
تکنیکال
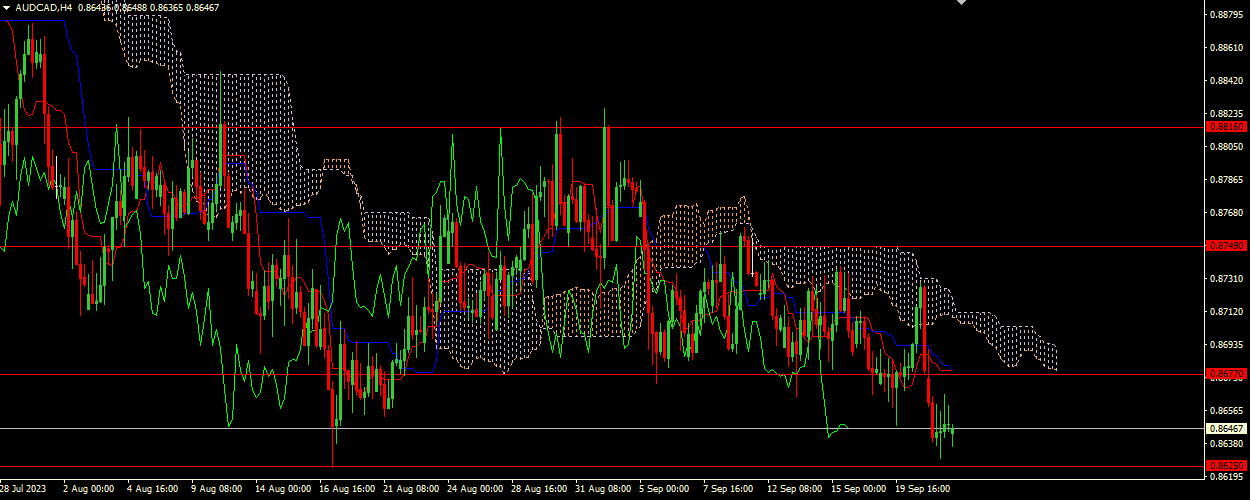
The Tenkan-sen line is located above the Kijun-sen line. Blue is directed downward, while red remains horizontal. Confirmatory line Chikou Span is below the price chart. In this case, the cloud is descending. Instrument is trading below the Tenkan-se and Kijun-sen lines. The closest resistance is the level 0.86770. The closest support is the level 0.86250
Key levels
- 0.88160, 0.87490, 0.86770, 0.86250, 0.85230
Trading scenario
- Recommended opening long positions (Buy Stop) from the level of 0.86770, with Take Profit of 0.87490 and Stop Loss of 0.86490
Alternative scenario
- Recommended opening short positions (Sell Stop) from the level of 0.86250, with Take Profit of 0.85230 and Stop Loss of 0.86490
سناریو
توصیه
BUY STOP
نقطه ورود
0.86770
حد سود (TP)
0.87490
حد ضرر
0.86490
سطوح کلیدی
0.88160, 0.87490, 0.86770, 0.86250, 0.85230
سناریوی جایگزین
توصیه
SELL STOP
نقطه ورود
0.86250
حد سود (TP)
0.85230
حد ضرر
0.86490