
Fundamental analysis of XAU/USD
Gold prices, as represented by the XAU/USD index, have declined markedly recently, reaching their lowest level in almost 7 months.
This decline comes as traders study US inflation statistics and await upcoming employment data along with the US Federal Reserve's stance on tightening monetary policy in many areas, especially recently. A stronger US dollar put pressure on gold as the metal fell in price by 3.7% at the end of the third quarter. U.S. data shows a more stable trend. Although inflation has been showing signs of slowing since August, as evidenced by the core PCE price index, the market still doubts the feasibility of using current interest rates to effectively manage inflation. The situation is complicated by conflicting views from Fed officials, including Neel Kashkari and John Williams, on the future path of interest rates. A stronger dollar, driven by the prospect of higher interest rates, has pushed the dollar to a 10-month high, which has put pressure on yield-neutral gold. At the same time, 10-year US Treasury yields fell after hitting a 15-year high, indicating a divergence in inflation expectations.
Current market sentiment shows an almost equal split between the likelihood of another rate hike this year and policy easing in the first half of 2024, as indicated by the CME FedWatch tool. Gold's future trajectory is closely tied to interest rate movements. While gold is often seen as a hedge against economic uncertainty, this demand is now being challenged by the uncertain U.S. economic scenario. The consensus, at least in the short term, leans towards a bearish outlook for gold. This outlook is reinforced by the view that the US Federal Reserve may maintain high interest rates for an extended period of time. This situation is considered to be one of the main factors pushing investors away from gold, a non-income producing asset. Despite a brief positive recovery following the publication of the US PCE Price Index, gold's trajectory remains predominantly bearish, further pushed by rising US Treasury yields, which reinforce its attractiveness. This slowdown has continued for six consecutive days, marking one of the longest negative streaks on record.
Other external factors contributing to this trend include China's positive official PMI and the recent funding bill for the US government. Given the described fundamental factors, gold's trajectory appears to be downward. However, its extremely bearish stance requires traders to be cautious. In the new month, which will start with the release of the US ISM manufacturing activity index and end with the much-awaited NFP report, traders and investors should be cautious given the economic implications Macroeconomic implications on gold price dynamics.
Technical analysis and scenarios:
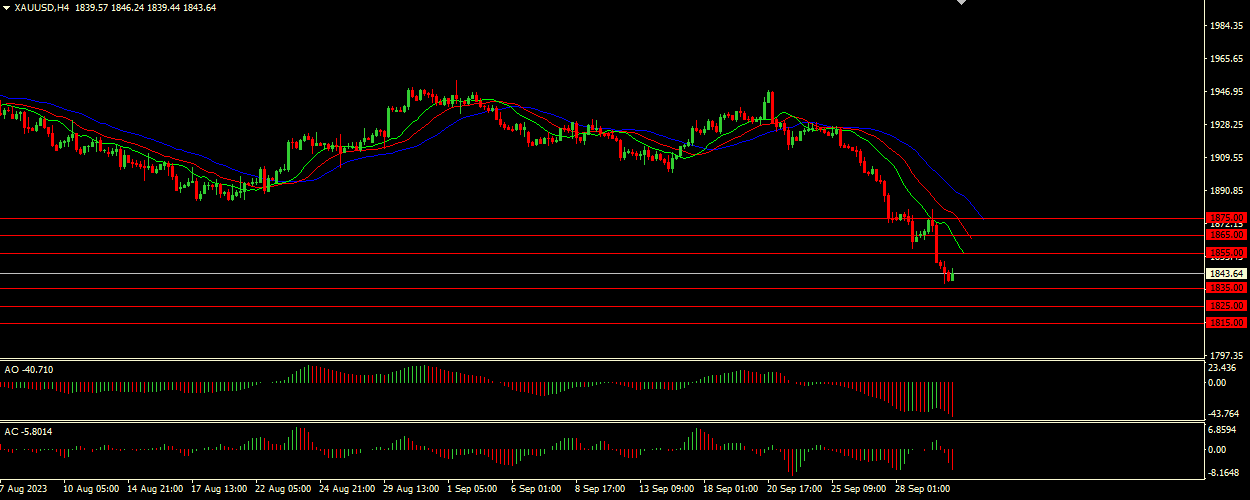
A wide open alligator mouth with the jaw (blue line) well above the lips and teeth (green and red lines) indicates a strong downtrend. This indicates the presence of bearish momentum. Both oscillators in the red zone indicate rising bearish momentum and further emphasize the potential for a downward move. Given the strong bearish signals from Alligator, AO and AC, the main outlook is leaning towards the downside.
Main scenario (SELL)
Recommended entry level : 1835.00.
Take Profit: 1825.00.
Stop-loss: 1840.00.
Alternative scenario (BUY)
Recommended entry level: 1855.00.
Take profit: 1865.00.
Stop loss: 1850.00.