
Fundamental analysis of WTI
The black gold market is experiencing complex dynamics depending on a number of factors. Prices are declining ahead of key events such as the consumer price index and Federal Open Market Committee reports.
Investors are watching the Federal Reserve's stance on interest rates, weighing interest rate expectations and the risk of an interest rate hike if inflation continues to rise. Minutes from the Fed's November meeting showed that if inflation does not decline, interest rates will continue to rise, but if inflation and economic conditions decline, rates could be cut in 2024.
Geopolitical tensions, including the recent missile attack on a chemical tanker in the Red Sea by Yemeni rebels, have further complicated oil markets and raised safety concerns along oil transportation routes. OPEC+'s plan to cut production by 2.2 million bpd in early 2024 is also in doubt as non-OPEC countries increase supply.
Weak regional markets in the Pacific and West Africa will exacerbate the situation. The short-term outlook for the oil market remains uncertain, with oversupply dominating the market and doubts about the effectiveness of OPEC+ production cuts. US consumer prices are expected to decline to 3.1% from 3.2% and monthly inflation is expected to rise 0.1%. The Fed is expected to keep its key interest rate unchanged, with markets expecting a rate cut as early as spring. Rising shale oil production in the US and unexpected earnings from non-OPEC producers indicate and confirm changes in oil production, adding to market uncertainty.
Technical analysis and scenarios:
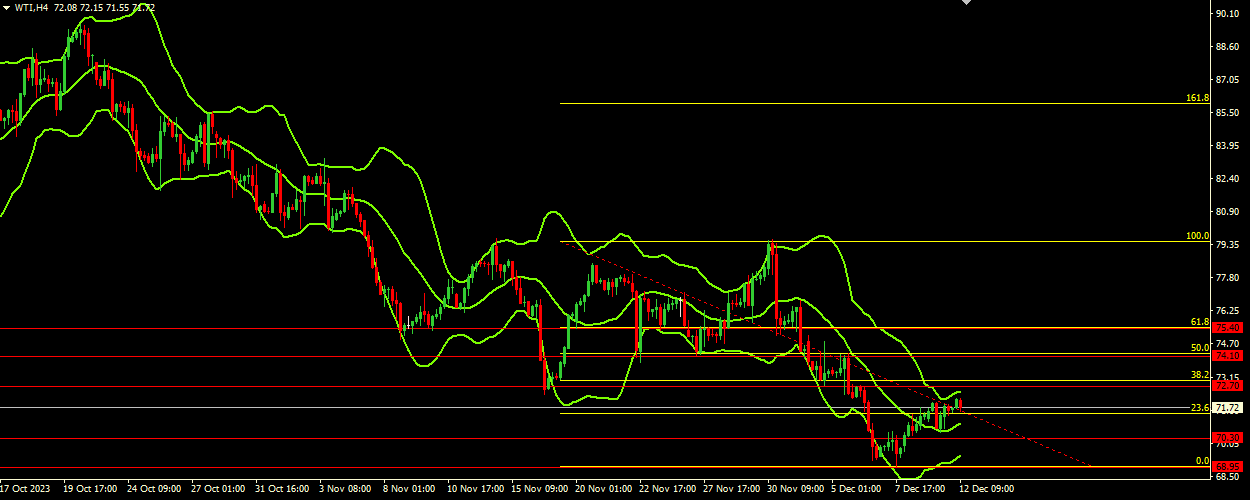
The upper Bollinger Bands band is at 72.40 and price is currently trading below this level, indicating that there is room for upside movement within the current band. However, approaching the upper band could signal overbought conditions. The middle band at 70.95 could act as a psychological level, offering support. If the price stays above this level, it may indicate that the bullish sentiment remains in place.The lower band is at 69.45, which coincides with the first support level. A move towards the lower band could indicate bearish sentiment, but the band could also serve as a strong support. The bands are pointing upwards, indicating increasing market volatility. The wide price band indicates that significant price movements in either direction are possible. The fact that the price is declining in the upper range of the Bollinger Bands suggests that there has been bullish momentum recently, but it may be losing strength. This could indicate a potential reversal or consolidation phase. Overall, technical analysis suggests a cautious bullish bias in the short term, with key levels and Bollinger Bands serving as clear markers for potential price movement. However, given the volatile nature of WTI oil, it is important to keep an eye on market news and be prepared for sudden changes in trends.
Main scenario (BUY)
Recommended entry level: 72.70
Take Profit: 74.10
Stop Loss: 71.70
Alternative scenario (SELL)
Recommended entry level: 70.30
Take Profit: 68.95
Stop loss: 71.00